But those economic indicators are so HOT!
Economic data has been coming in more positive lately, which has led some to get a wee snarky with yours truly over my finger-wagging warnings that the market is exceptionally pricey. Ok then, game on!
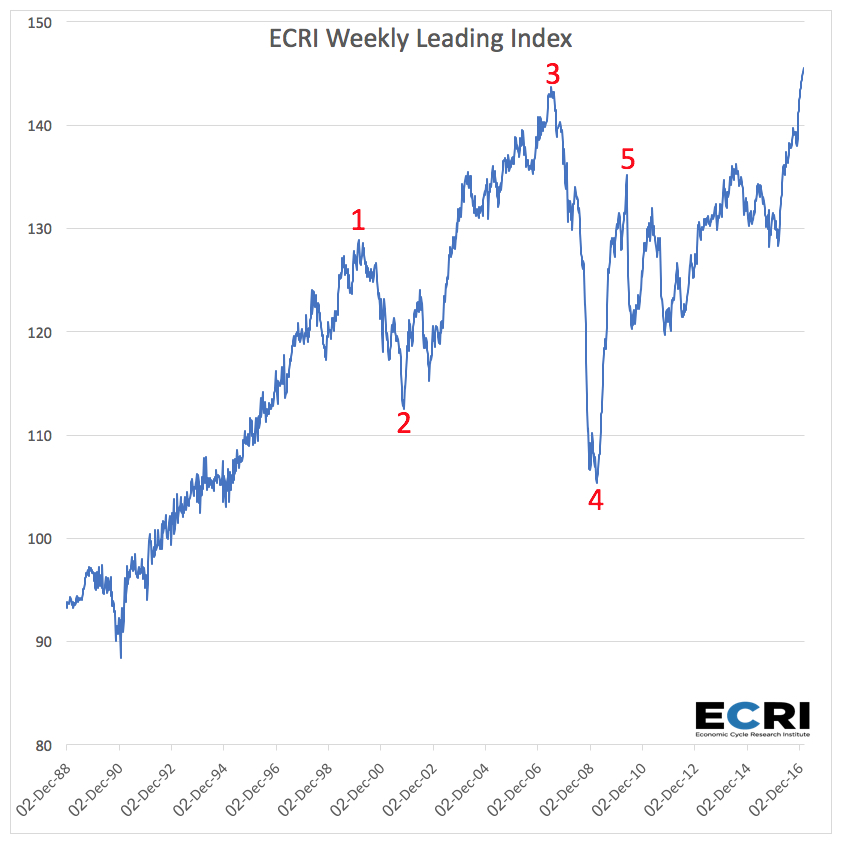
The chart below is the Economic Research Institute’s Weekly Leading Index, which according to ECRI, “has a moderate lead over cyclical turns in U.S. economic activity. Historical data begins in 1967.” It is widely considered one of the better leading indicators for the economy.
Marker #1
January 28, 2000, the index hit a top of 128.9. From that date to the end of September 2001:
- S&P 500 lost 23.6 percent
- NASDAQ lost 61.9 percent
- Russell 2000 lost 21.1 percent
- Dow Jones Industrials lost 17.7 percent
Marker #2
October 19, 2001, the index hit a low of 112.6. From that date to when the index topped out again on June 8, 2007:
- S&P 500 gained 40.5 percent
- NASDAQ gained 54.0 percent (Note that it had not yet recovered prior losses)
- Russell 2000 gained 9.2 percent
- Dow Jones Industrials gained 45.9 percent
Marker #3
On June 8, 2007, the index hit a peak of 143.7. From that date to March 6, when the index bottomed out:
- S&P 500 lost 55.1 percent
- NASDAQ lost 50.7 percent
- Russell 2000 lost 58.9 percent
- Dow Jones Industrials lost 51.2 percent
Marker #4
March 6, 2009, the index hit a low of 105.7. From that date to when the index topped out again on April 30, 2010:
- S&P 500 gained 73.7 percent
- NASDAQ gained 90.2 percent
- Russell 2000 gained 104.1 percent
- Dow Jones Industrials gained 66.1 percent
Marker #5
On April 30, 2010, the index hit a peak of 135.2. From that date to October 7, 2011, when the index bottomed out:
- S&P 500 lost 2.6 percent
- NASDAQ was flat
- Russell 2000 lost 8.4 percent
- Dow Jones Industrials was flat
In the weeks and months before each time this leading indicator peaked, along with many other similar ones, the headlines were all about how the economy was moving along so well, champagne and caviar all around and frequently the stock markets were accelerating as well. Only in hindsight could one have seen that we were heading for a major turn and the markets were going to experience a painful pullback. On the flip side, where the indicator has bottomed out, that was time to get seriously bullish.
Bottom Line: A rising leading indicator is not necessarily a bullish sign for stocks. Stock market returns are in the end, about valuation. Buy cheap and sell expensive. Today stocks are priced at Louis Vuitton levels. Can they go higher? Absolutely, they likely will as we often see an acceleration to the upside just before a major turn. But know that downside risks are rising and upside potential shrinking with every step into more expensive territory.


