WEEKLY WRAP: The Drum Beat Carries On
While the calendar has turned, the beat remains the same as the market rips higher and consumers go deeper into debt
While Mother Nature is once again having her way with part of the U.S., the Dow ripped past 25,000, the S&P 500 hit 2,700 for the first time and the Nasdaq broke 7,000 for the first time. We are in this bizarre world where three record highs in a week are yawnsville, but then again, we have to remember the S&P 500 has closed in the green for 14 consecutive months, an unprecedented record. The Dow is no slouch either, as it has crossed a new 1,000 point mark a whopping six times in the past twelve months.
While stocks make new highs, the short-term yields on Treasuries continue to climb, with the 2-year hitting a multi-year high. Longer-dated yields haven’t budged much, which has led to the spread between the 10-year Treasury and the 2-year to hit the lowest level since 2007. The same goes for the spread between the 30-year and the 10-year.
Stocks are partying like its 1999 but the 10-year Treasury and the DXY Amex U.S. dollar index are singing a very different tune with the 10-year rate having fallen rather consistently since late 2016 and the DXY near 3-year lows. The dollar has just concluded its worst annual performance in a decade! These mixed signals are meaningful.
The driving narrative for stocks as we kick off the first week of 2018 is the impact of tax reform on earnings and the overall economy. According to FedEx (FDX), the Tax Cuts and Jobs Act is estimated to increase earnings per share by $4.40 to $5.50 per diluted share for FY 2018 before adjustments. Looking at the broader market, Bank of America (BAC) boosted its 2018 EPS estimates for the entire S&P 500 by a full 10% (about $14) to $153 a share. That estimate reflects an increase of $10 from the lowering of the federal tax rate from 35% to 21% and another $3 increase from incremental buybacks induced by the tax reform.
Looking back at 2017, earnings in the U.S. improved by around 10% while stocks gained roughly 20%, so we’ve already seen some significant multiple expansion in multiples and over the last three months of last year the multiple on the S&P 500 rose to over 20x on expected 2017 earnings. On a forward basis, the market is currently trading near 18.6x expected 2018 earnings. With the impact of tax cuts already backed in, the forward multiples for the S&P 500 are already ahead of the multi-decade high of 17.5x – so we are dealing with a whole lot of optimism. Who doesn’t like to pay less, rather than more in taxes? We are all for reducing the burden, but we have to be realistic when thinking through the potential impact of these cuts.
The trailing 12-month P/E ratio for the S&P 500 is today just shy of 23, a level rarely seen over the past four decades. This level wasn’t reached once in the last bull market ending in 2007. It was consistently above 23 during the last couple of years prior to the dotcom bubble bust, so we do have room to run, but let’s be clear – we are in rather heady territory.
This week’s sentiment survey from the American Association of Individual Investors found that bullish sentiment has increased to 59.75%, which is the second highest reading for bullishness of this bull market and marks the third consecutive week with sentiment over 50%. The bears are disappearing, with bearish sentiment down to 15.6% – the only week this level was lower was back in November of 2014 when it hit 15.1%.
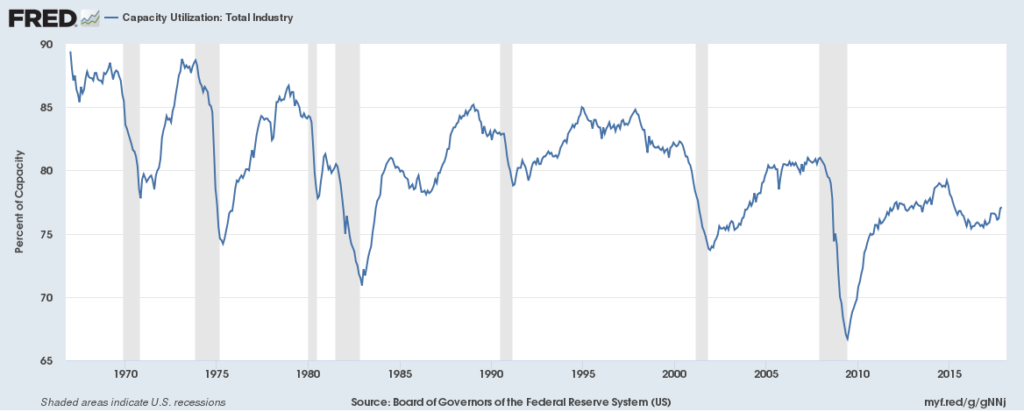
The overwhelming optimism pushing share prices higher appears to be indifferent to the reality of a capacity utilization rate sitting at 77.1%, well below the 80%+ level from 2005 to 2008 and the 80%-85% range in the 1990s. While it may not be popular to say, the reality of the situation is with low utilization rates, the expected bump in capital spending is likely overstated no matter how much capital is freed up by tax reform.

Corporate America today is already flush with a historically high level of $2.4 trillion in liquid assets. Realistically, just what will be the marginal impact of that extra cash generated by tax reform? This was a topic we discussed at length on our Cocktail Investing podcast this week.
We aren’t alone in our thinking as this week’s release of the December Federal Open Market Committee (FOMC) policy meeting notes reveals that, (emphasis mine) “Many participants judged that the proposed changes in business taxes, if enacted, would likely provide a modest boost to capital spending, although the magnitude of the effects was uncertain…. However, some business contacts and respondents to business surveys suggested that firms were cautious about expanding capital spending in response to the proposed tax changes or noted that the increase in cash flow that would result from corporate tax cuts was more likely to be used for mergers and acquisitions or for debt reduction and stock buybacks.” This helps explain the Fed’s arguably muted GDP forecasts bumps for 2018 and 2019, and let’s remember the Fed tend to be cheerleaders for this kind of thing.
Speaking of the Federal Reserve, let us not forget that the Fed is expected to unwind about $420 billion of monetary stimulus in 2018 and another $600 billion in 2019. This means that by the end of 2018, about two-thirds of QE1 will have been siphoned out of the punchbowl. Obviously, those chosen to serve on the Fed aren’t exactly uneducated fools, but this is the most inexperienced Fed in decades with a decidedly hawkish bent. There are an unprecedented 4 of the 7 FOMC seats vacant, which means only 3 will have been around during the various rounds of quantitative easing.
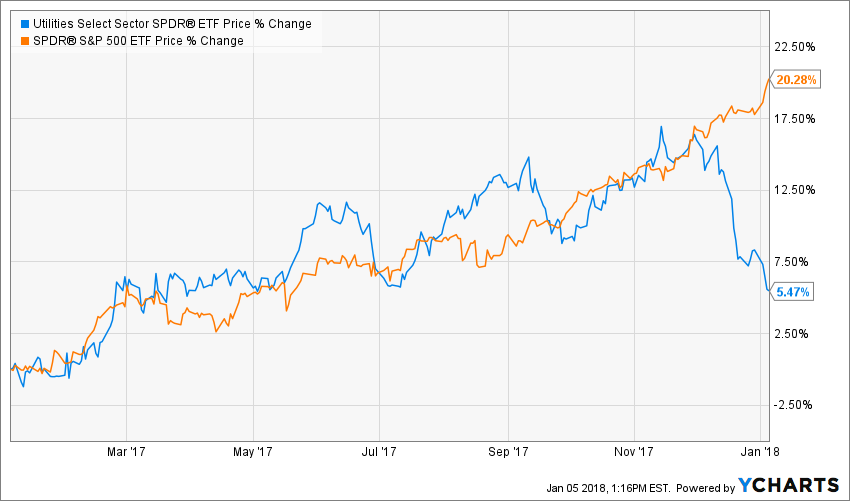
The wild optimism has also had some rather interesting effects on asset classes, (a hat tip to David Rosenberg of Gluskin Sheff for calling this one out). The U.S. Utility ETF (XLU) is lost about 9.8% from its mid-November levels while the S&P 500 has gained 6.3%, leaving XLU with a 16.1% relative underperforming even as new record temperature lows are gripping much of the country causing energy prices to soar. The last time we saw this was in 2015, right before the mid-year correction. Prior to that was in 1999/2000 and many of us recall how things went after that.

On the economic front, this has been a great week with an ISM manufacturing report that was rock solid with 16 of the 18 industries on the rise versus 14 back in December. New Orders hit their best level since January 2004 with production rising to its highest point since May 2010 and the aforementioned weak dollar boosted exports to 58.5 from 56.
Jobless claims rose for the third consecutive week, up 250k from last week’s 247k and 10k above expectations. Claims remain low by historical standards, but we are above the cycle low from last November.
Auto sales came in better than expected at the end of 2017, as did Personal Consumptions, rising 4.5% year-over-year. But those auto sales included dealer incentives amounting to over 11% of the list priced, versus the historical norm of 7%. That holiday spending came at a price with the average American accumulating an average of over $1,000 in debt, about 5% more than last year according to MagnifyMoney’s annual post-holiday survey. That debt was primarily added to high-interest rate credit cards. Spending may be up, but wage growth remains elusive for most, the savings rate is at decade lows and with home prices rising roughly 2 times faster than income levels, home sweet home is becoming further out of reach for many. As we joked on this week’s podcast, before too long we could very well see housing land in our Affordable Luxury investing theme.
The bottom line is the economic data isn’t showing signs of rolling over, but the markets have priced in a whole lot of perfection while the consumer is giving very classic late cycle signals, which we described and discussed in this week’s podcast. We don’t see any immediate signs that market direction is likely to shift, but with volatility remaining incredibly low, portfolio protection is cheap while warning signs are aplenty.

