Weekly Wrap: New Highs Remain Elusive as the Economic Data Comes Up Short
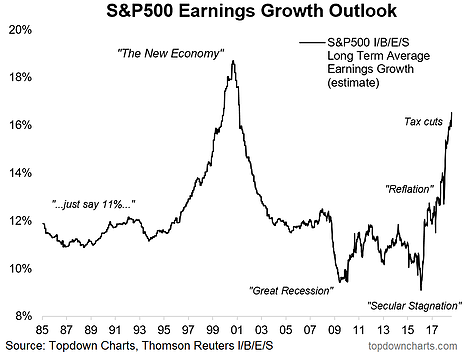
Thus far in August, around two-thirds of the economic data has come in below expectations yet the longer-term earnings growth outlook for the S&P 500 is at the highest levels seen since the later stages of the dot-com bubble
Markets
Monday, the major indices all closed in the green. Tuesday, the S&P 500 finally, after 142 trading days below the January 26th high, made a new all-time high but was unable to sustain that new high into the close. The Russell 2000 outperformed the S&P 500 to close at a record high as concerns around the continuing trade wars and strong dollar weigh on those companies that generate significant revenue internationally, favoring those (usually small cap) whose revenue is primarily domestic-driven. The Dow Jones Transportation Average also closed at a record high. After the market’s close politics took center stage with two former President Trump associates finding themselves facing felonies.
Wednesday the markets didn’t seem overly fussed about the drama in DC as the S&P 500 made, by some accounts, the record for the longest bull market in history. The Russell 2000 closed at a second consecutive all-time high but the Dow Jones Industrial Average and the S&P 500 lost ground, remaining below the January 26thhigh.
Thursday the major indices again closed in the red, but only slightly as we head to the close of the fifth consecutive week of the S&P 500 moving within 3% of its January peak without being able to break through to a new closing high. Meanwhile, the yield curve continues to flatten as the spread between the 10-year and the 2-year Treasury falls to a new post-crisis low of less than 20 basis points. This metric has a fairly solid track record of predicting recessions when it falls to zero.
Looking at the bigger picture of the market, we keep hearing from the mainstream financial media that this bull market run, despite its impressive duration, is unloved. Hard to reconcile those talking points with the reality that households have 32% of their assets in the equity market, a level that is well above the 29% peak in 2007 and is bested only by the period around the dot-com mania in the late 1990s. The pros also look to be fairly fond of this market, US equity portfolio managers sitting on (in aggregate) a liquid asset ratio at near record lows of just 2.7% — that’s not leaving a lot of dry powder sitting on the sidelines. According to Market Vane, bullish sentiment is at 61%.
That all looks to me like a whole lotta love, but I’m not too pleased when I look at what is happening with breadth. So far this year just four companies, Amazon (AMZN), Netflix (NFLX), Microsoft (MSFT), and Apple (APPL) have generated around 40% of the gains for the S&P 500 this year — that is the kind of concentration typically seen as markets are around their tops. When the S&P 500 reached its peak for the year on January 26th, 8 of 11 sectors were at new highs, while this week that number is down to 2. Back on January 26th, 22% of stocks were down 10% or more from their 52-week high. This week that is up to over 40%.
The Economy
It was a fairly quiet week on the economic front, with only a few reports coming out, but the week was in no way a snoozer with plenty of fireworks coming out of Washington, DC. The political tape-bombs had little visible impact on the markets, but they sure did light up social media like a cigarette in a helium factory. Meanwhile, the President and the Federal Reserve are not feeling the love for one another this week.
Wednesday the Federal Reserve released the minutes for the July 31st/August 1stmeeting of the Open Markets Committee whose statement had been more upbeat, using the word “strong” more often than in prior statements. The minutes revealed that the Fed sees greater pricing power, which means they see more inflationary pressures. There were also comments concerning the potential negative impact of declining fiscal stimulus, which has not been discussed much previously and of course, comments concerning the potential negative impact of trade wars. The White House looks to be potentially regretting its nominee for Fed Chair, as President Trump on Monday told Reuters that, “I’m not thrilled with his raising of interest rates, no. I’m not thrilled.”
The Fed doesn’t sound like they are fans of the various trade wars, stating that if they continue.
“… there would likely be adverse effects on business sentiment, investment spending, and employment. Moreover, wide-ranging tariff increases would also reduce the purchasing power of U.S. households. Further negative effects in such a scenario could include reductions in productivity and disruptions of supply chains. Other downside risks cited included the possibility of a significant weakening in the housing sector, a sharp increase in oil prices…”
Overall “trade” and “tariff” got a combined 26 mentions in the latest minutes, up from just 8 mentions earlier this summer.
The President has also not been thrilled with China as there has been no obvious progress made in the trade talks, but the markets don’t seem to be terribly nervous given the current levels of the VIX.
Thursday the US began collecting an additional 25% tariff duties on 279 Chinese imports which range from semiconductors various and chemicals to plastics and motorcycles. This comes after tariffs on $34 billion of Chinese imports implemented in July. Not to be outdone, China retaliated with its own tariffs on $16 billion of US imports ranging from fuel to steel products to medical equipment that took effect at the same time.
Rising interest rates have been another headwind to housing as existing-home sales fell to a 2 ½ year low. Not altogether surprising given that the Home-buyer Affordability Composite index has dropped to a 10-year low. This looks to be a problem more at the mid and lower-end at this week Toll Brothers shares rose as much as 16% after the luxury home-builder reported a 30% increase in profits.
Thursday’s Industrial Production data continued the meh tune with the Flash US Composite Output Index falling from the prior month to reach a 4-month low, with the services component also at a 4-month low while manufacturing hit a 9-month low. Output, new orders and employment growth all moderated month-over-month, with Chris Williamson, Chief Business Economist at IHS Markit reflecting that the Flash August PMI implies “annualized GDP near 2.5%, down from a 3.0% indication in July.” Williams went on to say, “… the survey found increased cases of companies reporting the need to cut costs, in part reflecting the recent steep rise in raw material prices, often linked to tariffs and shortage-related price hikes.”
Across the pond saw a similar result with the August Flash Manufacturing PMI for the Eurozone, while still in expansion territory, at the weakest level in the past 18 months. New order growth was the third-weakest since December 2016 while input costs and selling price inflation rates continued to be among the highest seen over the past seven years but did fall to 3-month lows.
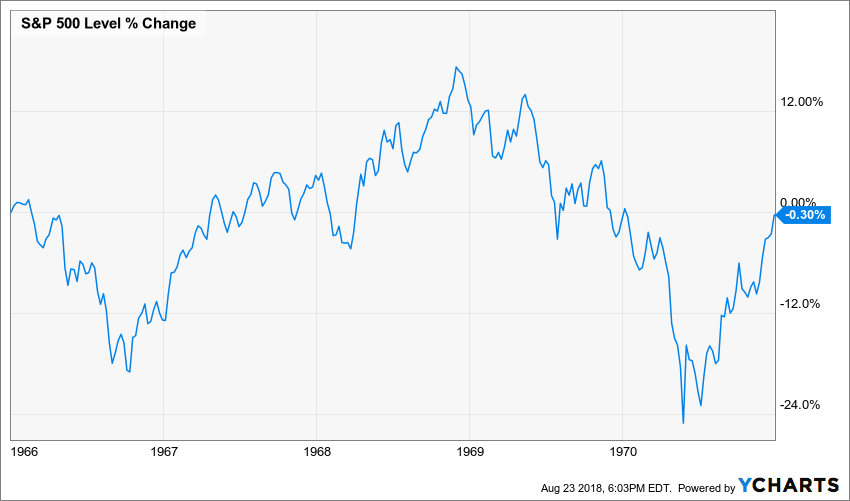
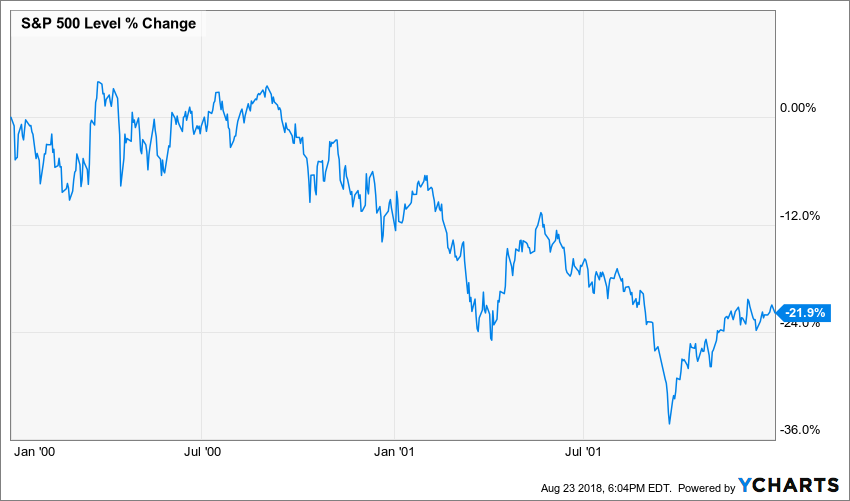
This week new unemployment claims continued to be quite low by historical standards but I doubt that the unemployment level will go much lower, sitting today at 3.9%, having dropped as low as 3.8% in May, the lowest level since 2000. This hyper-low level of unemployment has historically been a negative indicator for the stock market. The unemployment rate has been at or below 4% for an extended period of time just 3 times, going back to 1948. The first period was in the post-WWII explosive growth from 1948, off and on through much of the 1950s. Then again from 1966 to 1970 and then for 10 months in 2000. The first period, the post-WWII period saw incredible growth in the U.S. for a variety of reasons and stands as a truly exceptional period in the growth of the U.S. economy. During this time the unemployment rate meant something different than it does today because we saw the employment to population rate for women increasing substantially as the world recovered from the horrors of war and the U.S. economy benefited from the enormous rebuilding activities.
The next period of sub 4% unemployment saw the S&P 500 remain essentially flat and the dot-com bust was no friend to the S&P 500 either.
The Bottom Line for the Week
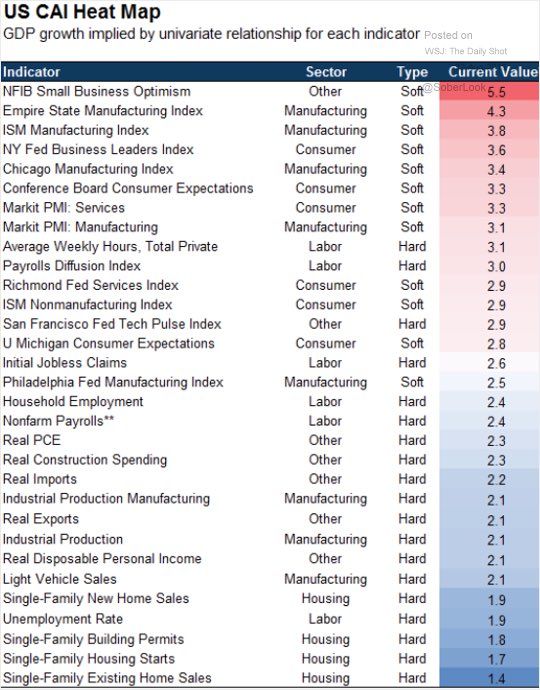
Thus far in August, around two-thirds of the economic data has come in below expectations yet the longer-term earnings growth outlook for the S&P 500 is at the highest levels seen since the later stages of the dot-com bubble. The soft (sentiment) data remains robust, but the hard (actual) data has been less rosy.
The earnings outlook is more in line with the soft data than the actual hard, which I suspect means downward revisions will be forthcoming. Hat tip to TopDownCharts.com for this chart:
As TopDown writes, “Back then it was all about ‘the new economy’ as dot-com companies were disrupting industries left, right and center and promising a tech revolution. Now it’s tax cut euphoria, and the hope of a shaking of the old ‘secular stagnation’ fear that took hold in 2015/16.”
The Week of August 27-31 2018
We are entering what is easily one of the slowest weeks of the year as folks enjoy the last lazy days of summer before school starts and work kicks off again with a vengeance. This month has seen the lowest trading volumes of the year, which is typical, so the jury is somewhat out on just how things will continue to pan out once everyone is back at their desks and the political heat from the upcoming mid-term elections intensifies.
The last week of August we’ll get two more July data reports that tend to be sleepers for most – the Advance International Trade in Goods and Advance Wholesale Inventories reports – but given their nature and what we learned from the August Flash reading they will bear going over. Midweek we get the second estimate of 2Q 2018 GDP, and the question will be whether it’s revised to something with a 3-handle or not? Rounding out the week will be the July Personal Income & Spending Report, which given the pace of monthly retail sales we will be scrutinizing the income side of the report to determine if the sharp pace of consumer spend can continue as we gear into the holiday shopping filled last four months of the year. The last day of the month brings us the Chicago PMI and University of Michigan Consumer Sentiment Index, and in both, we’ll be looking for hard and soft fallout from the current trade situation.


