Author Archives: Chris Versace, Chief Investment Officer

About Chris Versace, Chief Investment Officer

I'm the Chief Investment Officer of Tematica Research and editor of Tematica Investing newsletter. All of that capitalizes on my near 20 years in the investment industry, nearly all of it breaking down industries and recommending stocks. In that time, I've been ranked an All Star Analyst by Zacks Investment Research and my efforts in analyzing industries, companies and equities have been recognized by both Institutional Investor and Thomson Reuters’ StarMine Monitor. In my travels, I've covered cyclicals, tech and more, which gives me a different vantage point, one that uses not only an ecosystem or food chain perspective, but one that also examines demographics, economics, psychographics and more when formulating my investment views. The question I most often get is "Are you related to…."
WEEKLY ISSUE: Confirming Thematic Data Points Continue to Pour In

WEEKLY ISSUE: Confirming Thematic Data Points Continue to Pour In

Key points inside this issue:

  • Oh how the stock market has diverged over the last week
  • Ahead of Apple’s (AAPL) upcoming annual product refresh, we are boosting our price target to $225 from $210 for the shares.
  • Our price target on Amazon (AMZN) shares remains $2,250.00
  • Our price target on Costco Wholesale (COST) remains $230.00
  • Our price target on Nokia (NOK) shares remains $8.50
  • Our price target on AXT Inc. (AXTI) shares remains $11.50
  • Our price target on Dycom (DY) shares remains $125.00
  • Here come earnings from Habit Restaurant (HABT)


Oh how the stock market has diverged over the last week

Last week the divergence we saw in the major domestic stock market indices continued as both the Dow Jones Industrial Average and the S&P 500 powered higher while the Nasdaq Composite Index and the small-cap heavy Russell 2000 retreated. The technology-heavy Nasdaq moved lower following drops in Facebook (FB) and Twitter (TWTR) late last week, while the Russell’s move lower likely reflecting potential progress on trade following a positive meeting between the US and EU.

In recent weeks, we’ve shared our view that 2Q 2018 earnings season would likely lead to the resetting of earnings expectations, and it appears that is indeed happening. The stock market, however, didn’t expect that resetting to happen with Facebook, Twitter, Netflix (NFLX) and other high fliers. We also shared how that resetting could lead to some downward pressure in the overall market, so we’re not surprised by how it is digesting these realizations.

Also weighing on the market is the realization the 2Q 2018 GDP figure of 4.1%, which was propped up by government spending and some pull forward in demand ahead of tariff phase-ins, is not likely to repeat itself in the current quarter. As we noted above, there was some progress on trade between the US and EU last week — more of an agreement to work on an agreement — and there are still tariffs with Canada, Mexico, and China to face. And as much as we would like to see last week’s progress as hopeful, we’ve heard from a number of companies about how under the current environment higher input costs will weigh on margins and profits in the back half of the year. The response has companies boosting prices to pass along those increased costs, which could either sap demand or stoke inflation concerns.

We saw that rather clearly in the IHS Markit Flash US PMI for July last week. The headline flash PMI index clocked in at 55.9, a three-month low with the manufacturing component at a two month higher while services slipped month over month. One of the key takeaways was summed up by Chris Williamson, Chief Business Economist at IHS Markit who said, “…the July flash PMI is in line with the average for the second quarter and indicative of the economy growing at an annualized rate of approximately 3%.” The same flash report also showed a steep increase in prices with survey respondents citing the impact of tariffs, but also supply chain delays, which in our experience tends to be a harbinger of further price increases.

Because we’re still in the thick of earnings, we’ll continue to assess the situation as more company commentary becomes available and what it means for profits in the coming quarters. Odds are, however, the Fed, is seeing the above and will remain on a path to boost interest rates in the coming months. We’ll get more on that later today when the Fed exits its latest FOMC policy meeting. Barring a meaningful pick up in wage growth it could lead to more restrained consumer spending. We see that as positives for incremental consumer wallet share gains at Amazon (AMZN) and Costco Wholesale (COST) as we head into the seasonally strong shopping season.

  • Our price target on Amazon (AMZN) shares remains $2,250.00
  • Our price target on Costco Wholesale (COST) remains $230.00


Apple delivers and boosting our price target in response

We are boosting our price target on Apple (AAPL) shares to $225 from $210. This boost follows last night’s solid June quarter results and guidance, which topped expectations as investors and consumer prepare for the latest iteration of iPhone and other Apple products to hit shelves in the coming months. Here are some of the highlights from Apple’s June quarter:

  • Reported EPS of $2.34 vs. the consensus forecast of $2.18 on revenue of $53.265 billion vs. the expected $52.43 billion.
  • Year over year revenue grew 17% with led by double-digit increases at iPhone, Services and Other while Mac and iPad revenue declined vs. year-ago levels.

Moreover, the company forecasted September quarter revenue to grow double digits sequentially with prospects for an improving gross margin profile. That combination is leading Wall Street to take its EPS expectations higher, and I suspect we will see a number of price target increases this morning.

As exciting as this is — as well as proof positive the Apple model is not broken as some doomsayers would suggest — in several weeks Apple will take the wraps off its revitalized Fall 2018 new product lineup that is expected to have a number of new models across iPhones and iPads. Some products, like iPads, are expected to get new features such as FaceID, while the iPhone X lineup should expand to larger screen sizes as well as lower cost models utilizing an LCD screen instead of an organic light emitting diode (OLED) one. I see the Apple enthusiasm once again cresting higher as that date approaches.

Now let’s break down the quarter’s results:

iPhone revenue grew 20% year over year to $29.9 billion despite tepid smartphone industry dynamics. During the quarter Apple sold 41.3 million iPhones, which paired with the 19% year over year improvement in average selling price (ASP) to $724 vs. $606 in the year-ago quarter drove the revenue improvement. That surge in ASP reflects ongoing demand from the company’s premium iPhone products – iPhone X, iPhone 8 and iPhone 8+.

The Services business grew 30% year over year to $9.5 billion, roughly 18% of overall Apple revenue vs. 16% in the year-ago quarter. The total number of paid subscriptions rose 30 million sequentially to hit 300 million, up from 185 million exiting the June 2017 quarter. I see this as a positive given the subscription nature of iCloud, Apple Music, Apple Care, Texture and other offerings that drive not only cash flow but revenue predictability. During the earnings call, Apple tipped that it has over 50 million Apple Music listeners “when you add our paid subscribers and the folks in the trial…”

As the Services business continues to grow across the expanding Apple device install base, accounting for a greater portion of revenue and profits, odds are investors will begin to re-think how they value Apple shares, especially as the company’s dependence on iPhone sales is lessened at least somewhat. That will be especially true as Apple tips its original content plans, from both a programming perspective as well as pricing and subscription plan one.

Other products grew 37% vs. the year-ago quarter driven by wearables (Apple Watch, Air Pods, Beats) to account for 7% of overall revenue for the quarter.

For the September quarter, Apple guided revenue to $60-$62 billion with gross margin between 38.0-38.5% (vs. 38.3% in the June quarter). That double-digit sequential revenue improvement looks strong heading into the Fall unveiling of new devices, including multiple iPhone models, which as I mentioned earlier is expected to include a larger screen sized iPhone X model as well as a new iPhone X model and a lower priced one with an LCD screen. That implies a rebound in unit volume growth tied with favorable ASPs to drive iPhone revenue growth in the coming quarters. Of course, I continue to see the next major upgrade cycle tied to 5G, which increasingly looks to go live in North America during 2019 and outside the US thereafter.

Investor confidence in new products and Apple’s new product pipeline should be bolstered by the growth in R&D spending that has now outpaced revenue growth in 24 of the last 25 quarters. Historically speaking, when this has happened in the past, it was a forbearer of Apple unveiling a number of new products, including a new product category or two. While it would be easy to read into the possibilities of potential products as 5G goes mainstream, we’ll continue to focus on the near-term upgrades to be had in a few month’s time and what it means for Apple’s businesses.

Exiting the quarter, Apple’s balance sheet had a net cash position of $129 billion even after retiring some 112 million shares during the quarter. On a dollar basis that was $20.7 billion spent on share repurchases during the quarter, including the last part $10 billion of its prior authorization. That leaves roughly $90 billion under its current $100 billion authorization and we continue to see the company supporting the shares with that mechanism.

Finally, last night Apple’s board of directors has declared a cash dividend of $0.73 per share of the Company’s common stock. The dividend is payable on August 16, 2018, to shareholders of record as of the close of business on August 13, 2018.

In sum, it was a stronger than expected quarter that showed Apple’s various strategies bearing fruit with more to come as it updates existing products and introduces new ones as well as new services. If there was one disappointment in the earnings release and conference call it was the lack of discussion around 5G and original content efforts, but my thinking on that is good things come to those who wait.

  • Ahead of Apple’s (AAPL) upcoming annual product refresh, we are boosting our price target to $225 from $210 for the shares.


Nokia scores the biggest 5G contract win thus far

Earlier this week, T-Mobile (TMUS) named Nokia (NOK) as a supplier for $3.5 billion in 5G network gear, making this the largest 5G deal thus far. This is clear confirmation of the coming network upgrade cycle that bodes well for not only Nokia’s infrastructure business but will expand the addressable market for its licensing business as well.

Nokia’s deal with T-Mobile US is multi-year in nature, which means the $3.5 million will be spread out over eight-plus quarters. To put some perspective around the size of that one contract, over the last two quarters, Nokia’s infrastructure business has been averaging a little over $5 billion per quarter.  In our view, this speaks to the diverse nature of the customer base across not only the US but the EU, Africa, and Asia.

The thing is, 5G networks will be coming to each of those geographies over the coming years, and for those further out deployments, mobile carriers will be adding incremental 4G LTE capacity.  In other words, we are at the beginning of the 5G buildout, and it may seem like it has taken longer than expected to emerge, the data points from smartphone components to network builds suggest 2019 will be the beginning of a multiyear upcycle in mobile infrastructure demand.

And a quick reminder, we see the coming 5G buildout and the necessary smartphones and other devices driving demand for AXT Inc.’s (AXTI) compound semiconductor substrates. Those shares have been bouncing around like ping-pong balls of late, but we’ll continue to focus on the long-term drivers such as 5G and the eventual smartphone upgrade cycle.

And I would be remiss if I didn’t touch on Dycom Industries (DY) as well. To me, this T-Mobile US news says it is serious about building out its 5G network, and I strongly suspect both AT&T (T) as well as Verizon (VZ) will be sharing their own buildout plans in the coming days and weeks. These carriers are all about one-upping each other be it on data plan pricing or how good their networks are. As AT&T and Verizon fight back, it’s a solid reminder of the activity to be had for Dycom’s specialty contracting business.

  • Our price target on Nokia (NOK) shares remains $8.50
  • Our price target on AXT Inc. (AXTI) shares remains $11.50
  • Our price target on Dycom (DY) shares remains $125.00


Here come earnings from Habit

Quickly turning to Habit Restaurants (HABT), the company will report its quarterly earnings after today’s market close. Consensus expectations are looking for EPS of $0.03 on revenue of roughly $100 million for the June quarter. Ahead of that report, Wall Street is coming around to the Habit story. On Monday, investment firm Wedbush bumped up their price target to $15 from $12 and upped their rating to Outperform from Buy. Yes, I am wondering where they’ve been for the last 30% plus rally in HABT shares…

The gist of the upgrade reflects the positive impact to be had from recent price increases as well as premium pricing associated with delivery. Those are certainly positive drivers for revenue and margins, however, I continue to see the bigger thesis centering on the company’s geographic expansion. That expansion means more burgers and shakes being sold in more locations, drive-thru, and delivery. In other words, it’s the platform that allows for these other margin improving activities. This means I’ll be watching the company’s capital spending plans for the coming quarters.

As tends to be the case, I’ll be reassessing our $11.50 price target with tonight’s earnings report given the shares have sailed right through it over the last few days.

  • Heading into tonight’s earnings report, our price target on Habit Restaurant (HABT) shares remains $11.50.


What a difference between Facebook and Amazon June quarter results make

What a difference between Facebook and Amazon June quarter results make


Key points:

  • As we sail into the seasonally stronger second half of the year, I am boosting our price target on Amazon (AMZN) shares to $2,250 from $1,900, which keeps the shares on the Tematica Investing Select List.
  • After a disappointing outlook for the back half of 2018 due to slower revenue growth and mounting spending costs, we will remain on the sidelines with Facebook (FB) shares for now.


Over the last few days, we’ve had quarterly results from two companies that are riding tailwinds associated with our Digital Lifestyle investment theme – Facebook (FB) and Amazon (AMZN). The report from each company, however, and their reception from investors couldn’t have been more different.

Amazon’s earnings report reflected continuing strength as consumers across the globe embrace digital commerce and the company’s Amazon Prime service, while Amazon Web Services saw its business and profits surge as cloud adoption continues. Facebook on the other hand … is a very different story. A story that included rising costs and slowing revenue growth, which led the social media giant to not only miss revenue expectations but signal slower growth and earnings ahead.

No surprise then that Facebook shares were pummeled, while Amazon traded higher. Now let’s break both of those reports down, focusing on what matters with each.


Amazon – Operating Income Crushes Expectations

Last night, Amazon reported blowout June quarter earnings, which more than overshadowed a modest top-line miss as its operating income not only crushed expectations but shattered the company’s own guidance. On almost every front for each of its three business segments — North America, International and Amazon Web Services (AWS) — the company continued to make solid progress, delivering its third straight quarter with profits over $1 billion and continuing the string of a dozen profitable quarters. I doubt we’ll be hearing much from those “no profit at Amazon” naysayers anymore.

As I’ve said previously, one of the “secret weapons” that Amazon has under its hood is it’s the high margin and cash flow rich Amazon Web Services (AWS) division, and the June quarter clearly confirmed that. Revenue at AWS rose 49% year over year. That’s a figure that clearly shows Amazon is fending off the likes of Alphabet (GOOGL) and Microsoft in the cloud computing space. To me, the more important figure was the operating profit that AWS generated, $1.6 billion, which is up an impressive 80% year over year, and roughly 47% of the company’s overall operating profit. On the earnings call, management shared that machine learning, artificial intelligence and analytics have been key drivers of AWS’s revenue gains, which to me cements Amazon’s position in our Disruptive Innovators investing theme.

The balance of Amazon’s operating profit was generated by the company’s North American business as International continued to generate operating losses, albeit less than a year ago, as Amazon target future growth in those markets.

That profit generation and prospects for more led Wall Street to overlook the modest top-line miss for the quarter, but then again, it’s hard to complain at the 39% year over year revenue growth Amazon did deliver. Amazon also served up a September quarter revenue forecast in the range of $54-$57.5 billion, which was also below analysts’ consensus estimates. Here again, those same analysts will have to adjust their profit forecasts higher following AWS’s performance in the June quarter. My take is the combination of the recent Prime membership price increase ( a 20% increase to $119 per year) and Prime Day paired with what will likely be an aggressive attack on Back to School shopping could make for conservative 3Q 2018 revenue guidance.

One other potential upside driver for Amazon in the coming quarters is its digital-advertising business. In the segment breakdown, this is found in the often overlooked “Other” category, which generated $2.1 billion in revenue for the June quarter (wish I had an “other” revenue source like that!). While it accounted for less than 4% of overall quarterly revenue, these Other items grew nearly 130% year over year.  Amazon does not disclose Other’s profitability metrics, given that the digital advertising business is one of the larger ones in the category with billions in revenue and hundreds of thousands of customers, but odds are it has the potential to be wildly profitable if it isn’t already.

For those unfamiliar with Amazon’s digital advertising business, it is attracting spending that would have traditionally taken place in brick-and-mortar stores to ensure good “shelf placement” and other brand initiatives across Amazon.com. Small today, compared to advertising efforts at Google and Facebook, but Amazon is able to tell its advertising customers when a consumer actually bought a product, directly showing an ad’s effectiveness — something Google and Facebook can only accomplish through tracking cookies and other data mining techniques, which are not 100% accurate and are also coming under the scrutiny of privacy advocates more and more these days. Of course, all of this also allows Amazon to amass a sea of data that it can use to formulate its next move with its own private label products — forcing retailers into a dance with the devil of sorts.

If there was anything disappointing on Amazon’s earnings call it was the lack of comment on the company’s announced acquisition of online pharmacy PillPack. Not surprising given the company’s usual tight-lipped nature, but still disappointing.

  • As we sail into the seasonally stronger second half of the year, I am boosting our price target on Amazon (AMZN) shares to $2,250 from $1,900, which keeps the shares on the Tematica Investing Select List.


Facebook – the bloom is off the rose

Ouch! There is no other way to say it given the 19% drop in Facebook (FB) shares following what can only be described as unexpected results inside its June-quarter earnings report. While the market might have been caught flat-footed, it was the privacy and user data issues at Facebook that led us to remove the shares from the Tematica Select List back in March as we saw the risk-reward trade-off to be had as limited.

Despite those slipups, expectations have been running high for Facebook as advertisers look to reach increasingly connected consumers across Facebook, Instagram and the company’s other social media platforms. Indeed, those expectations and the potential impact to Facebook’s revenue and bottom line were what catapulted the stock from $160 in late April to Wednesday’s closing price of over $217.50. That’s a surge in excess of 35% in 14 weeks, compared to a 6.7% rise in the S&P 500 over the same time frame.

But that was before the June quarter earnings report and conference call…

While Facebook reported a bottom line beat and rising revenue per customer in the U.S. for the June quarter this week, the rest of the earnings press release and conference call took the bloom off the rose at the social media juggernaut. Revenue for the quarter missed expectations and management guided for declines in revenue growth in the back half of 2018 as spending on safety and content continue leading to a one-two punch to its operating margins. For those tracking monthly and daily active users, there was saw a sequential dip with the U.S. users flat but a 3 million drop in Europe due in part to General Data Protection Regulation (GDPR) that went into effect in late May.

You may recall that earlier this year management telegraphed a shift toward a focus on building community, which would likely hit revenue growth, but as management shared on the earnings call, it expects “revenue growth rates to decline by high-single-digit percentages from prior quarters sequentially in both Q3 and Q4.” Not exactly the vector or velocity that investors had been expecting at all.

Adding to the shock and awe of it all was the simple fact that this was the first time Facebook has missed expectations since the March 2015 quarter. However, continued investment and revenue pressure is expected to take its toll and we are seeing operating margin expectations reverse course — going to mid-30% vs. the mid-40% that was previously forecasted by Wall Street for 2018 and 2019.

The net result has Facebook shares crashing as analysts put pencil to paper to re-forecast top and bottom line expectations. While that happens, we’ve already seen several investment banks slash their price targets to the $180-$185 level and a number of them also cut their “Buy” ratings to “Hold.”

Of course, the main question is that since March we’ve been on the sidelines with Facebook shares as of late, we have to ask is now the time to jump in? The removal of Facebook from the Tematica Investing Select List stemmed from the potential fallout from Cambridge Analytica as well as implications from the phase in of GDPR. There was also the hefty amount of insider selling on behalf of CEO Mark Zuckerberg as well as COO Sheryl Sandberg. When management is selling that much stock that fast, it’s usually not a good sign. At a minimum, and no matter the actual reason for the sale, it raises a flag.

Getting back to the question raised, above, we believe it hinges on the value in the shares relative to revised EPS expectations and management gaining back some credibility.

Do I expect advertisers will continue to utilize all of Facebook’s platforms to reach consumers? Yes, but even Facebook has stated that corporate advertising using Instagram’s Stories is ramping slower than expected.

For me, Facebook shares will sit in “stocks to keep tabs on” group until we see user engagement metrics rebound and the share price reflects not only revised growth prospects but a favorable value to be had. I don’t expect that to happen in just a few days. That said, I’ll be watching how those revised EPS and revenue expectations shake out. Thus far, 2018 EPS expectations have dropped to $7.31 from $7.74, while those for 2019 have fallen to the $8.50 level from nearly $9.30. Hefty cuts, but odds are we won’t see the full impact on consensus revisions for at least a few more days.


Disruptive Innovators are more than just technology stocks

Disruptive Innovators are more than just technology stocks


KEY POINTS FROM THIS POST

  • As we continue to recast our investment themes here at Tematica, this week we launch a new theme  — Disruptive Innovators.
  • We are adding Universal Display (OLED) shares back to the Tematica Investing Select List as part of our Disruptive Innovators investing theme with a $150 price target.


Over the last few weeks, we’ve been reconstituting our collection of investment themes. Following the recent unveiling of our Digital Lifestyle theme, today we are recasting a theme we call Disruptive Innovators. If you thought disruption was only to be had from technology evolution, you’ll want to pay attention.

Every so often a new technology, business practice or other development comes along that upends the status quo: the personal computer; the internet; high speed networks; Google; Uber; the App store; Streaming; Cloud computing; Amazon Prime; mobile advertising, ordering and payments; Light Emitting Diodes (LEDs).

These are just some of the many disruptions that have changed how we think, interact, behave, conduct business, learn, shop and go about our day-to-day lives.

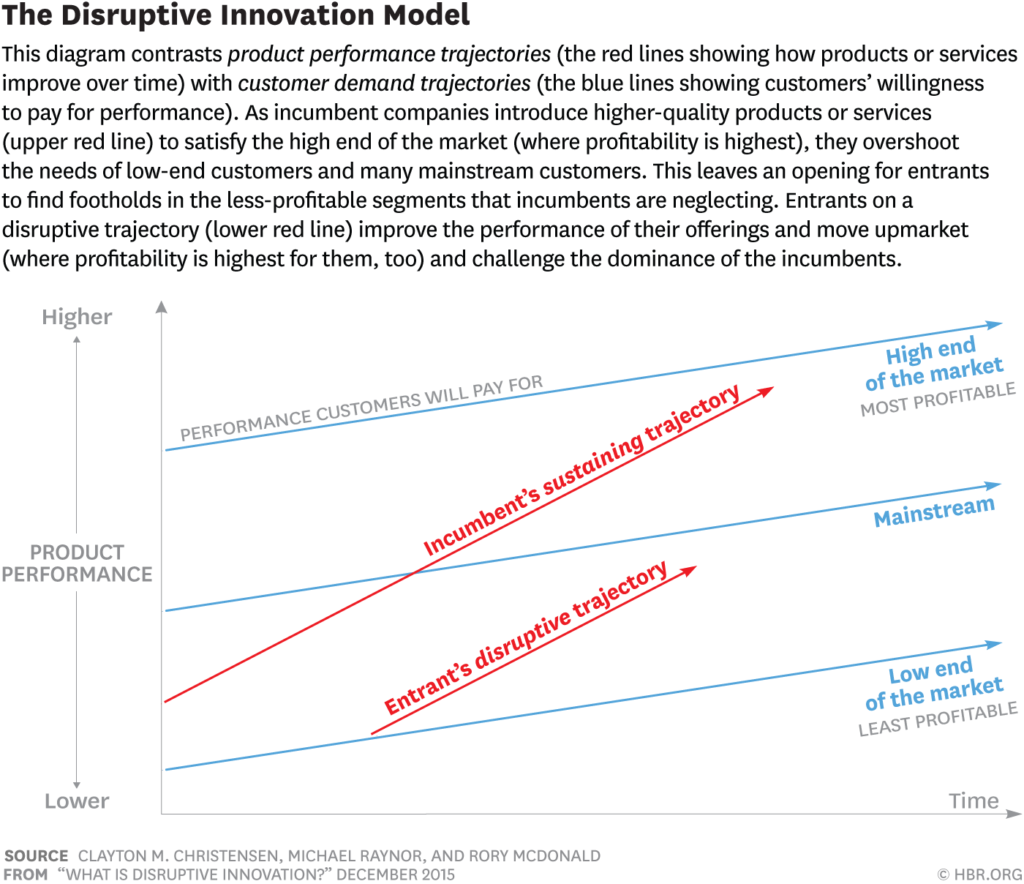
Harvard Business School professor and disruption guru Clayton Christensen says that a disruption displaces an existing market, industry, or technology and produces something new and more efficient and worthwhile. It is at once destructive and creative.


Established businesses tend to focus on improvements to their existing products and services, usually for their most demanding and most profitable customers. Their focus is on making iterative changes and adjustments along the way, which allows them to maintain their pole position in their particular category, without rocking the boat too much, safe and steady.

Disruptive solutions on the other hand not only look to rock the boat but often tip it over and completely change the lake.

Disruptors often begin by successfully targeting those overlooked customer segments — typically ones that complain about the complexity and cost of existing products and services. The goal of a disruptor is to gain a toehold in a category by removing friction. Oftentimes this could be a technological advance that makes the customer experience much better, which was the case with the introduction of the iPod into the MP3 player market. But disruption can also come in the form of removing friction from the actual process of purchasing a product or service or simply improving the customer experience.

As slow-moving incumbents focus on harvesting profits from mainstream products, disruptive entrants expand their reach and begin to move upmarket, delivering the performance that incumbents’ mainstream customers require, while preserving the advantages that drove their early success. When mainstream customers start adopting the entrants’ offerings in volume, disruption has occurred.

There are numerous examples of this disruptive process to be had, but none greater than mobile phone giant Nokia (NOK). Back in 2007, Nokia sat atop the market with its 41% global market share of the mobile phone category. The cellphone giant, however, completely misread the prospects for the smartphone, a device that reshaped not only a number of industries but one could easily argue it’s the single device that has reshaped all of our lives and is in the process of transforming frontier and emerging economies. At first, it was Blackberry and Palm that gained market share, but when Apple introduced the first iPhone — a device that featured a disruptive capacitive touchscreen and full internet browsing — the writing was on the wall for Nokia’s handset business.

Another example of the creative destruction that disruptors cause came in our media consumption habits. It really wasn’t too long ago that music, TV shows, movies, books, software and games were once sold only in physical formats. Today, in large part due to devices like the iPhone, iPad and Kindle, much of the media we engage with on a daily basis is downloaded or streamed through the internet directly to the device of choice. That change, destroyed established players such as Blockbuster Video, Borders Books and Tower Records, to name a few, and completely changed the product offering in stores like Best Buy, Target and Wal-Mart.

According to the Recording Industry Association of America, within the $8.72 billion spent in 2017 by U.S. consumers on music, streaming was the dominant growth vehicle, accounting for $5.66 billion in revenue (65%), up from 2016’s $3.96 billion. While digital downloads were hardest hit, falling 22% by volume year over year, physical album sales continued to fall vs. 2016. Underneath that disruptive shift, we find robust 4G LTE mobile networks and highspeed fiber networks as well as storage and increasing processing power.

Interface technologies have morphed from keyboard-mouse to touchpad and with the launch of Apple’s first iPhone 10-years ago capacitive touch. In 2011, Apple launched its digital voice assistant Siri that paved the way for Amazon’s Alexa and Google Home as well as a number of other virtual assistant offerings. While those digital assistants are racking up design wins in consumer appliances and cars, voice interface technology has expanded into other markets including financial services with Bank of America’s Erica, which has more than 1 million users.

At a consumer level, Amazon Prime’s two-day shipping has disrupted how the entire retail industry serves its customers. Online retailers, including Amazon, initially gained a foothold in the retail category because of their competitive advantage in two critical areas — choice and pricing. Amazon’s Prime service, however, removed the two remaining points of friction that came with online shopping — the time and cost of shipping your purchases to your doorstep and the hassle of returning items. Amazon Prime, and other online retailers that have followed Amazon’s lead, have completely removed the need to “just run to the mall” and we are now experiencing a “retailmageddon” that is disrupting the bricks and mortar landscape and transforming what a physical retailer looks like in the United States. Amazon is now looking to do the same with grocery and pharmacy given its acquisitions of Whole Foods and more recently PillPack.


Disruption Is More Than Just Technology

We now live in a time where technological disruptions are almost expected — one of the main criticisms of the latest round of iPhone’s was their lack of disruptors. But disruptions can come in all aspects of our lives.

Passersby used to hail a taxi, but now using an app they can do the same via their smartphone. Uber has transformed the task of summoning a ride into an easy, affordable proposition. Through its mobile app, users can request a ride and choose a vehicle based on luxury level and fare for their destination, a vast improvement on the old taxi model. As riders shifted from taxis to these on-demand ride services, the shares of Medallion Financial (MFIN), a finance company that focused on taxi medallion lending, saw its shares fall below $5.50 from a peak near $18 in November 2013.

Anyone who has booked a hotel knows it isn’t always an intuitive, cost-effective or pleasant experience. AirBnB has completely disrupted the industry by offering a completely different experience when visiting a new city or destination. Thanks to the company’s disruptive business model, travelers can now look beyond the hotel chains, inns or B&B’s, and rent local rooms in homes or apartments, often at a significant discount to traditional alternatives. AirBnb’s disruptive business model, of course, has the dual benefit of allowing anyone with an extra room, empty apartment, or house to earn a profit from their unused asset.

While those are more recent examples, there are numerous others to be had over the past decades and in each case, a new technology, service or capability has altered the competitive landscape.


The Disruptors Don’t Always Emerge as the Winner

Of course, not every would-be disruptor gains sufficient footing that its business model or technology becomes sustainable. For example, any number of internet-based retailers pursued disruptive paths in the late 1990s, but only a small number prospered. Pets.com, Webvan, eToys, Drkoop.com, and GeoCities are just a few examples of those that failed.

More recent examples of questionable disruptors include subscription-based movie ticketing service MoviePass and ingredient and recipe meal kit service Blue Apron (APRN). While both are attempting to alter their respective landscapes, MoviePass is contending with the accelerating adoption of streaming video services and fresh proprietary content as well as Hollywood studios continuing to push to offer movies in the home mere weeks after their theatrical review. With Blue Apron, numerous meal kitting companies have popped up as have similar services from the likes of Kroger (KR) and other grocery giants that have removed its early foothold.

Some technologies like 5G and organic light emitting diodes have a long runway in front of them, which necessitates tracking competitive developments and other signposts to determine when they will disrupt past disruptors 4G LTE, liquid crystal displays and LEDs. Other developments, such as augmented and virtual reality as well as drones are waiting for the spark that will stir widespread adoption across businesses and consumers alike.


Investing In Disruption

Today there are many disruptors spanning information technologies, biological sciences, material science, healthcare, energy, consumer and business services and other fields and are the basis for our Disruptive Innovators investment theme. Some of the technologies and business models we are tracking as part of this investment theme include but are not limited to:

  • 5G
  • Artificial intelligence
  • Autonomous vehicles
  • Blockchain
  • Business services
  • Cloud
  • Display technologies
  • Drones and unmanned vehicles
  • Internet of Things (IoT)
  • Organic light emitting diodes
  • Renewables and clean energy
  • Smart manufacturing (3-D printing)
  • Spatial Computing (augmented/virtual reality)
  • Voice control and digital/virtual assistants

As we examine these and other disruptors, we look for the key enablers of the disruption. In some cases, this could be the service providers themselves, device/technology companies, key component vendors or in some cases intellectual property holders. Using 5G as an example, the array of contenders would include:

  • AT&T (T) and Verizon Communications (VZ) as service providers;
  • Ericsson (ERIC) and Nokia (NOK) as 5G infrastructure players;
  • Chipset companies Qualcomm (QCOM) and Skyworks Solutions (SWKS);
  • And Qualcomm again as well as InterDigital (IDCC) given their respective 5G patent portfolios.

That food chain or ecosystem view enables us to identify key customer-supplier relationships that capture the companies with the widest reach, which tends to reduce customer specific risks. As an example, because Qualcomm and Skyworks sell their chips to the who’s who in smartphones, smartphone market share shifts have a modest impact on their revenue streams.

Could we go deeper into the food chain? We could, but the further down we go, the further removed we could be from the source of disruption. Putting it all together, this investment theme focuses the major disruptive evolutions and then identifies those companies whose bottom lines are best positioned to benefit.


Our Disruptive Innovator Leader

One of the companies that match the criteria of a Disruptive Innovator and also holds prime food chain position in its category is organic light emitting diode company Universal Display (OLED). We’ve danced with this company and its shares over the last two years, riding it to heights as Apple (AAPL) prepared to launch the iPhone X that featured an OLED display supplied by Samsung, only to exit the shares as forecasts for that smartphone’s shipments were dialed back. At the time we noted that we still liked Universal’s two-pronged business model comprised of key chemical sales as well as high margin IP licensing.

The good news is that business model remains intact at Universal Display, and we are seeing rising industry capacity for its OLED screens come on line in the marketplace. That was one of the issues that plagued Apple (AAPL) — tight capacity levels that made the OLED display one of, if not the, most expensive components of the iPhone X. With Apple slated to introduce two new OLED smartphone models in a few months, odds are it has tackled those supply issues. Commentary from display equipment maker Applied Materials (AMAT) suggests that to be the case. The notion that Apple isn’t the only driver of OLED demand also remains true given other smartphone manufacturers, including Samsung, Huawei, and Xiaomi, are introducing new models that feature OLED displays, while new TV models incorporating the technology are also hitting shelves later this year. Longer-term, I continue to see OLED technology following the roadmap laid our by light emitting diodes (LEDs) into automotive, specialty lighting and ultimately general illumination replacing traditional lighting and LEDs along the way.

What this means is an expanding array of applications that will grow Universal’s addressable market for the IP business while increasing demand for its chemical business. A very nice push-pull that drives revenue and profit growth over the coming 12-24 months.  As with any company, there are associated risks, and one of them for Universal Display is the risk of slower than expected adoption of OLED technology – we saw that unfold over the last nine months. Another risk is that this disruptive technology itself gets disrupted, which means keeping tabs on new display technology developments.

As we add OLED shares back to the Tematica Investing Select List, we are instilling a $150 price target. That target is based on EPS growth to $3.83 in 2019, up from $1.83 this year and $0.94 in 2015 equates to a compound annual growth rate of 37% over the 2015-2019E time frame. On a price to earnings growth basis, our $150 target equates to a multiple of 1.2x — hardly rich, but in my view one that reflects the protracted demand ramp we encountered during the first half of 2018.

That assessment doesn’t factor in the more than $9.50 per share in net cash on Universal’s balance sheet, which should grow in the coming quarters due to a combination of cash flow and licensing payments. I’d be remiss if I didn’t mention the company’s dividend, but with it clocking in around $0.06 per share per quarter, it’s not going to be a major factor in assessing the share price or for lining shareholder pockets.

  • We are adding Universal Display (OLED) shares back to the Tematica Investing Select List as part of our Disruptive Innovators investing theme with a $150 price target.


Examples of companies riding the Disruptive Innovators investment theme tailwinds include:

  • Amazon (AMZN)
  • Applied Materials (AMAT)
  • Cree (CREE)
  • Dropbox (DBX)
  • Grub Hub
  • Interdigital (IDCC)
  • Lyft
  • Nokia (NOK)
  • Nuance Communications (NUAN)
  • Qualcomm (QCOM)
  • Skyworks Solutions (SWKS)
  • Spotify (SPOT)
  • Stamps.com (STMP)
  • Synaptics (SYNA)
  • Uber
  • Universal Display (OLED)


Weekly Issue: Trade Meetings and Earnings Reshape Market Outlook

Weekly Issue: Trade Meetings and Earnings Reshape Market Outlook

Key points from this issue:

  • Earnings from Boeing (BA) and General Motors (GM) signal markets will trade day-to-day as trade meetings and earnings season heat up.
  • Our price target on Dycom Industries (DY) shares remains $125
  • Our AXTI price target remains $11.
  • Our price target on Nokia (NOK) shares remains $8.50
  • Our long-term price target for Farmland Partners (FPI) shares remains $12.
  • As we head into the seasonally strong second half of the year for United Parcel Service (UPS), our price target on the shares remains $130.


This week we’ve moved into the meaty part of 2Q 2018 earnings season, and so far, we’ve seen a number of companies beat top and bottom line expectations. Some market observers will point out that some 20%-25% of the S&P 500 group of companies are in that boat, and are declaring “victory” for the market. With today’s earnings from Boeing (BA) that and General Motors (GM), the market is trending lower as Boeing’s outlook falls short of Wall Street expectations while GM cut its outlook due to higher commodity prices. As you probably guessed, one of the culprits for GM is higher aluminum and steel prices.

My take on that is with 75%-80% of the S&P 500 yet to report, that claim while it could prove to right, it also could be a bit premature. As I shared with Oliver Renick, host at the TD Ameritrade Network a few days ago, we’ve only started to see the impact of initial trade tariffs and if the international dance continues we could see far more tariff jawboning put into action.

Consider a tweet from President Trump this morning that suggests a tariff follow through is possible.


But last night Trump tweeted a path forward to eliminating tariffs and other trade barriers between the Eurozone and the US ahead of his meeting today with the European Commission President Jean-Claude Juncker today to discuss trade, including tariffs on autos.

It would appear Trump is attempting to keep his negotiating opponents off balance in the hopes of improving trade relations from a US perspective. But it also seems that others have read Trump’s Art of the Deal by now as according to EU trade commissioner Cecilia Malmstrom, the Commission is also preparing to introduce tariffs on $20 billion of U.S. goods if Washington imposes trade levies on imported cars.

While I would love to see some forward progress coming out of these talks, but just like with China the probability is rather low in my opinion. Much like with the China trade talks, things have escalated so that both sides will be looking to claim some victory to report back to their countrymen and women.  This likely means that as we migrate over the next few weeks of earnings, we will have to continue to watch trade developments, especially if more recent and wider spread tariffs wind up being enacted.

With more on the earnings and trade to be had in the coming days, we should be ready for day-to-day moves in the market, which will make it challenging for traders and options players. As they struggle, we’ll continue to take a longer-term focus, heeding the signals to be had with our thematic investing lens. Now, let’s get to some updates and other items…


Checking in on 5G spending from Verizon and AT&T

With both Verizon Communications (VZ) and AT&T (T) reporting June quarter results yesterday, I sifted through their comments on several fronts but especially on 5G given our positions in mobile infrastructure and licensing company Nokia (NOK), specialty contractor Dycom (DY) as well as compound semiconductor company AXT Inc. (AXTI). The nutshell take is things remain on track as both carriers look to launch commercial 5G networks in the coming quarters.

Verizon delivered solid quarterly results, buoyed by its core wireless business that added 531,000 net retail postpaid subscribers, which included 398,000 postpaid smartphone net adds. We’ve talked about how sticky mobile service is with consumers as smartphones are increasingly a life link for their connected lives so it comes as little surprise that Verizon’s customer loyalty remains strong with the quarter marking the fifth consecutive period of retail postpaid phone churn at 0.80 percent or better.

In terms of capital spending, a figure we want to watch as Verizon gets ready to launch its commercial 5G network, the company shared its 2018 spend will be at the lower end of its previously guided range of $17.0-$17.8 billion. Now here’s the thing, the mix of spending will favor 5G, which confirms the bullish comment and tone we shared last week from Ericsson (ERIC) on the North American 5G market.

With AT&T, its net capital spending in the June quarter slipped to $5.1 million, down from roughly $6 million in the March quarter but the company shared it will spend roughly $25 billion in all of 2018. Doing some quick math, we find this spending is weighted to the back half of 2018, which likely reflects investments in its 5G network as well as the new first responder network, FirstNet, it is building. During the earnings call, management shared the company now has 5G Evolution in more than 140 markets, covering nearly 100 million people with a theoretical peak speed of at least 400 megabits per second with plans to cover 400 plus markets by the end of this year. In terms of true 5G, trials are progressing and AT&T is tracking to launch service in parts of 12 markets by the end of this year.

That network spend and 5G buildout bodes well for both our Dycom shares.

  • Our price target on Dycom Industries (DY) shares remains $125


In addition, a few days ago mobile chip company Qualcomm (QCOM) shared that its 5G antennas are ready from prime time. More specifically, Qualcomm is shipping 5G antennas to its device partners that include Samsung, LG, Sony (SNE), HTC and Xiaomi among others for testing. Moreover, Qualcomm said it stands ready for “large-scale commercialization” which likely means 5G devices are just quarters away instead of years away.

We’d note those device partners of Qualcomm’s mentioned above have all announced plans to bring initial 5G powered phones to market during the first half of 2019. That means the supply chain will be readying power amplifiers and switches that will enable these devices to communicate with the 5G networks, which bodes well for incremental compound semiconductor substrate demand at AXT. Because 5G is being viewed as an “access technology” that will move mobile broadband past smartphones and similar devices, I continue to see this as a positive for the higher margin licensing business at Nokia as well.

As a reminder, AXT will report its quarterly results after tonight’s market close, and expectations for its June quarter are clocking in at $0.08 per in earnings on $26.1 million in revenue, up 60% and roughly 11% year over year.

  • Our AXTI price target remains $11.
  • Our price target on Nokia (NOK) shares remains $8.50


Farmland Partners fights back

A few weeks ago, we shared not only our long-term conviction for Farmland Partners (FPI) shares but also prospects for continued drama in the coming months. Well, let’s say we’re not disappointed as this morning the company filed a lawsuit in District Court, Denver County, Colorado against “Rota Fortunae” (a pseudonym) and other entities who worked with or for Rota Fortunae in conducting a “short and distort” scheme to profit from the sharp decline in Farmland’s stock price resulting from false and misleading posting on Seeking Alpha. Farmland is seeking damages and injunctive relief for defamation, defamation by libel per se, disparagement, intentional interference with prospective business relations, unjust enrichment, deceptive trade practices, and civil conspiracy.

Are we surprised? No, especially since the Farmland management team signaled it would be moving down this path. While this will likely result in some incremental noise, we’ll continue to focus on the business and the long-term drivers of the agricultural commodities that drive it.

  • Our long-term price target for Farmland Partners (FPI) shares remains $12.


Paccar delivers on the earnings front, boosts its dividend

Tuesday morning, heavy and medium duty truck company Paccar (PCAR) delivered strong June quarter results, beating on both the top and bottom line. For the quarter, Paccar reported earnings of $1.59 per share, $0.16 better than the $1.43 consensus on revenues that rose more than 24% year over to year to $5.47 billion, edging out the $5.39 billion that was expected. The strength in the quarter reflects not only rising production and delivery levels that reflect the pick up in truck orders over the last 6-9 months, but also the ripple effect had on the company’s high margin financing business. Also too, as truck up time increases as does the number of Paccar trucks in service, we’ve seen a nice pick up in the company’s Parts business that carries premium margins relative to the new truck one.

During the quarter, Paccar repurchased 1.21 million of its common shares for $77.2 million, completing its previously authorized $300 million share repurchase program. The Board of Directors approved an additional $300 million repurchase of outstanding common stock earlier this month and given the current share price that is below that average repurchase price we suspect this new program will be put to use quickly. Also during the quarter, Paccar boosted its quarterly dividend to $0.28 per share from $0.25, and management reminded investors of the company’s track record of delivering quarterly and special dividends in the range of 45-55% of net income.

Given 111% year over year growth in the new heavy truck orders throughout the U.S. and Canada during the first half of 2018, we continue to be bullish on PCAR shares as we head into the second half of 2018. Even so, we’ll continue to analyze the monthly truck order data as well as freight indicators and other barometers of domestic economic activity to assess the continued strength in new truck demand. In the coming months, we expect long-time followers of Paccar will begin to focus on the potential year-end special dividend the company has issued more often than not.

  • Our price target on Paccar (PCAR) shares remains $80.


A quick note on United Parcel Service earnings

Early this morning, United Parcel Service (UPS) beat estimates by a penny a share, with an adjusted quarterly profit of $1.94 per share. Revenue beat forecasts, as well, boosted by strong growth in online shopping – no surprise to us given our Digital Lifestyle investing theme. UPS will host a conference call this morning during which it will update its outlook for the back half of the year, and that should help quantify the year over year growth in Amazon’s (AMZN) Prime Day 2018 ahead of its earnings report later this week.

  • As we head into the seasonally strong second half of the year for United Parcel Service (UPS), our price target on the shares remains $130.


Amazon shares some Prime Day results, Bullish 5G comments from Ericsson

Amazon shares some Prime Day results, Bullish 5G comments from Ericsson

Key points in this issue:

  • Our $1,900 price target for Amazon (AMZN) shares is under review with an upward bias.
  • Our price target on United Parcel Service (UPS) remains $130.
  • Our price target on Dycom (DY) shares remains $125.
  • Our price target on AXT Inc. (AXTI) shares is $11.
  • Our price target on Nokia (NOK) shares is $8.50.


Follow up on Prime Day 2018

As the dust settles on Amazon’s (AMZN) 2018 Prime Day, the company shared that not only did Prime members purchase more than 100 million products during the 36-hour event, but that it was also the “biggest in history.” While details were limited, this commentary like means the 2018 event handily eclipsed last year’s. Adding credence to that was the noted addition of Prime Day in Australia, Singapore, the Netherlands, and Luxembourg, which brought the total event country count to 17. It was also reported that Prime Day Sales on Amazon’s third-party marketplace were up some 90% during the first 12 hours of Prime Day this year.

All very positive, but still no clarity on the overall magnitude of the event relative to forecasts calling for it to deliver $3.4-3.6 billion in revenue. There was also no mention about the number of new Prime members that joined the Amazon flock, but historically Prime Day has led to a smattering of conversions and with it occurring in 17 countries this year, including four new ones, odds are Amazon continued to draw in new Prime users.

As we mentioned yesterday, our $1,900 price target for Amazon shares is under review with an upward bias. In looking at Prime Day from a food chain or ecosystem perspective, we see it benefitting the package volume for Tematica Investing Select List resident United Parcel Service (UPS). I’ll be looking for confirming data in comments from United Parcel Service when it reports its 2Q 2018 quarterly results on July 25 as well as any insight it offers on Back to School shopping and the soon to be upon us year-end holiday shopping season. Let’s also keep in mind that UPS will share those comments one day before Amazon reports its quarterly results on July 26.

  • Our $1,900 price target for Amazon (AMZN) shares is under review with an upward bias.
  • Our price target on United Parcel Service (UPS) remains $130.


Ericson’s 5G comments are positive for Dycom, AXT and Nokia shares

Also yesterday, leading mobile infrastructure company Ericsson (ERIC) reported its 2Q 2018 results, and while we are not involved in the shares, its comments on the 5G market bode very well for our the shares of specialty contractor Dycom Industries (DY) and compound substrate company AXT Inc. (AXTI) as well as mobile infrastructure and wireless technology licensing company Nokia (NOK).

More specifically, Ericsson called out that its sales in North America for the quarter increased year over year due to “5G readiness” investments across all of its major customers. This confirms the commentary of the last few weeks as AT&T (T) and Verizon (VZ) – both of which are core Dycom customers – move toward commercial 5G deployments in the coming quarters.

We’ve also heard similar comments from T-Mobile USA (TMUS) as well. But let’s remember that 5G is not a US-only mobile technology, and we are seeing similar signs of readiness and adoption for its deployment in other countries. For example, the top three mobile operators in South Korea are working to launch the technology in March 2019. Mobile operators in Spain are bidding on 5G spectrum, France has established a roadmap for its 5G efforts and recently the first end to end 5G call was made in Australia.

While the US will likely be the first market to commercially deploy 5G service, it won’t be the only one. This means similar to what we have seen with past mobile technology deployments such as 3G and 4G LTE, this global rollout will span several years. While Ericsson’s North American comments bode well for our DY shares, these other confirmation points keep us bullish on our shares of AXT and NOK as well.

  • Our price target on Dycom (DY) shares remains $125.
  • Our price target on AXT Inc. (AXTI) shares is $11.
  • Our price target on Nokia (NOK) shares is $8.50.


Weekly Issue: Amazon Prime Day, Netflix Earnings, Controversy at Farmland Partners and June Retail Sales

Weekly Issue: Amazon Prime Day, Netflix Earnings, Controversy at Farmland Partners and June Retail Sales

Key points from this week’s issue:

  • Amazon (AMZN): What to watch as Amazon Prime Day 2018 comes and goes; Following the strong run in Amazon (AMZN) shares over the last several weeks, our $1,900 price target is under review.
  • Habit Restaurants (HABT): Our price target on Habit shares remains $11.50
  • Costco (COST): We are once again boosting our price target on Costco Wholesale (COST) shares to $230 from $220.
  • Netflix (NFLX): Despite 2Q 2018 earnings results, I continue to see Netflix shares rising further in the coming quarters as investors become increasingly comfortable with the company’s ability to deliver compelling content that will attract net new users, driving cash flow and bottom line profits. Our NFLX price target remains $525.
  • Farmland Partners (FPI): While credibility questions will keep Farmland in the penalty box in the short term, we continue to favor the longer-term business fundamentals. Our price target on FPI shares remains $12.


Catching up with the stock market

Last week we saw a change in the domestic stock market. After being led by the technology-heavy Nasdaq Composite Index and the small-cap-laden Russell 2000 during much of 2Q 2018, last week we saw the Dow Jones Industrial Average take the pole position, handily beating the other three major market indices. As all investors know, individual stocks, as well as the overall market, fluctuate week to week, but with just over two weeks under our belt in the current quarter, all four major market indices have moved higher, shrugging off trade concerns at least for now.

Of course, those mini market rallies occurred in the calm period before the 2Q 2018 earnings storm, which kicks off in earnest tomorrow when more than 84 companies will issue their report card for the quarter. Last week’s initial earnings reports for 2Q 2018 were positive for the market as was the latest Small Business Optimism Index reported by the NFIB. Despite those positive NFIB findings, which marked the sixth highest reading in the survey’s 45-year history, business owners continue to have challenges finding qualified workers. The challenge to fill open positions is not only a headwind for growth, but also increases the prospects for wage inflation.

For context, that NFIB survey reading matched the record high set in November 2000, which helps explain the survey’s findings for more companies planning to increase compensation. That adds to the findings from the June PPI report that showed headline inflation rising to 3.4% year over year and the 2.9% year-over-year increase in the June CPI report, all of which gives the Fed ample room to continue increasing interest rates in the coming months. Granted, a portion of that inflation is due to the impact of higher oil prices, but also higher metal and other commodity costs in anticipation of tariffs being installed are contributing. Again, these data points give the Fed the cover fire it will need when it comes to raising interest rates, which at the margin means borrowing costs will inch their way higher. Here’s the thing — all of that data reflects the time-period before the tariffs.

The focus over the next few weeks will be on corporate earnings, particularly how they stack up against expectations calling for more than 20% year-over-year EPS growth for the S&P 500 companies in the back half of 2018. So far, in aggregate, the reports we’ve received give little reason to worry, but to be fair we’ve only had a few dozen in recent weeks, with several hundred to be had. But… ah you knew there was a but coming… with companies like truck freight company JB Hunt blowing the doors off expectations but keeping its full-year 2018 guidance intact… a flag is raised. Another flag raised in the earnings results thus far was the consecutive slowdown in loan growth seen at JPMorgan Chase (JPM), Citigroup (C), PNC (PMC) and Wells Fargo (WFC), which came down to 2.1% year-over-year on an aggregate basis from 3% in the March quarter.

If earnings expectations come up short, we will likely see the market trade-off. How much depends on the discrepancy between reality and projections. Also, keep in mind, the current market multiple is ahead of the market’s historical average, and a resetting of EPS expectations could trigger something similar in the market multiple. What this means is at least as we go through the next few weeks there is a greater risk to be had in the market. As we move into the back half of the September quarter, if Trump can show some progress on the trade front we could have a market rally toward the end of the year. Needless to say, I’ll continue to keep one eye on all of this while the other ferrets out signals for our thematic investing lens.


It’s that Prime Day time of year

As I write this, we have passed the 24-hour mark in what is one of if not the largest self-created holidays. Better known as Amazon (AMZN) Prime Day, this made-up holiday strategically falls during one of the seasonally slowest times of the year for retailers. For those uninitiated with the day, or those who have not seen the litany of websites touting the evolving number of deals and retail steals being served up by Amazon throughout the day, Prime Day is roughly a day and a half push by Amazon to goose it sales by serving up compelling offerings and enticing non-Prime members to become ones. To put some context around it, Coresight Research forecasts Prime Day 2018 will generate $3.4 billion in sales in 36 hours — roughly 6% of the $58.06 billion Amazon is expected to report in revenue for the entire September quarter.

What separates this year’s Prime Day from prior ones isn’t the prospect for record-breaking sales, but rather the increased arsenal of private label products had by Amazon. Over the last few quarters, Amazon has expanded its reach into private label apparel and athletic wear as well as others like shoes and jewelry. All told, Amazon now sells more than 70 of its own brands, which it can price aggressively on Prime Day helping it win incremental consumer wallet share. Prime Day is also a deal bonanza for Amazon’s own line of electronic devices, ranging from FireTV products to Kindle e-readers and Echo powered digital assistants. The thing with each of those devices is they help remove friction to other Amazon products, such as its streaming TV and music services, Audible and of course its digital book service.

Unlike last year, this year’s Prime Day started off with a hitch in that soon after it began shoppers were met with the company’s standard error page because it was overwhelmed with deal seekers. Not a bad problem and certainly a great marketing story, but it raises the question as to whether Amazon will hit that $3.4 billion figure.

To me, the allure of Prime Day is the inherent stickiness it brings to Amazon as the best deals are offered only to Prime members, which historically has made converts of the previously unsubscribed. Those new additions pay their annual fee and that drives cash flow during a seasonally slow time of year for the company, while also expanding the base of users as we head into the year-end holiday shopping season before too long. Very smart, Amazon. But then again, I have long said Amazon is a company that knows how to reduce if not remove transaction friction. Two-day free Prime delivery, Amazon Alexa and Echo devices, Kindle digital downloads, and Amazon Pay are just some of the examples to be had.

Thus far in 2018, Amazon shares are up more than 58%, making them one of the best performers on the Tematica Investing Select List – hardly surprising given the number of thematic tailwinds pushing on its businesses. Even before we got to Prime Day, we’ve seen Amazon expanding its reach on a geographic and product basis, winning new business for its Amazon Web Services unit along the way. More recently, Amazon is angling to disrupt the pharmacy business with its acquisition of online pharmacy PillPack, a move that has already taken a bite out of CVS Health (CVS) and Walgreen Boots Alliance (WAB) shares. Odds are there will be more to come from Amazon on the healthcare front, and it has the potential to add to its business in a meaningful way as it once again looks to reduce transaction friction.So, what am I looking for from Amazon coming out of Prime Day 2018? Aside from maybe a few of mine own purchases, like a new Echo Spot for my desk, on the company data front, I am going to be looking for the reported number of new Prime subscribers Amazon adds to the fold. Sticking with that, I’m even more interested in the number of non-US Prime subscribers it adds, given the efforts by Amazon of late to bring 2-day Prime delivery to parts of Europe. As we here in the US have learned, once you have Prime, there is no going back.

  • Following the strong run in Amazon (AMZN) shares over the last several weeks, our $1,900 price target is under review.


June Retail Sales Report is good for Habit Restaurant and Costco shares

Inside this week’s June Retail Sales Report there were several reasons for investors to take a bullish stance on consumer spending in light of the headline increase of 0.5% month-over-month. On a year-over-year basis, the June figure was an impressive 6.6%, but to get to the heart of it we need to exclude several line items that include “motor vehicles & parts” and “gas stations.” In doing so, we find June retail sales rose 6.4% year-over-year, which continues the acceleration that began in May. The strong retail sales numbers likely means upward revisions to second-quarter GDP expectations by the Atlanta Fed and N.Y. Fed. Despite the positive impact had on 2Q 2018 GDP, odds are this spending has only added to consumer debt levels which means more pressure on disposable income in the coming months as the Fed ticks interest rates higher.

Now let’s examine the meat of the June retail report and determine what it means for the Tematica Select List, in particular, our positions in Habit Restaurants Inc. (HABT) and Costco Wholesale (COST).

Digging into the report, we find retail sales at food services and drinking places rose 8.0% year-over-year in June — clearly the strongest increase over the last three months. How strong? Strong enough that it brought the quarter’s year-over-year increase to 6.1% for the category, more than double the year-over-year increase registered in the March quarter.

People clearly are back eating out and this was confirmed by the June findings from TDn2K’s Black Box Intelligence. Those findings showed that while overall restaurant sales rose 1.1% year over year in June, one of the stronger categories was the fast casual category, which benefitted from robust to-go sales. That restaurant category is the one in which Habit Restaurant competes, and the combination of these two June data points along with new store openings and higher prices increases our confidence in Habit’s second-quarter consensus revenue expectations.

  • Our price target on Habit Restaurants (HABT) remains $11.50

Now let’s turn to Costco – earlier this month the warehouse retailer reported net sales of $13.55 billion for the retail month of June an increase of 11.7% from $12.13 billion last year. Compared to the June Retail Sales Report, we can easily say Costco continues to take consumer wallet share. Even after removing the influences of gas sales and foreign currency, Costco’s June sales in the US rose 7.7% year over year and not to be left out its e-commerce sales jumped nearly 28% year over year as well. Those are great metrics, but exiting June, Costco has 752 warehouse locations opened with plans to further expand its footprint in the coming months. New warehouses means new members, which should continue to drive the very profitable membership fee income in the coming months, a key driver of EPS for the company.

Over the last few weeks, COST shares have been a strong performer. After several months in which it has clearly taken consumer wallet share and continued to expand its physical locations, I’m boosting our price target on COST shares to $230 from $220, which offers roughly 7% upside from current levels before factoring in the dividend. Subscribers should not commit fresh capital at current levels but should continue to enjoy the additional melt up to be had in the shares.

  • We are once again boosting our price target on Costco Wholesale (COST) shares to $230 from $220.


What to make of earnings from Netflix

Last week we added shares of Netflix (NFLX) to the Tematica Investing Select List given its leading position in streaming as well as original content, which makes it a natural for our newly recasted Digital Lifestyle investing theme, and robust upside in the share price even after climbing nearly 100% so far in 2018. As a reminder, our price target for NFLX is $525.

Earlier this week, Netflix reported its June quarter results and I had the pleasure of appearing on Cheddar to discuss the results as they hit the tape. What we learned was even though the company delivered better than expected EPS for the quarter, it missed on two key fronts for the quarter – revenue and subscriber growth. The company also lowered the bar on September quarter expectations. While NFLX shares plunged in

While NFLX shares plunged in after-market trading immediately after its earnings were announced on Monday, sliding down some 14%, yesterday the shares rallied back some to closed down a little more than 5% at the end of Tuesday’s trading session. Trading volume in NFLX shares was nearly 6x its normal levels, as the shares received several rating upgrades as well as a few downgrades and a few price target changes.

Here’s the thing, even though the company fell short of new subscriber targets for the quarter, it still grew its membership by more than 5 million in the quarter to hit 130 million memberships, an increase of 26% year over year. Combined with a 14% increase in average sales price, revenue in the quarter grew 43% year over year. Tight expense control led to the company’s operating margin to reach 11.8% in 2Q 2018, up from 4.6% in the year-ago quarter.

In recent quarters, the number of Netflix’s international subscribers outgrew the number of domestic ones, and that has a two-fold impact on the business. First, the company’s exposure to non-US currencies has grown to just over half of its streaming revenue and the strengthening dollar during 2Q 2018 weighed on the company’s international results. With its content production in 80 countries and expanding, Netflix will move more of its operating costs to non-US dollar currencies to put a more natural hedging strategy in place. Second, continued growth in its international markets means continuing to develop and acquire programming for those markets, which was confirmed by the company’s comments that its content cash spending will be weighted to the second half of this year.

From my perspective, the Netflix story is very much intact and the drivers we outlined have not changed in a week’s time. I continue to see Netflix shares rising further in the coming quarters as investors become increasingly comfortable with the company’s ability to deliver compelling content that will attract net new users, driving cash flow and bottom line profits.

  • Despite Netflix’s (NFLX) 2Q 2018 earnings results, I continue to see Netflix shares rising further in the coming quarters as investors become increasingly comfortable with the company’s ability to deliver compelling content that will attract net new users, driving cash flow and bottom line profits. Our NFLX price target remains $525.


Checking in on Farmland Partners

Last week we saw some wide swings in shares of Farmland Partners (FPI), and given its lack of analyst coverage I wanted to tackle this head-on. Before we get underway, let’s remember that Farmland Partners is a REIT that invests in farmland and looks to increase rents over time, which means paying close attention to farmer income and trends in certain agricultural prices such as corn, wheat and soybeans.

So what happened?

Two things really. First, a bearish opinion piece on FPI shares ran on Seeking Alpha last week, which accused FPI of “artificially increasing revenues by making loans to related-party tenants who round-trip the cash back to FPI as rent; 310% of 2017 earnings could be made-up.” Also according to the article FPI “has not disclosed that most of its loans have been made to two members of the management team” and it has “significantly overpaid for properties.”

As one might suspect, that article hit FPI shares hard to the gut, dropping them some 38%. Odds are that article caught ample attention, something it was designed to do. Soon thereafter, Farmland Partners responded with the following data:

  • The total notes and interest receivable under the Company’s loan program was $11.6 million, or 1.0% of the Company’s total assets, as of March 31, 2018.
  • The program generated $0.5 million in net revenues, or 1.1% of total revenue, in the year ended December 31, 2017.
  • The program is directed at farmers, including, as previously disclosed, tenants. It was publicly announced in August 2015, and included in the Company’s public disclosures since then. None of the borrowers under the program as of March 31, 2018 were related parties, or have other business relationships with the Company, other than as borrowers and, in some cases, tenants.

Those clarifications helped prop FPI shares up, but odds are it will take more work on the part of Farmland’s management team to fully reverse the drop in the shares.

In over two decades of investing, I’ve seen my fair share of bears extrapolate from a few, or less than few, data points to make a sweeping case against a company. When that happens, it tends to be short-lived with the effect fleeting as the company delivers in the ensuing quarters. Given the long-term prospects we discussed when we added FPI shares to the Select List, I’m rather confident over the long-term. In the short-term, the real issue we have to contend with is falling commodity prices and that brings us to our second topic of conversation.

As trade and tariffs have continued to escalate, we’ve seen corn, wheat and soybean prices come under pressure. Because these are key drivers of farmer income, we can understand FPI shares coming under some pressure. However, here’s the thing –  on the podcast, Lenore and I recently spoke with Sal Gilbertie of commodity trading firm Teucrium Trading, and he pointed out that not only are these commodity prices below production costs, something that historically is short-lived, but the demographic and production dynamics make the recent moves unsustainable. In short, China’s share of the global population is multiples ahead of its portion of the world’s arable land, which means that China will be forced to import corn, wheat and soybeans to not only feed its people but to feed its livestock as well. While China may be able to import from others, given the US is among the top exporters for those commodities, that can only last for a period of time.

Longer-term, the rising new middle class in China, India and other parts of greater Asia will continue to drive incremental demand for these commodities, which in the long-term view bodes well for FPI shares.

What I found rather interesting in Farmland’s press release was the following –  “We are evaluating what avenues are available to the Company and its stockholders to remedy the damage inflicted.” Looks like there could be some continued drama to be had.

  • While credibility questions will keep Farmland Partners (FPI) in the penalty box in the short term, we continue to favor the longer-term business fundamentals. Our price target on FPI shares remains $12.


Adding this Streaming Media Company to the Select List

Adding this Streaming Media Company to the Select List


Key Points from this Alert:

  • Our theme recasting continues as we combine the Connected Society, Cashless Consumption and Content is King themes into a new theme we call The Digital Lifestyle
  • We are adding Netflix (NFLX) shares to the Tematica Investing Select List as part of the Digital Lifestyle investment theme with a Buy rating and a $500 price target.


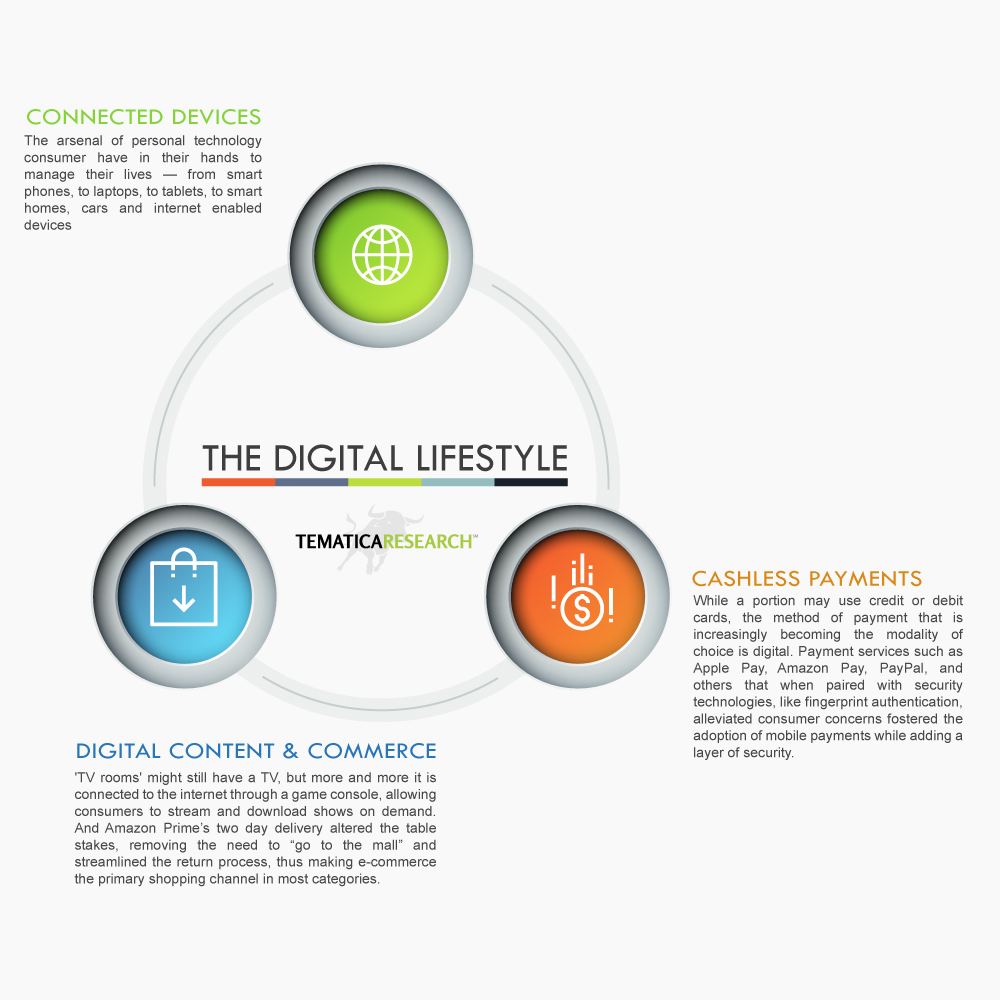
As part of constantly revisiting and testing our investing themes, from time to time we will make changes and enhancement to them. As part of that ongoing effort, we’ve recently recast our Middle Class Squeeze and New Middle Class investing themes, which entailed splitting a few themes apart and reconstituting them to make them clearer and more focused. Today, we’re combining Connected Society, Content is King and Cashless Consumption to form our Digital Lifestyle investing theme, which reflects a consumer’s existing and increasingly digital footprint.

In his 2018 shareholder letter, Jeff Bezos credited many people over Amazon’s successes and milestones, including what he called “divinely discontent customers.” As Bezos explained:

“People have a voracious appetite for a better way, and yesterday’s ‘wow’ quickly becomes today’s ‘ordinary’. I see that cycle of improvement happening at a faster rate than ever before. It may be because customers have such easy access to more information than ever before – in only a few seconds and with a couple taps on their phones, customers can read reviews, compare prices from multiple retailers, see whether something’s in stock, find out how fast it will ship or be available for pick-up, and more. These examples are from retail, but I sense that the same customer empowerment phenomenon is happening broadly across everything we do at Amazon and most other industries as well. You cannot rest on your laurels in this world. Customers won’t have it.”


What Bezos is correctly describing is the shifting landscape that underpins the consumer lifestyle to one that is increasingly connected and digital, and empowers the consumer. Enabling this shift is the confluence of high-speed data networks, computing power, and falling storage costs, which has led to a change in how consumers interact, share, shop, transact, game, pay and consume content. This, in turn, has upended existing business models, anointing companies that have been able to ride the tailwinds of this digital transition as consumers embrace the digital lifestyle. At the same time, ones such as newspapers and other publishers, brick & mortar retailers, travel agencies and other industries have been confounded by the headwinds associated with not responding to this evolving digital consumer lifestyle.


The Digital Lifestyle Transformation

If we accept the definition of the word “lifestyle” put forth by Merriam Webster that is “the typical way of life of an individual, group, or culture” there is little debate to be had over the differences between today’s’ digital lifestyle and its implications compared to consumer behavior 5, 10, 15, or even 20 years ago.

  • Consumers used to buy vinyl records, listen to music on the radio, read newspapers and watch TV, occasionally going to the movie theater and usually paid with cash.
  • Today consumers stream music and video (TV, movies or other) from over the top services such as YouTube, Netflix (NFLX), Hulu and Amazon Prime Video, consume news content, print or video, on their smartphones, tablets or Apple TV.
  • Instead of calling on a landline, people will message or video call their friends or family as they walk down the street.
  • While a portion may use credit or debit cards in store, the method of payment that is increasingly becoming the modality of choice is digital in nature be it on one’s tablet, smartphone or desktop.
  • Advertising has shifted from print, radio and increasingly TV to digital, fueling the business models of Google, Facebook (FB), Amazon, Twitter (TWTR), and others.

Today’s digital consumers have in their pockets, on their laps and in their cars an arsenal of personal technology to manage their lives. In the US, over 80% of consumers carried smart phones in 2017 vs. just 6% a decade earlier according to Comscore. These devices have more computing power than the mainframes used by NASA to launch Apollo 11 and their usage has altered the playing field like almost no other device before it.

Nearly half of these consumers use touch screen tablets, usually at home, to browse social networks, play games, and do a bit of window shopping or, increasingly, actual shopping. ‘TV rooms’ have a TV but more and more it is connected to the internet through a game console, allowing consumers to stream and download shows on demand. Consumers send messages to their oven to set the temperature. Wearable gadgets automatically send fitness statistics to the cloud. Vacuum robots respond to a smartphone and begin cleaning the house. Automatic door lock systems, garden watering systems, and connected thermostats are all available today.

Those are examples behind The Digital Lifestyle investment theme, but the following data summarizes the size and scope of it:

  • Each day in 2017, 269 billion emails were sent and received worldwide and that is expected to reach more than 333 billion in the next 5 years.
  • Messaging service WhatsApp has more than 1 billion daily active users across the globe that send more than 55 billion messages, and share in excess of 4.5 billion photos and 1 billion videos per day.
  • At the end of 1Q 2018, Netflix announced that its more than 121 million users watching more than 140 million hours of content per day, or 1 billion hours per week
  • According to eMarketer, in 2018 the average adult in China is set to spend 2 hours and 39 minutes per day on a mobile device this year, up 11.1 percent on 2017. Watching TV, meanwhile, is set to fall by two percent, to reach 2 hours 32 minutes daily. Adults in China are expected to spend 58 minutes per day watching video in 2018, up nearly 26% year over year, making up more than a quarter of their digital time. By 2020, adults in China will spend almost a third of their daily digital time watching video.
  • FTI Consulting expects U.S. online retail sales will top $600 billion by 2020 and surpass $1 trillion in 2027 compared to $445 billion in 2017 — representing a compounded annual growth rate (CAGR) of 12% through 2020 and 9% over the next decade.
  • Exiting 2017, Amazon Prime had 100 million subscribers – almost 27 million more than Apple Music, Sirius XM, Hulu, Pandora, New York Times, Tinder, CBS All Access and MoviePass combined.
  • People around the world are expected to make 726 billion transactions using digital payment technologies by 2020, according to a study from Capgemini and bank BNP Paribas. The study goes on to predict that tech innovations such as connected homes, contactless bank cards, wearable devices and augmented reality will drive cashless transactions in the future.
  • The global mobile payment segment has experienced exceptional growth in the last five years, establishing a $600 billion market in 2017. Mind Commerce estimates a $3 trillion mobile payment market by 2023.
  • In 2018, the mobile games industry is expected to generate revenue of $42 .2 billion in 2018 up from $36 billion in 2016, the year in which it first outperformed PC and console gaming for the first time in history. Mobile gaming continues to account for approximately half of the revenue earned by the global games industry, which is expected to stand at $108.9 billion by the end of this year. The estimated figure for the movie industry, meanwhile, is a little more modest, standing at $41.2 billion – less than the amount mobile gaming should earn in its own right.

This always on, always connected ready to transact evolution has reshaped industry dynamics giving rise to a number of companies that have not only ridden those tailwinds but in many ways have helped shaped them.

  • Apple (AAPL) first with the iPod then digital commerce platform that would become iTunes followed by the iPhone, iPad, and AppleTV as well as services like ApplePay and FaceTime as well as Siri, Apple’s intelligent assistant.
  • Amazon (AMZN)’s Prime offering continues to wreak havoc on brick & mortar retail even as the company continues to expand the scope of goods and services, including its private label offering. With its recent acquisition of PillPack, Amazon is flexing its world-class Prime logistics to disrupt the pharmacy industry while it is leveraging its purchase of Whole Foods to disrupt the grocery business.
    Underneath it all, Amazon is quietly expanding its payments presence with Amazon Pay as well as its intelligent assistant, Alexa, that has inked deals with automotive as well as appliance companies. But the real powerhouse inside Amazon is Amazon Web Services (AWS), which is the key differentiator vs. other retail facing companies as it delivers the bulk of Amazon’s operating profit and cash flow allowing it to fund these other disruptive initiatives.
  • The core business models at Facebook (FB) and Alphabet (GOOGL) are both benefitting from the shift in advertising spend to digital and mobile across their various platforms from print, radio TV and other media. Both are also moving into original content with Watch at Facebook and YouTube Red as well as into the payments space. Like Amazon, Google also has its own intelligent assistant dubbed Google Home and there is speculation that Facebook could follow suit.

Those companies along with streaming video service and original content Netflix (NFLX) form what is commonly referred to as the FAANG stocks. Each of these has various tailwinds that comprise The Digital Lifestyle investment theme powering their businesses, but as much as people may think of Amazon as The Digital Lifestyle theme company, the reality is Amazon Web Services is the clear profit and EPS generator at the company. Both Facebook and Alphabet are facing potential revenue and profit pressure associated with compliance with the EU’s General Data Protection Regulation (GDPR) that began in late May. With Apple, while it will have yet another round of new iPhones in the back half of 2018 the reality is the company’s next significant iPhone upgrade cycle won’t be had until 5G devices go mainstream.

There are other companies that are riding The Digital Lifestyle tailwind and range from GrubHub (GRUB) to Yelp (YELP), Spotify (SPOT), Twitter (TWTR), and PayPal (PYPL) while some like Snap (SNAP) and Blue Apron (APRN) are trying to. Survey findings from Cowen confirm what many have shared anecdotally, that Netflix is the platform consumers turn to most not only for its rich content library but increasingly for its new, original and proprietary content.

When Netflix announced its third-quarter earnings in mid-October, it predicted it would spend between $7-$8 billion on content in 2018. According to The Economist, citing data from Goldman Sachs, it appears  Netflix will spend $12-$13 billion on its films and shows this year. By comparison, Amazon Studios is expected to spend  $4 billion-plus and Apple a mere $1 billion plus on original content.

What is Netflix getting for all that spending? 

While Warner Bros. and Disney (DIS) will respectively release 23 and 10 films, Netflix is expected to roll out more than 80 films with the streaming service producing or acquiring 700 new or exclusively licensed programs, at least 100 of which are scripted dramas and comedies. These programs are being made in 21 countries, among them Brazil, India, and South Korea. That content is being created to help Netflix replicate its success outside the US. In 2016, the company’s global membership grew 48% and then in 2017 another 42%. By the end of March 2018, Netflix had reached 125 million worldwide subscribers, 57 million of whom are Americans.

As that subscriber base grows so too does the company’s subscription revenue and corresponding cash flow, which in our view offers predictability and lends itself to a premium valuation. It also helps the company continue to invest in its original content, which in turn feeds the streaming service. Given its sticky nature with consumers, we suspect that like Disney the company has some room to increase prices. Recently, the company shared that it is testing a new top-tier subscription plan that would redistribute current benefits while raising prices. Of course, Netflix will have to be careful not to gauge customers, but higher prices amid a growing global consumer base means higher revenue, profits and cash generation. That also helps assure investors with the company’s interest coverage metrics.

Netflix recently traded at 87x expected 2019 EPS of $4.69, which is up several fold, compared to the EPS of $0.46 the company reported in 2016. That’s a staggering EPS compound annual growth rate of roughly 220%, which means Netflix shares are trading Gt a P/E to growth (PEG) ratio of 0.4x. That’s a significant discount to Amazon and Facebook PEG multiples and a modest improvement in that metric to 0.5x delivers a price target of $525 for NFLX shares, more than 25% higher than current levels. The current valuation helps explain the sharp move higher in NFLX shares thus far in 2018, while the company’s robust content plans pave the way for more upside in the shares over the coming quarters. Should Netflix push through a new premium plan or boost its average price point in another fashion, given our comments above, we would see that as a positive catalyst for the shares.

  • As we enter the seasonally strong second half of the year for the company’s EPS generation, we are issuing a Buy on Netflix (NFLX) shares and adding them to the Tematica Investing Select List with a price target of $500.


Examples of companies rising The Digital Lifestyle Tailwind

  • Activision/Blizzard (ATVI)
  • Alphabet/Google (GOOGL)
  • Amazon (AMZN)
  • Apple (AAPL)
  • AT&T (T)
  • Facebook (FB)
  • GrubHub (GRUB)
  • MasterCard (MA)
  • Netflix (NFLX0
  • PayPal (PYPL)
  • United Parcel Service (UPS)
  • Yelp (YELP)

Examples of companies hitting The Digital Lifestyle Headwind

  • Barnes & Noble
  • Kroger (KR)
  • Saga Communications (SGA)
  • Simon Property Group (SPG)
  • Target (TGT)
  • Western Union (WU)

Again, those are short lists of EXAMPLES, not a full list of the companies benefitting or getting hit.


Tematica’s Recast New Middle Class Investing Theme

Tematica’s Recast New Middle Class Investing Theme


Key Points from this Alert:

  • We are completing the recasting of the Rise & Fall of the Middle Class investment theme with an introduction to the New Middle Class theme. 
  • We are adding International Flavors & Fragrances (IFF) shares back to the Tematica Investing Select List as part of the New Middle Class investment theme with a Buy rating and a $165 price target.


As part of constantly revisiting and testing our investing themes, from time to time we will make changes and enhancement to them. As part of that ongoing effort, we recently re-cast part of our Rise & Fall of the Middle Class investing theme. You can read about the change in detail by clicking here, but in summary, what we did was combine the aspect of the theme that deals with the struggling middle-class in the United States (the “Fall” part of the investment theme) and combined it with our Cash-Strapped Consumer theme to form the Middle Class Squeeze. That move left Rise of the New Middle Class, which we’ve shortened to the New Middle Class. This investing theme focuses on areas around the world, notably China and India, but other emerging markets as well where rising disposable incomes are driving demand for a host of products and services.

Why this focus on the middle class?

The middle-class is one of the primary engines behind consumption and domestic demand, in other words, a key part of the domestic economic engine. And while the middle class is under pressure in the U.S. and other mature markets, according to data published by the Brookings Institute, the middle class is set to grow worldwide by 160 million people per year on average through 2030. Let’s put some perspective around that — the size of the “global middle class” was 1.8 billion in 2009 and is expected to reach 3.2 billion by 2020 and then reach 4.9 billion by 2030.

Where is the vast majority of that middle-class growth slated to come from? Almost 90% of the next billion entrants into the global middle class will be in Asia: 380 million Indians, 350 million Chinese, and 210 million other Asians. In comparison, on a combined basis North America and Europe are expected to account for only a fifth of the world’s middle-class population, down from more than half in 2010.

And as the size of the middle class goes, so too does its influence on consumption. By 2030, North America and Europe are expected to account for 30% of the world’s middle-class consumption vs. 64% in 2010. Taking over the pole position and representing nearly 60% of middle-class consumption, as one might expect, is Asia with India and China slated to account for more than two-thirds of that consumption. In 2010, Asia represented just 23% of global middle-class consumption.

By 2020 in China, mainstream consumers are expected to for 51% of the urban population compared to 6% in 2010 and 1% in 2000 per McKinsey. While their absolute level of wealth will remain quite low compared with that of consumers in developed countries, this group of167 million households (close to 400 million people), will set the standard for consumption, capable of affording family cars and small luxury items. The result is a surge in discretionary spending that in part reflects aspirational drivers, such as consumers looking to improve themselves, the way they live, and their perceived social standing.

As these dynamics unfold in China, over time they will be replicated in India and other emerging markets. According to NCAER, India’s middle-class population would be 267 million in 2016. Further ahead, by 2025-26 the number of middle-class households in India is likely to more than double from the 2015-16 levels to 113.8 million households or 547 million individuals.

What is expected to unfold over the coming years is a significant shift in consumption dynamics that will favor the emerging economies like China, India, and larger Asia as well as Africa and several South American countries in the coming years.

According to research firm McKinsey & Company, these consumers tend to become more selective about where they spend their money, shifting from products to services and from mass to premium segments, seeking a more balanced life where health, family, and experiences take priority. Those findings also revealed the growth of premium segments is outpacing that of the mass and value segments, and foreign brands still hold a leadership position in the premium market.

Is it any wonder that Apple (AAPL) CEO Tim Cook has talked about the long-term, favorable demand dynamics in India and what it could mean for Apple’s businesses? If we look at forecasts for refrigerator, washing machines and other kitchen appliances, India is often cited as one of the key growth markets. But it’s not alone, sales of refrigerators, television sets, mobile phones, motors and automobiles have surged in virtually every African country in recent years as has car and motorcycle purchases.

Like any snowball that rolls downhill, it’s a slow start at first, but as time moves forward so too does the size and momentum of that snowball. The same is poised to happen with this new middle class and it’s increasing buying power. The ensuing ripple effects, however, will put pressure on global resources as they become wealthier and aspire to Western living standards. Their appetite for products, food, energy, housing and transport stimulates consumption, driving their economies, but that incremental demand will drive prices for products and services, and especially for scarce resources higher.


New Middle Class bodes well for International Flavors & Fragrances

The growth in discretionary spending as well as the growing importance of premium and branded products across a variety of categories. In keeping with our “buy the bullets, not the guns” investing strategy, we find International Flavors & Fragrances (IFF), whose scent and flavor solutions are found in a variety of consumer products, ranging from fine fragrances and beauty, detergents and household goods, and food and beverages. Moreover, the management team is focused on the emerging markets by leveraging its customer appetite to grow their businesses in emerging markets. Key customers include Procter & Gamble (PG), Unilever (UN), Colgate- Palmolive (CL), Estée Lauder (EL) and PepsiCo (PEP), and the top 25 account for a little more than 50% of IFF’s revenue. IFF derives roughly half of its revenue from the emerging markets.

In its latest report, “Global Markets for Flavors and Fragrances,” Research and Markets forecasts the global market to grow from $26 billion in 2015 to $37 billion by 2021 — an overall increase of more than 40%. We see fairly steady demand for the company’s flavors and fragrances in more mature markets given the participation in inelastic product categories such as personal care products (toothpaste, deodorant, shampoo, body and others) as well as household ones like detergents, softeners, cleaners and air fresheners. On top of that demand base, international demand in the emerging economies should continue to benefit from rising incomes and the continued adoption of the Western lifestyle when it comes to the personal care, household, food and beverage products that contain the company’s flavors and fragrance solutions. We see faster growth dynamics in those markets as consumers trade up in lifestyle.

What we find most fascinating about IFF’s business is, whether in flavors or fragrances, its products account for 1% to 5% of total product cost but influence the product’s scent or flavor that is responsible for repeat purchases. When was the last time something tasted or smelled awful and you opted to get more?

IFF’s business is also benefitting from the ongoing shift in consumer preference to natural and organic products. With its line of 100% pure and natural line of ingredients and extracts, IFF is well positioned to capitalize on this shift as its existing and prospective customers look to reformulate their products to exclude sugar and other “bad for you” ingredients without sacrificing taste or flavor. Helping accelerate its exposure to that additional tailwinds, in May IFF acquired Frutarom, a flavors, savory solutions and natural ingredients company that sells over 70,000 products to more than 30,000 customers in over 150 countries. With 43% of its 2017 revenue derived from the emerging markets up from 27% in 2010, and more than 75% of its sales comprised of natural products, Frutarom bolsters IFF’s exposure to both the New Middle Class and the global shift to natural, organic products.

The combination of inelastic demand in the mature markets, the rising demand for in the emerging markets and synergies to be had with the integration of Frutarom solidifies the company’s earnings growth prospects over the coming years. Current consensus expectations have IFF serving up EPS of $6.31 this year and $6.80 per share next year, up from $5.89 last year. That earnings growth bodes well for continued dividend increases in the coming quarters, continuing the company’s increasing dividend track record. Its current quarterly dividend sits at $0.69, up from $0.31 in the first half of 2012.

Owing to the escalating trade and tariff talk of the last few months that have also spared a move higher in the dollar, IFF share have fallen more than 20% thus far in 2018, which leaves them trading at a dividend yield near 2.25%. This is in line with trough dividend yield levels at which IFF shares have traded over the last decade-plus. This suggests that the worst has been priced into the shares, which for patient investors offers a favorable risk to reward to get into the shares and take advantage of the longer-term drivers laid out above. Historically, IFF shares have peaked near a dividend year of 1.7%, which, assuming no other dividend increase, yields upside in the shares to $165.

As we recast our New Middle Class investing theme, we are calling out shares of International Flavors & Fragrances (IFF) as a top New Middle Class pick:

  • We are adding International Flavors & Fragrances (IFF) shares back to the Tematica Investing Select List with a Buy rating and a $165 price target.


Examples of companies riding the New Middle-Class Tailwind

  • Alibaba (BABA)
  • MakeMyTrip (MMYT)
  • Nu Skin Enterprises (NUS)
  • Colgate Palmolive (CL) – 30% of oral care is to Asia
  • Proctor & Gamble (PG) – 32% of sales is Asia-Pac, China, Latin America, IMEA
  • McCormick & Co. (MKC)
  • McDonalds (MCD) — International Foundation Markets account for 43% of sales
  • Nike (NKE) – 30% of Nike branded sales are from Central & Eastern Europe, China, and the Emerging Markets


WEEKLY ISSUE: The Potential Impact Tariffs Will Have on 2nd Half Earnings

WEEKLY ISSUE: The Potential Impact Tariffs Will Have on 2nd Half Earnings


Given the way the Fourth of July holiday falls this year, we strongly suspect the back of the week will be quieter than usual. For those reasons, we’re coming at you earlier than usual this week. And while we have your attention, Tematica will be dark next week as we recharge our batteries ahead of the 2Q 2018 earnings onslaught that kicks off on July 16.

With the housekeeping stuff out of the way, let’s get to this week’s issue…

Closing the bookS on 1Q 2018

Last Friday, we closed the books on the second quarter, and while it’s true all four major US stock market indices delivered positive returns, the last three months were far more volatile than most expected back in January. Year to date, the Dow Jones Industrial Average remains modestly in the red and the S&P 500 modestly in the green. By comparison, despite being overshadowed in the second quarter by the small-cap heavy Russell 2000, the Nasdaq Composite Index finished the first half of the year with a 9% gain.

From a Tematica Investing Select List perspective, there we a number of outperformers to be had including Alphabet (GOOGL), Amazon (AMZN), Apple (AAPL), Costco Wholesale (COST), ETFMG Prime Cyber Security ETF (HACK), McCormick & Co. (MKC), USA Technologies (USAT). To paraphrase one of team Tematica’s favorite movies, Star Wards, our themes are strong with those companies. As much as we like the accolades to be had with performing positions, there are ones such as Dycom Industries (DY), Nokia (NOK), AXT Inc. (AXTI) and Applied Materials (AMAT) that had a challenging few months but they too should be seeing the benefits of thematic tailwinds in the coming months.

During the quarter, we did some fine tuning with the Select List, adding shares of GSV Capital (GSVC), Habit Restaurant (HABT) and Farmland Partners (FPI). We also shed our positions in Starbucks (SBUX), LSI Industries (LYTS), Corning (GLW) and International Flavors & Fragrances (IFF) during the second quarter. In making those moves, we’ve enhanced the Select List’s position for the back half of 2018 as the focus for investors centers on the impact of trade and tariffs on revenue and earnings. Let’s discuss…


First Harley Davidson, then BMW and General Motors

Last week we were reminded that trade wars and escalating tariffs increasingly are on the minds of investors. Something that at first was thought would be short-lived has grown into something far more pronounced and widespread, with tariffs potentially being exchanged among the U.S., China, the European Union, Mexico and Canada. As we discussed Harley-Davidson (HOG) shared that its motorcycle business will be whacked by President Trump’s decision to impose a new 25% tariff on steel imports from the EU and a 10% tariff on imported aluminum.

We soon heard from BMW (BMWG) that U.S. tariffs on imported cars could lead it to reduce investment and cut jobs in the United States due to the large number of cars it exports from its South Carolina plant. Soon thereafter, General Motors (GM) warned that if President Trump pushed ahead with another wave of tariffs, the move could backfire, leading to “less investment, fewer jobs and lower wages” for its employees. Then yesterday, citing a state-by-state analysis, the new campaign argues that Trump is risking a global trade war that will hit the wallets of U.S. consumers,  the U.S. Chamber of Commerce shared it would launch a campaign to oppose Trump’s trade tariff policies.

With up to $50 billion in additional tariffs being placed on Chinese goods after July 6, continued tariff retaliation by China and others could lead to a major reset of earnings expectations in the back half of 2018. And ahead of that potential phase-in date, Canada’s foreign minister announced plans to impose about $12.6 billion worth of retaliatory tariffs on U.S. goods beginning yesterday. Not all companies may swallow the tariffs the way Harley Davidson is choosing to, which likely means consumers and business will be paying higher prices in the coming months. That will show up in the inflation metrics, and most likely lead to the Fed being more aggressive on interest rate hikes than previously thought.

As part of our Middle-Class Squeeze investing theme, a growing number of consumers are already seeing their buying power erode, and if the gaming out of what could come it means more folks will be shopping with Amazon (AMZN) and Costco Wholesale (COST) and consumer McCormick & Co. (MKC) products.


Falling investor sentiment sets the stage for 2Q 2018 earnings

All of this, is weighing on the market mood and investor sentiment as we get ready for the 2Q 2018 earnings season. Remember that earlier this year, investors were expecting earnings to rise as the benefits of tax reform were thought to jumpstart the economy and if Harley Davidson is the canary in the coal mine, we are likely going to see those expectations reset lower. We could see management teams offer “everything and the kitchen sink” explanations should they rejigger their outlooks to factor in potential tariff implications, and their words are likely to be met with a “shoot first, ask questions later” mentality by investors.

Helping fan the flames of that investor mindset, the Citibank Economic Surprise Index (CESI) has dropped into negative territory. We’ve discussed this indicator before as has Tematica’s Chief Macro Strategist Lenore Hawkins, but as a quick reminder CESI tracks the rate that U.S. economic indicators come in better or worse than estimates over a rolling three-month period. When indicators are better than expected, the CESI is in positive territory and when indicators disappoint, it is negative.

As Lenore pointed out in last week’s Weekly Wrap:

While the CESI has just dropped into negative territory, let’s add some context and perspective — the index has had an impressive run of 188 trading days of positive readings, the longest such streak by 37 days in the 15-year history of the index. Now some of that reflects the enthusiasm surrounding tax reform and its economic prospects from the start of the year, but economic reality is now hitting those earlier expectations. Odds are the reality as seen through the trade and tariff glasses will continue to weigh on the CESI in the coming weeks, adding to investor anxiety.

I’d point out the level of anxiety hit Fear last week on the CNNMoney Fear & Greed Index, down from Neutral a month ago. But there is reason to think it will not rebound quite so quickly…


Here’s the question investors are pondering

The growing question in investors’ minds is likely to center on the potential impact in the second half of 2018 from these tariffs if they are enacted for something longer than a short period. While GDP expectations for the current quarter have climbed, the concern we have is the cost side of the equation for both companies and consumers, thanks in part to Harley-Davidson’s recent comments.

We have yet to see any meaningful change to the 2018 consensus earnings forecast for the S&P 500 this year, which currently sits around $160.85 per share, up roughly 12% year over year. But we will soon be entering second-quarter earnings season and could very well see results and comments lead to expectation changes that run the risk of weighing on the market. Given the upsizing of corporate buyback programs over the last few months due in part to tax reform, any potential pullback could be muted as companies scoop up shares and pave the way for further EPS growth as they shrink their share count. That means we’ll be increasingly focused on the internals of earnings reports as well as new order and backlog metrics.

There are roughly a handful of companies reporting this week, and next week sees a modest pick-up in reports, with roughly 25 companies issuing their latest quarterly results. It’s the week after, that sees the number of earnings reports mushroom to more than 220. We’ll enjoy the slower pace over the next two weeks as we get ready for that onslaught, but we will be paying close attention to comments on potential tariff impacts in the second half of 2018 and what that means for earnings expectations for both the market as well as companies on the Select List.


As streaming music booms, CD sales are no more at Best Buy 

As streaming music booms, CD sales are no more at Best Buy 

One of the industries that has both adapted to and felt the pain of our Digital Lifestyle investing theme is the music industry, something near and dear to the hearts and souls of team Tematica. Over the decades, we’ve seen the migration from vinyl albums to 8-track to cassettes to CDs followed by the abiltiy to rip and burn CDs, downloadable music and now streaming services. While it’s resulted in people buying the same music content more than once, people have continued to do so to have the music they want when they want it, where they want it and on the device they have at the moment. This has given rise to streaming subscription services like Pandora, Spotify, and Apple Music.

According to Loudwire, more than 62% of the total music market is now made up of streaming services, and physical sales only account for around 16% of the overall revenues. Following an announcement earlier this year, yesterday we said bye-bye to CD sales at Best Buy and soon perhaps at Target. What will Best Buy use the additional floor space for? Most likely appliances and other connected devices.


It’s the end of an era. Today is officially the last day you will be able to buy CDs at Best Buy, as they are pulling the discs from their shelves July 1st.

Back in February, we reported that the tech giant would be phasing out the products due to steadily declining sales over the years.

Seeing as Best Buy followed through on their promise, Target may be next to phase out CDs. In February, they gave an ultimatum to both their music and video suppliers trying to shift inventory risk back to the labels. If the wholesale companies don’t abide to the new terms, Target may slowly phase out CDs and DVDs as well.

Source: Today is the last day you can purchase CDs at Best Buy – Alternative Press