Author Archives: Chris Versace, Chief Investment Officer

About Chris Versace, Chief Investment Officer

I'm the Chief Investment Officer of Tematica Research and editor of Tematica Investing newsletter. All of that capitalizes on my near 20 years in the investment industry, nearly all of it breaking down industries and recommending stocks. In that time, I've been ranked an All Star Analyst by Zacks Investment Research and my efforts in analyzing industries, companies and equities have been recognized by both Institutional Investor and Thomson Reuters’ StarMine Monitor. In my travels, I've covered cyclicals, tech and more, which gives me a different vantage point, one that uses not only an ecosystem or food chain perspective, but one that also examines demographics, economics, psychographics and more when formulating my investment views. The question I most often get is "Are you related to…."
SPECIAL ALERT – Buying more shares of this beaten up Disruptive Technology company

SPECIAL ALERT – Buying more shares of this beaten up Disruptive Technology company


KEY POINTS FROM THIS ALERT

  • We will use the recent 35%+ drop in Universal Display (OLED) to double down on this Disruptive Technology company.
  • Our long-term price target of $225 remains intact.
  • We are suspending our $125 stop loss on OLED shares.


Despite crushing December-quarter expectations last week, Universal Display (OLED) shares were hard hit over the last several days. The catalyst behind this change in investor sentiment was the fact that the company offered a weaker-than-expected outlook for the near term, even though it reiterated the long-term opportunities it sees from the adoption of its proprietary organic light-emitting diode displays.

As I have shared more than a few times, the roadmap for organic light emitting diode adoption is clearly seen when we look at the light emitting diode (LED) industry. We first saw major adoption with color screens in mobile phones and TV before going on to the automotive lighting and general illumination markets. Amid Mobile World Congress 2018 in Barcelona this week, Samsung had debuted its latest flagship smartphone, the Galaxy S9, that, yes, contains an organic light emitting diode display.


Has the move lower in OLED shares been painful?

Yes, there is no denying that, but we also know that at least in the near term the market is especially short-term focused.

In my view, like any robust meal, we are likely seeing what is called an intermezzo course — something to cleanse the palate and offer the diner a brief respite. For the organic light-emitting diode display industry, it means digesting the rapid rise in industry capacity over the last 18-24 months that has fueled Universal’s business and its share price. While not pleasant, it’s a natural part of any rapidly rising industry.


How will we respond to the recent price pressure in OLED shares?

Even though we are up still up significantly in our OLED shares, we are going to take advantage of the short-term focused drop of more than 35% in the shares to our long-term advantage, by scaling into the shares at current levels. While this will dilute our cost basis, it’s the prudent thing to do as OLED shares are far better priced for such a move today than they have been in the last four months. I’d also add that as much as I enjoyed watching OLED shares rocket higher in late 2017 and in January, the shares were likely a bit ahead of themselves.


Are we changing our long-term price target of $225 for OLED shares?

With far more opportunities to be had as the organic light emitting diode display market expands deeper into smartphones and TVs, and enters new ones in the coming 12-24 months, our price target of $225 remains intact.

As part of adding to our OLED position, we will temporarily suspend our $125 stop loss, and look to revisit this as calmer heads prevail with OLED shares.


WEEKLY ISSUE: Volatility is back and will be with us for at least the next several weeks

WEEKLY ISSUE: Volatility is back and will be with us for at least the next several weeks


Even though it was a holiday, on Monday, I shared my view on what will be moving and shaking the stock market this week as well as what earnings we have on tap this week from the Tematica Investing Select List. We’re also just over half way through the current quarter and by this time next week, we’ll be getting ready to shut the books of February. That means we’ll have two of the three months in 1Q 2018 behind us. It also means the coming weeks will bring us a smattering of February data that will help us get a better measure on the vector and velocity of the domestic as well as global economy. That data will set the stage as well as expectations for the Fed’s next FOMC meeting to be held on Mar. 20-21.

As I’ve said on recent episodes of our Cocktail Investing Podcast, while the stock market is watching inflation data ahead of the next FOMC meeting in the hopes of gauging the Fed’s upcoming economic and potential policy update. In my view, the event the stock market is really looking forward to is the updated outlooks to be had on Mar. 21. Not only will this include the Fed’s latest thinking on the speed of the economy and inflation outlook, but it will also be the first commentary offered by new Fed Chairman Jerome Powell. Many have cited Powell’s tendency to vote alongside now former Fed chair Janet Yellen, but now Powell is in the Fed hot seat, and many, including us here at Tematica, are anxious to see if he remains as dovish as many suspect.

The bottom line is over the next four weeks or so all eyes will be puzzling out the data to be had. That likely means the stock market will pivot and roll based on the latest data point similar to what we saw between the January Employment Report and the January CPI Report. Said another way, volatility is back and will be with us at least for the next several weeks. As I’ve said before, volatility is not a bad thing – it can offer us an opportunity if we’re prepared, and given our Contender List, I would argue that we are just that.

In next week’s Tematica Investing, I’ll have a short update on each of the current Tematica Investing Select List positions. Ahead of those myriad updates, here is one for MGM Resorts (MGM), which reported quarterly earnings yesterday, as well as some thoughts on Walmart (WMT) as we add it to the Contender List. Speaking of the Contender List, I review the news on Rite Aid (RAD) shares as well. In the next few days, I’ll be providing a deep dive on engine company Cummins Inc. (CMI). Will it make the Select List or just be a Contender? My take later this week.


December quarter results for MGM Resorts (MGM)

Yesterday, Guilty Pleasurecompany MGM Resorts (MGM)reported December quarter results that beat on the top line but missed on the bottom line after adjusting for a non-recurring, non-cash income tax benefit of $2.52 due to the enactment of U.S. Tax Reform at the end of 2017. Excluding that benefit, the company’s bottom line fell well short of the expected $0.08 per share in earnings for the December quarter and the $0.04 achieved in the year-ago quarter. To help take the sting out of that miss, MGM’s Board approved a 9% increase in the quarterly dividend to $0.12 per share from $0.11. In addition to that good news, the company’s earnings press release had a less than subtle reminder that it has $672.5 million remaining under its current stock repurchase authorization. At the current share price, that would equate to more than 19 million MGM shares or 3%-3.5% of the company’s total outstanding shares.

In parsing the earnings release, we can see lower year over year vacancy rates in Las Vegas, which we attribute to recent shooting, as well as higher expenses, which reflect the opening and refurbishment activities during the quarter. While these were expected, the magnitude appears to be more than Wall Street was thinking even though on the earnings conference call MGM management shared the December quarter came in better than was internally expected back in October following the shooting.

That was the all contained in the earnings press release, but what was had on the follow-up earnings conference call, well that was something different. On that call, management shared that based on what it is seeing quarter to date both in Macau and Las Vegas it is expecting a “strong year” due in part to the recent opening of MGM Macau Cotai as well as the separation this year between the Super Bowl and Chinese New Year. Moving past the current quarter, MGM has a solid line up of entertainment and sporting events that should continue to be a draw to the company’s hotels, restaurants and casinos. Some of the headline entertainment in the coming months include Cher, Ricky Martin, Kevin Hart, Paul Simon, Justin Timberlake and Bon Jovi among others. In my view, this paints the picture of moving past the seasonally slow part of the year, but I’ll be looking for confirmation of the monthly gaming data for Nevada and Macau.

Shifting gears, based on the commentary surrounding the Tax Act, I suspect we will see EPS estimates rising, some for 2018 but more for 2019 and beyond given the changes to the company’s estimated effective tax rate. On the earnings call, MGM shared it sees the effective tax rate for 2018 landing in the low to mid 20%s and falling to the mid-to-high teens for 2019 and beyond. That upward move in EPS, combined with the 9% increase in the company’s quarterly dividend, supports our increasing our price target on MGM shares to $39 from $37.

As we’ve discussed previously, one potential new market for gaming is Japan and per MGM that topic should come to a boil mid-year when the Japanese government is expected to tackle the gaming bill. Given its presence in Macau, we see MGM as well positioned to capture wallet share if and when Japan opens its borders to the gaming industry. I’ll continue to monitor this development and what it means for this Guilty Pleasure company on the Tematic Investing Select List.

  • We are boosting our price target on the shares of MGM Resorts to $39 from $37. Our recommendation is subscribers be more active buyers below $33.50.


Adding Walmart to the Tematica Investing Contender List

Also, yesterday, increasingly omnichannel retailer Walmart (WMT) reported December quarter earnings that missed expectations, with the company clearly signaling that it will continue to invest in its ongoing transformation. Those investments along with higher freight costs, which I see as a resounding positive for the recently added PACCAR (PCAR) shares to the Tematica Investing Select List, hit Walmart’s margins in the December quarter and are expected to do so in the coming months as well.

Adding insult to injury, Wall Street didn’t like that Walmart’s digital sales rose just 23% year over year in the December quarter. The criticism is it was a sharp slowdown from the 50% growth rates in the prior quarter, but let’s remember the December 2017 quarter saw the anniversary of Walmart’s JET.com acquisition. We also know that other companies, like United Parcel Service (UPS)were overwhelmed by the shift to digital commerce from brick & mortar sales this past holiday shopping season. I suspect the same was true from Walmart.

Also catching investors off guard, Walmart is now shifting to annual guidance and shared it see the current year coming in at $4.75-$5.00, well below the consensus of $5.08 per share that Wall Street was modeling. That miss, which was somewhat softened by the 45thhike to Walmart’s annual dividend to $2.08 per share from the prior $2.04 per share, led WMT shares to have one of their worst days since January 1988 as they fell more than 10%.

Several times before, I’ve shared my view that Walmart alongside current Tematica Investing Select List residents Amazon (AMZN)and Costco (COST)is likely to be one of the three major retailers to be had amid the current brick & mortar shake-up. While Walmart’s margins are being hit today, I see the company following a similar path taken by Amazon in 2015-2016 as it invested for the Connected Society tailwind it, and we, saw coming. Over the coming weeks, I’ll be digging more into Walmart’s business as well as determining the potential upside to be had in the shares over the coming 12-24 months as it realizes the benefits of investments made in the near-to-medium term. As such we are placing WMT shares on the Tematica Investing Contender List.

  • We are adding Walmart (WMT) shares to the Tematica Investing Contender List.
  • Our price target on Amazon (AMZN) shares remains $1,750.


Contender List Rite-Aid catches a bid from Albertsons

Yesterday, The Wall StreetJournal is reporting that privately held grocery chain Albertson’s “plans to buy the rest of Rite Aid Corp. (RAD) that isn’t being sold to Walgreens Boots Alliance (WBA).” When I added RAD shares to the Contender List in January, I labeled the company a turnaround story, and while that likely remains the case – how much progress could even a stellar management team make in five weeks? – the reality is we are seeing both grocery as well as pharmacy companies scramble in the wake of Amazon.

While details on the proposed transaction are scant, per the Journal, the cited transaction would lead to Albertsons, which already owns Safeway and 19 other supermarket chains, holding “roughly 71% of the combined company, while Rite Aid investors would own the rest.” Now, this is where things get interesting, following completion of the merger, Albertsons Companies shares are expected to trade on the New York Stock Exchange.

The combined company will operate approximately 4,900 locations across under 20 well-known banners including Albertsons, Safeway, Vons, Jewel-Osco, Shaw’s, Acme, Tom Thumb, Randalls, United Supermarkets, Pavilions, Star Market, Haggen and Carrs, as well as meal kit company Plated. In addition, the new Albertsons will have, 4,350 pharmacy counters, and 320 clinics across 38 states and Washington, D.C., with its full complement of locations serving 40+ million customers per week.

On a pro forma basis, during its first year, the combined company is expected to generate revenue of approximately $83 billion and adjusted EBITDA of approximately $3.7 billion, which bakes in run-rate cost synergies to be had. As one might expect, the transaction has been approved unanimously by the boards of directors of both companies, and the merger is expected to close early in the second half of the calendar year 2018.

From my perspective, this combination is a response to the impact Amazon is having on the grocery industry as well as over the counter health products with companies such as Albertson’s looking to tap into the tailwind of our Aging of the Population theme. Much like with Costco Wholesale (COST)and McCormick & Co. (MKC), we see Albertson’s line of grocery stores as well positioned for the increasingly debt-laden Cash-strapped Consumers that are shifting to eating at home and embrace our Food with Integrity theme when and where possible. We saw proof of this shift in the January Retail Sales Report that showed food-and-beverage retail sales at grocery stores climbing 4.5% year over year vs. falling same-store sales and traffic in January reported by the National Restaurant Association.

As we approach the closing of the merger between these two companies and more details become available, I’ll look to be the new company through its paces to see if it deserves an update to Select List… or not.

  • Our price target on Costco Wholesale (COST) remains $200.
  • Our price target on McCormick & Co (MKC) remains $110.


A reminder on Universal Display’s earnings report

After tomorrow’s market close, Disruptive Technologies investment theme company Universal Display (OLED) will report its December quarterly results. I expect an upbeat earnings report to be had relative to the December quarter consensus forecast for EPS of $0.85 on revenue of $100 million, up 55% and 34%, respectively, year over year. Based on what I’ve heard from Applied Materials (AMAT)as well as developments over organic light emitting diode TVs and other devices at CES 2018, I also expect Universal will offer a positive outlook for the current as well as coming quarters.

  • Our price target on OLED shares remains $225.


With more earnings on the way, getting ready for a shortened week for stocks

With more earnings on the way, getting ready for a shortened week for stocks

Today is all quiet when it comes to the domestic stock market as they are closed in observance of President’s Day. While never one to dismiss a long weekend, it does mean having a shorter trading week ahead of us. From time to time, that can mean a frenetic pace depending of the mixture and velocity of data to be had. This week, there are less than a handful of key economic indicators coming at us including the January Existing Home Sales report and one for Leading Indicators.

Midweek, we’ll get the report that I suspect will be the focus for most investors this week – the monthly Flash PMI reports for China, Europe and the U.S. from Markit Economics. These will not only provide details to gauge the velocity of the economy in February, but also offer the latest view on input prices and inflation. Given the inflation focus that was had between the January Employment Report and the January CPI report, this new data will likely be a  keen focus for inflation hawks and other investors. I expect we here at Tematica will have some observations and musings to share as we digest those Flash PMI reports.

On the earnings front, if you were hoping for a change of pace after the last two weeks, we’re sorry to break the news that more than 550 companies will be reporting next week. As one might expect there will be a number of key reports from the likes of Home Depot (HD) and Walmart (WMT).  For the Tematica Investing Select List, we’ll get results from four holdings:


MGM Resorts (MGM) on Tuesday (Feb. 20)

When this gaming and hospitality company reports its quarterly results, let’s remember the Las Vegas shooting that had a negative impact on overall industry Las Vegas gaming activity early in the December quarter. In amassing the monthly industry gaming data, while gaming revenue rebounded as the seasonally slow quarter progressed, for the three months in full it fell 5% year over year. Offsetting that, overall industry gaming revenue for the December quarter rose 20% year over year in Macau.

Putting these factors together and balancing them for MGM’s revenue mix, we’ve seen EPS and revenue expectations move to the now current $0.08 and $2.5 billion vs. $0.11 and $2.46 billion in the year ago quarter. On MGM’s earnings call, we’ll be looking to see if corporate spending is ramping down as had been predicted as well as what the early data has to say about the new Macau casino. We’ll also get insight on the potential direct and indirect benefits of tax reform for MGM’s bottom line.

  • Heading into that report our price target for MGM shares remains $37.


Universal Display (OLED) on Thursday (Feb. 22).

After several painful weeks, shares of Universal Display rebounded meaningfully last week following the news it re-signed Samsung to a multi-year licensing deal and an upbeat outlook from Applied Materials (AMAT)for the organic light-emitting display market. For subscribers who have been on the sidelines for this position, with the Apple (AAPL) iPhone X production news now baked in the cake we see this as the time to get into the shares. We expect an upbeat earnings report to be had relative to the December quarter consensus forecast for EPS of $0.85 on revenue of $100 million, up 55% and 34%, respectively, year over year.

Based on what we’ve heard from Applied as well as developments over organic light emitting diode TVs and other devices at CES 2018, we also expect Universal will offer a positive outlook for the current as well as coming quarters.

  • Our price target on OLED shares remains $225.


Disney’s The Black Panther gets 4 of 4 paws

Disney’s The Black Panther gets 4 of 4 paws

While we tend to focus on global-macro and thematic investing here at Tematica, we are people and that means that from time to time we too like to have some fun and share some of the things we find enjoyable. It doesn’t hurt that in some instances the little pleasures fit with our investment themes or spring from a company on the Tematica Investing Select List. So from time to time, we’ll let our hair down so to speak and share some of those things that we’re doing, spending on, seeing, and more importantly enjoying.

As a long-time self-confessed comic book nerd, I plunked down my money and eagerly saw The Black Panther, the latest in a series of box office crushing films from Disney (DIS) owned Marvel Studios. The storyline, the conclusion of which promises to alter the course of the Marvel Cinematic Universe as well as set up Marvel’s Avengers: Infinity War, was enjoyable even though to most comic book nerds it is somewhat predictable. That said, much like Iron Man, Captain American: The First Avenger and even Ant-Manthere is much back story groundwork to be covered, especially in this newer aspect of Marvel Cinematic Universe. To say Marvel has become adept at layering the backstory into the story telling process would be an understatement, but much credit also has to go to director Ryan Coogler who filmed a thoroughly enjoyable and digestibly dense movie, that

Are the characters multi-faceted and more than dimensional? Yes, and I credit Marvel’s history of story-telling, which has improved much over the 10-years it has been delivering films based on its characters. The Black Pantheralso used humor well, far better than, in my opinion, too jokey Thor: Ragnarok.

Did I like how King T’Challa’s honor guard was, much like the comics, staffed by more than capable warriors, all of which were women? Loved it and not because it allowed Marvel to check several diversity boxes, quelling much of the criticism it has received with its prior slate of movies. Did the check boxing seem forced? Not at all, rather it fit perfectly with the storyline and history of the Black Panther – all one needs to do is read the source material.

Does King T’Challa’s sister Shuri look to give Marvel’s Tony Stark a run for his money in the techno-genius department? Based on the various technologies created by Shuri that are on display in the movie, it sure does and there’s the added benefit that when needed Shuri kicks butt AND keeps the banter going. To Robert Downey Jr.’s Tony Stark, all I can say is, watch out! The portrayal of Shuri by Letitia Wright, Nakia by Lupita Nyong’o and Okoye by Danai Gurira shows that Marvel can deliver well rounded female characters that can be funny, smart and strong. I can’t wait for Marvel’s Captain Marvel.

The bottom line is whether you’re a fan of super hero films or not, it’s a well-crafted story that expands as well as enhances the Marvel tapestry, and the post-credit scenes advance the inter connected storyline that Marvel has carefully put in place over the last 10 years. It’s great fun, and I recommend seeing it.

I give The Black Panthergets 4 or of 4 paws and you can watch the trailer here.

Are there positive Content is King implications for Disney to be had with The Black Panther above and beyond the box office? In my view, it’s a clear cut “yes” and I’ll be sharing those thoughts with subscribers to Tematica Investing in the coming week.

  • Our long-term price target on the shares for Content is King company Disney (DIS) remains $125


Applied served up another winning quarter, that’s good for OLED shares too

Applied served up another winning quarter, that’s good for OLED shares too


KEY POINTS FROM THIS ALERT:

  • Our price target on Applied Materials (AMAT) shares remains $70.
  • Our price target on Universal Display (OLED) shares remains $225.


Midweek, we saw yet another dynamite earnings report from Tematica Investing Select List company Applied Materials (AMAT).   The company simply walked right over expectations and not only raised its outlook, but also boosted its quarterly dividend and share repurchase program. Simply put, it was a picture-perfect earnings report from top to bottom, and in keeping with increasing presence of our Connected Society investing theme, Applied’s management team shared a number of reasons why as I like to say, “chips are the fabric of our digital lives.”

While many of the talking heads are bemoaning slower growth prospects for the smartphone market, the devices continue to pack more functionality and storage inside their packages, and this is before 5G. Voice recognition technology and greater processing power to handle that as well as augmented reality, virtual reality technologies are leading to greater chip dollar content in these devices despite slower unit growth. Per Applied average semiconductor content per smartphone rose 30% in 2017.  To use the investing lingo, we are seeing rising average dollar content per device that is poised to step up again in 2019-2020 as those aforementioned 5G chips make their way into smartphones as AT&T (T), Verizon (VZ), Sprint (S) and T-Mobile USA (TMUS) all launch 5G commercial networks.

We’re also hearing quite a bit about the growing voice assistant market as Apple (AAPL) launches its Home Pod and Amazon (AMZN) touted 2017 was a banner year for its Alexa powered devices. What’s not really talked about, however, is the typical voice assistant has around 30 chips and a total of 200 square millimeters of silicon, roughly twice the area of a smartphone application processor. Now let’s think about not only the new types of voice assistants we are seeing from Amazon with video screens, but how these digital assistants are being embedded in other devices ranging from TVs to a road map that includes home appliances and autos. All of these digital assistants are connected back to servers like Amazon Web Services and the artificial intelligence workloads require server architectures that have up to eight times more logic and four times more memory content by area than traditional enterprise servers.

The bottom line is the Internet of Things, big data, augmented reality, artificial intelligence, data centers and storage are driving incremental chip demand. This tailwind of our Connected Society investment theme is leading Applied to raise its wafer spending forecast among its customer base to $100 billion over 2018-2019, up from $90 billion in 2017-2018. One of the wild cards for potential upside to that forecast is China, which continues to add domestic capacity, which is benefitting Applied given its leading market share position in the region.

Turning to Applied’s Display business, which is benefitting from larger format TVs as well as the ramp in organic light emitting diode (OLED) display capacity. These drivers have led Applied to forecast more than 30% growth in its Display business in 2018, which follows nearly 60% growth in 2017. Digging into the company’s comments on the earnings conference call, it is not only seeing rising OLED demand, but also a diversification in its customer base which in my view reinforces the

Previously, one customer (most likely Samsung) was more than 50% of its OLED business, and now more than 50% of Applied’s OLED business, but that has flip-flopped and now more than 50% is coming from multiple customers. That widening in demand is not only good for Applied, but it also points to an expanding market for Universal Display’s (OLED) chemical and IP licensing business as well.

On the dividend and share repurchase fronts, Applied Material’s Board of Directors approved a doubling of the quarterly cash dividend on the company’s common stock to $0.20 per share. That new dividend will be payable on June 14, to shareholders of record as of May 24. Ahead of that, Applied will pay its next cash dividend of $0.10 per share on March 14. The Board also approved a new $6.0 billion share repurchase authorization that is in addition to the $2.8 billion remaining under its previously approved authorization. I see these two offering a combination of support for our $70 price target on AMAT shares, while also providing support for the shares. At the current share price, the combined $8.8 billion in repurchasing power equates to roughly 166 million shares, roughly 15% of the company’s overall share count. Do I expect it to happen in one fell swoop? Nope, but it’s a factor that offers a way for the company to continue to meet and potentially beat Wall Street EPS expectations.

Given the consequences a company faces should it miss a dividend payment or find itself in the position to cut it, it’s not a simple decision for a company to boost its dividend, let alone double the existing quarterly payment. In my opinion, that alone says volumes about Applied’s confidence in its business over the coming years, and the additional and upsized buyback program only adds to that.

  • Our price target on Applied Materials (AMAT) shares remains $70.
  • Our price target on Universal Display (OLED) shares remains $225.


WEEKLY ISSUE: Is Inflation Rearing Its Ugly Head or Not?

WEEKLY ISSUE: Is Inflation Rearing Its Ugly Head or Not?

Today is the day that we here at Tematica, and other investors as well, have been waiting for to make some semblance of the recent stock market volatility. Earlier this morning we received the January Consumer Price Index (CPI), one of the closely watched measures of that now dirty word – inflation. As a quick reminder, the market swings over the last two weeks were ignited by the headline wage data in the January Employment Report, as well as other signs, such as rising freight costs that led us to add shares of Paccar (PCAR) to the Tematica Investing Select List earlier this week. This topic of resetting inflation expectations and what it may mean for the Fed and interest rates has been a topic of conversation on recent Cocktail Investing Podcast between Tematica’s Chief Macro Strategist Lenore Hawkins and myself.


What the January CPI Report Showed and Its Impact on AMZN, COST and UPS

The headline figures from the January CPI report showed the CPI rose 0.5% month over month in January, which equates to a 2.1% increase year over year. Keeping in sync with the headline figure, which includes all categories, the consensus expectation was for a 0.3% month over month increase. The driver of the hotter than expected headline print was the energy index rose, which climbed 3.0% in January, and we’ve witnessed this first hand in the gasoline price jump of late. Excluding the volatile food and energy components, the “core” CPI index was up 0.3% month over month in January, coming in a bit ahead of the expected 0.2% increase. On a year over year basis, that core figure rose 1.8%, which is in keeping with the 1.7%-1.8% over the last eight months. Month over month gas and fuel prices were up 5.7% and 9.5%, respectively.

Late yesterday, the American Petroleum Institute released data showing a 3.9 million barrel increase in crude stockpiles for the week ended Feb. 9, along with a 4.6 million barrel rise in gasoline stocks and a 1.1 million barrel build in distillates. With crude inventories once again on the rise as US oil production has risen in response to the recent surge in oil prices from September to late January, we’ve seen oil prices retreat to December levels and odds there is more relief to come.

As we wait for others, who if you’ve seen the whipsaw in stock market futures today are simply reacting to the January headline CPI figure, to get some clearer heads about themselves and digest the internals of the report, I’ll share our thoughts on the January Retail Sales report that was also published this morning.

Staring with the headline figure, January Retail Sales came in at -0.3% month over month, falling short of the 0.2% consensus forecast. Excluding auto and food, January core retail sales fell 0.3% month over month; on a year over year basis, retail sales rose 3.9% with nonstore sales leading the way (up 10.2%) followed by gas stations sales (up 9.0% year over year), which is of little surprise given our January CPI conversation above. We do see that nonstore figure as further confirmation for not only our Amazon (AMZN) and United Parcel Service (UPS) shares, but also our Costco Wholesale (COST) ones as it continues to embrace our Connected Society theme.

  • Our price target on Amazon (AMZN) shares remains $1,750
  • Our price target on Costco Wholesale (COST) shares remains $200
  • See my comments below for my latest thoughts on UPS shares


Market’s Knee-Jerk Reaction to January Retail Sales Offered Opportunity in PCAR, Not BGFV

Despite the 3.9% year over year January Retail Sales print, the market is focusing on the month over month drop, which was one of the weakest prints in some time. Here’s the thing, we here at Tematica have been talking about the escalating level of debt that consumers have been taking on as a headwind to consumer spending and despite the post-holiday sales, consumers tend to ramp spending down after the holidays. Odds are these two factors led to that month over month decline, but even so up 3.9% year over year is good EXCEPT for the fact that gas station sales are bound to fall as gas prices decline.

If we look at these two reports, my take on it is a skittish stock market is once again knee-jerk reacting to the headline figures rather than understanding what is really going on. The initial reaction saw Dow stock market futures fall from +150 to -225 or so before rebounding to -125. As data digestion occurs, odds are concerns stoked by the initial reactions will fade as well

With market anxiety still running higher compared to this time last year or even just six months ago, I expect the market to cue off the major economic data points to be had in the coming weeks building to the Fed’s next FOMC meeting on March 20-21. As I pointed out on this week’s podcast, at that meeting we’ll get the Fed’s updated economic forecast and I expect that will have chins wagging over the prospects of three or four rate hikes to be had in 2018.

In the meantime, I’ll continue to look for opportunities like I saw with Paccar (PCAR) shares on Monday, and avoid pitfalls like the one I mentioned yesterday with Big Five Sporting Goods (BGFV). And for those wondering, per the January Retail Sales Report, sporting goods sales 7.1% in January. Ouch! And yes, I always love it when the data confirms my thesis.

  • Our price target on Paccar (PCAR) shares remains $85


Waiting on Applied Materials Earnings Announcement

After today’s market close, Applied Materials (AMAT) will share its latest quarterly results, and update its outlook. As crucial as those figures are, in recent weeks we’ve heard positive things from semi-cap competitors, which strongly suggests Applied should deliver yet another good quarter and a solid outlook. Buried inside those comments, we’ll get a better sense as to the vector and velocity for its products, both for chips as well as display equipment.

Those comments on the display business will also serve as an update for the currently capacity constrained organic light emitting diode market, one that we watch closely given the position in Universal Display (OLED) shares on the Tematica Investing Select List. I see this morning’s announcement by Universal that it successfully extended its agreement with Samsung though year-end 2022 with an optional 2-year extension as reminding investors of Universal’s position in the rapidly growing technology. With adoption poised to expand dramatically in 2018, 2019 and 2020, I continue to see OLED shares as a core Disruptive Technologies investment theme holding.

  • Our price target on Applied Materials (AMAT) shares remains $70
  • Our price target on Universal Display (OLED) shares remains $225


Should We Be Concerned About UPS Amid Amazon Announcement?

Several paragraphs above I mentioned United Parcel Service (UPS) shares, and as one might expect the headline reception to the January Retail Sales Report has them coming under further pressure this morning. That adds to the recent news that our own Amazon (AMZN) would be stepping up its business to business logistics offering and competing with both UPS and FedEx (FDX). Of course, this will take time to unfold, but these days the market shoots first and asks questions later. At the same time, we are entering into a seasonally slower time of year for UPS, and while yes consumers will continue to shift toward digital shopping as we saw in today’s retail sales report, the seasonal leverage to be had from the year-end holidays is now over.


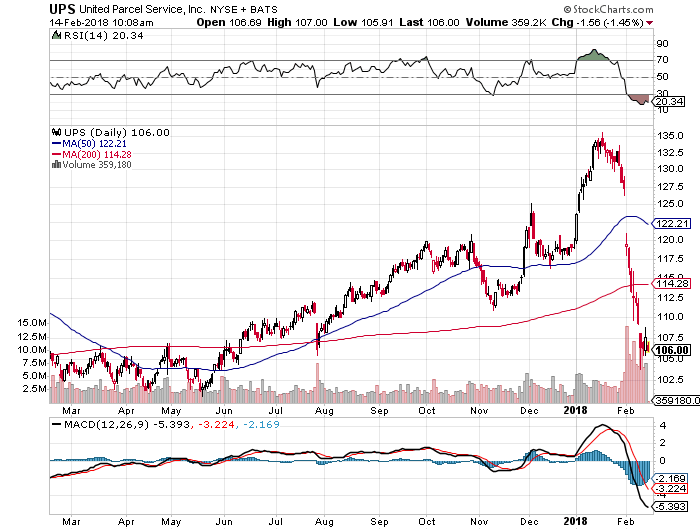
While it may sound like we are getting ready to give UPS shares the ol’ heave ho’, along with the February market gyrations, it’s been a quick ride to the $106 level from $130 for UPS shares, and this has placed them into the oversold category. From a share price perspective, the shares are back to levels last seen BEFORE both the 2017 Back to School and year-end holiday shopping seasons. With prospects for digital shopping to account for an even greater portion of consumer wallets in 2018 and 2019 vs. 2017, we’re going to be patient with UPS shares in the coming months as we wait for the next seasonal shopping surge to hit.

  • Our long-term price target on UPS shares remains $130.


Big Five Sporting Goods is no sporting chance without e-commerce

Big Five Sporting Goods is no sporting chance without e-commerce

You’ve probably noticed that retailers are doing all they can to clear out winter-related items as they prepare for the spring season. It means sales, sales, sales, and in some cases compressed margins. Walk through almost any mall, and you’ll see signs for buy one get one free, buy one get the next one 50% off, and so on.

When we think of spring, most of us tend to think of spring break and the start of spring sports, particularly for school age kids. Why that age? Because they tend to grow, and that means each year new items ranging from athletic shoes, cleats, pants, shirts, jerseys, helmets, and other pieces of athletic wear tend to be bought.

Notice I said usually. In 2017, according to Census Bureau data found in the December Retail Sales Report, sales at sporting goods, hobby, book and music stores were unchanged in the December quarter and fell 3.4% for the year in full. One of those reasons is actually good news for our Amazon (AMZN) shares as non-store retail sales rose 12.7% year over year in December and was up 10% for all of 2017 compared to 2016. The sporting goods category wasn’t the only one to be hit by the shift to digital commerce – for perspective, compared to retail sales (excluding food and auto sales) that rose 4.4% in 2017, digital sales rose nearly 2.3x faster. As we like to say at Tematica, it’s all about connecting the data dots and ahead of Amazon’s December quarter results those retail data points were rather revealing.

The question we have to ponder is whether people are not buying athletic equipment for their kids or, if they are shifting where they buy it — from sporting goods stores like Dick’s Sporting Goods (DKS) to big box retailers like Target (TGT), Walmart (WMT), Costco Wholesale (COST) and discount retailers, as well as online at Amazon (AMZN).

We’re also seeing another factor on the competitive landscape: Foot Locker (FL) and Finish Line (FINL) move to expand from athletic footwear into athletic wear. Those factors led to several sporting good chains, such as Sports Authority, Sports Chalet, MC Sports and others, to file for bankruptcy.


And that brings us to Big 5 Sporting Goods (BGFV)

For those unfamiliar with the company, at the end of 2017 it operated 435 stores in 11 states and offered athletic shoes, apparel and accessories, as well as a broad selection of athletic equipment for team sports, fitness, camping, hunting, fishing, tennis, golf, winter and summer recreation and roller sports. Pretty much a full- service sporting goods store complete with a digital platform as well.

Has Big Five been spared the pain that has been felt in the sporting goods industry?

In a word, no, and we can say this because earlier this month it reported disappointing fourth-quarter 2017 sales that included same-store sales falling 9.4%. Those top line results led the company to revise its bottom line results for the quarter into the red. While some of this can be attributed to mild December temperatures that led to weak demand for cold weather products, the reality is Big Five’s same store sales excluding winter-related and firearm-related products were down low-single digits for the quarter. This tells us that something else is afoot, and odds are it’s the increasingly competitive landscape.

In response to that disappointing fourth-quarter 2017 pre-announcement, Big Five Sporting Goods shares have slumped some 27% since the start of 2018. And this leads us to the obvious question – should we be interested in BGFV shares at current levels?

At the current share price, based on historic multiples and current earnings expectations of $0.55-$0.56 per share last year and this year vs. $0.82 per share in 2016, there’s upside to $6.00-$6.25 per share. Not exactly upside enough to get excited for a business that is being challenged and expected to deliver contracting revenue in the first half of 2018.

Odds are BGFV shares will get cheaper before they get expensive, and while that could make them tempting to some, we’ll take a pass at least until the company’s e-commerce efforts become material to its overall revenue and profit. Based on what I heard on the company’s last earnings call, it’s going to be some time until that happens…if it does…  that means the company is poised to be trapped in the headwind of our Connected Society investing theme. In other words, more pain as Amazon and even Walmart continue to rise the tailwind of that theme to revenue and profits.

TRADE ALERT: Freight pain leads to this Economic Acceleration/Deceleration addition

TRADE ALERT: Freight pain leads to this Economic Acceleration/Deceleration addition


KEY POINTS FROM THIS ALERT:

  • We are issuing a Buy on truck company Paccar (PCAR) with an $85 price target as part of our Economic Acceleration/Deceleration investment theme.

With the market’s volatility over the last several days, a number of stocks are revisiting levels that are 5%, 10%, 15% lower than they stood at end of January. And while investors have been thunderstruck by the market gyrations, the day to day data from the December quarter earnings season as well as recent economic data, has continued to confirm certain opportunities. One of the recurring drum beats this earnings season has been companies ranging from Tyson Foods (TSN, Hershey (HSY), Packaging Corp. of America (PKG), Sysco (SYY) and J.M. Smucker (SJM) to Tractor Supply (TSCO) and Prestige Brands (PBH) talking about rising freight costs and the impact on earnings.

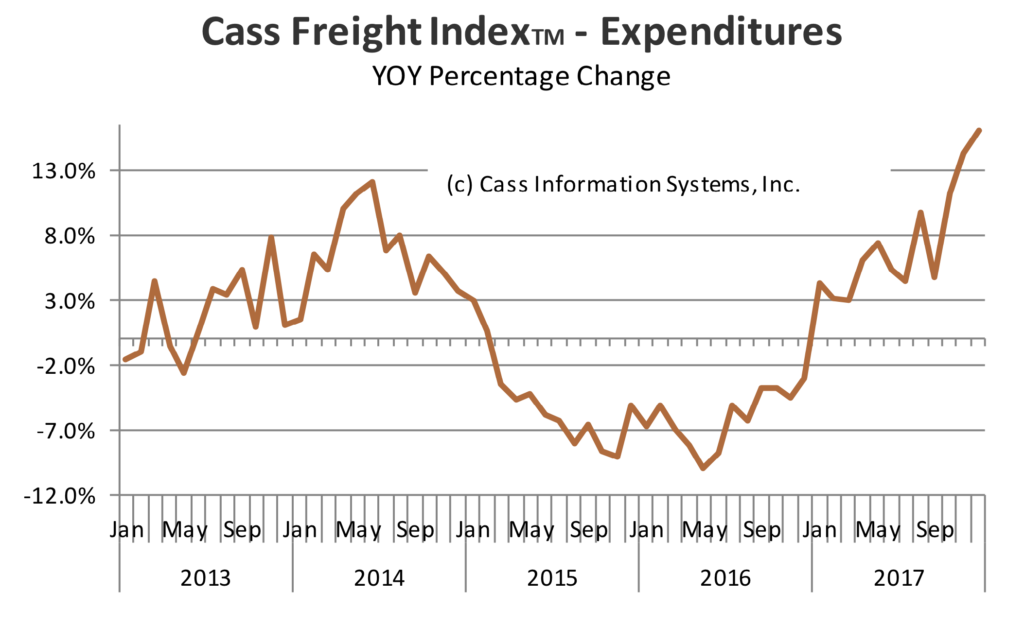
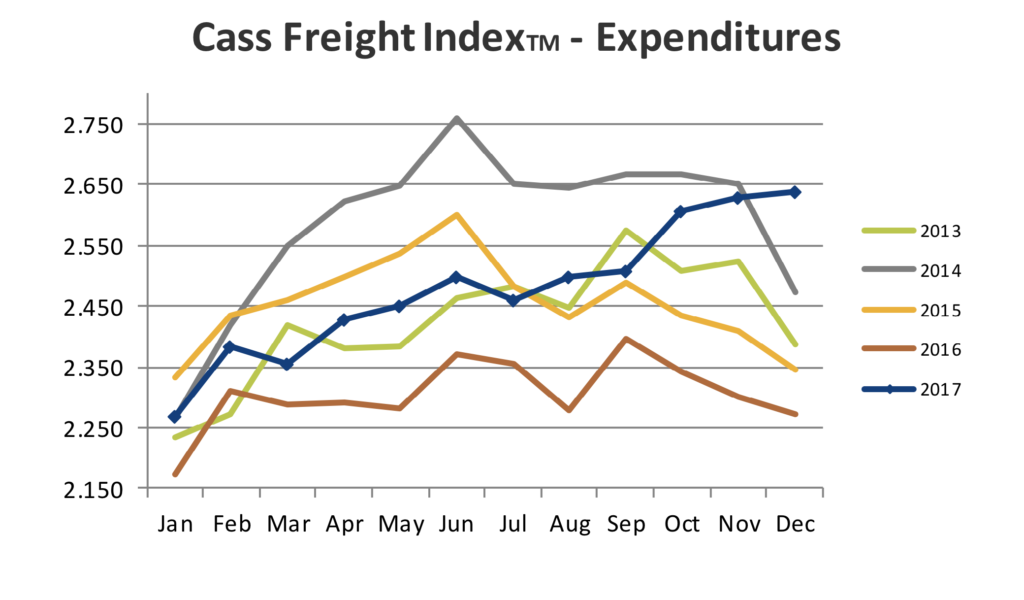
One of the culprits is the national shortage in available trucks, which has sent shipping costs soaring, with retailers and manufacturers in some cases paying over 30% above typical rates to book last-minute transportation for cargo. This, of course, goes hand in hand with the accelerating shift toward digital commerce that we talk about, a shift that led Amazon to correctly assess back in 2013 that as more shoppers bought products online, “parcel volume was growing too rapidly for existing carriers to handle.” As that shift to digital commerce has happened, we’ve seen that forward-looking view come to play out, and odds are it’s only going to get worse. According to Statista, e-commerce sales accounted for 9.1% of total U.S. retail sales in 3Q 2017, but we see that only growing further. In South Korea, e-commerce represented 18% of all retail sales in 2016 with forecasts calling for that percentage to reach 31% by 2021. We may not reach such a level for years to come, but each percentage point that e-commerce gains, means more product that needs to be shipped from a warehouse to the buyer.

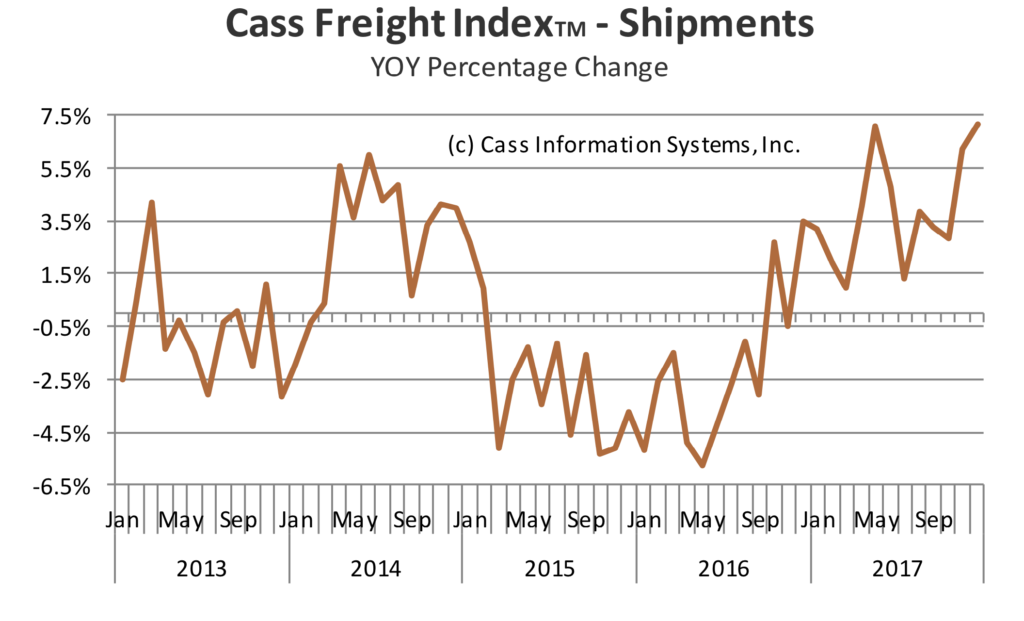
Historically, the trucking industry has been associated with the economic cycle. When the economy is growing, more goods (parts, subassemblies, products) need to be shipped to customers at factories, distribution sites, warehouses and so on. According to the American Trucking Association, the trucking industry accounts for 70.6% of tonnage carried by all modes of domestic freight transportation, including manufactured and retail goods. This has made freight traffic a good barometer of the economy, and the December year over year increase of 7.2% in the Cass Shipments Index capped off a year in which the ATA’s truck tonnage index rose 3.7%, the strongest annual gain since 2013.


As truck tonnage climbed in late 2016 and 2017, industry capacity has been tightening after tepid tonnage in most of 2015 and the first half of 2016 leading to the robust jump in freight costs we described above. This data point from DAT Solutions puts in all into perspective – “there were about 10 loads waiting to be moved for every available truck in the week ending Jan. 20, compared with three in the same week last year…”


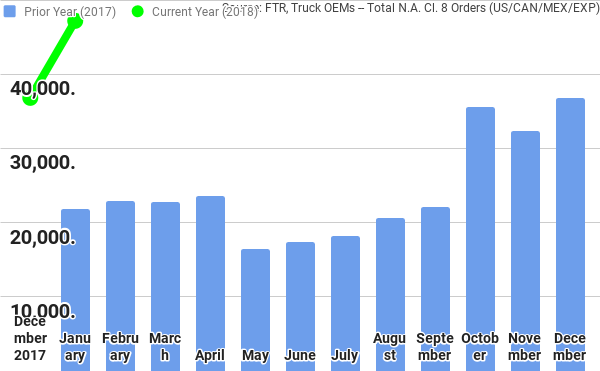
As freight costs climbed in the back half of 2017, so too did heavy truck orders, which have continued to climb into 2018. According to ACT Research, December 2017, which saw a 76% increase in truck order volume was the best month for orders since December 2014. In full, due to the year-end surge, 2017 saw truck orders hit 290,000 units, up 60% year over year. That strength continued into January with monthly truck orders hitting some 47,000 units, the highest level since 2006.


This data is not surprising, given that for the first three weeks of January, national average spot truckload rates were higher than during the peak season in 2017, according to DAT. January was also the fourth consecutive month in which truck orders were above the 30,000 mark. Initial heavy truck forecasts put orders near 300,000 for 2018, however tight industry capacity combined with companies that are benefitting from tax reform and looking to replace older, less fuel-efficient trucks, we could see that some lift to that forecast in the coming months.

But that’s heavy truck orders, and while four months above 30,000 paves the way for a pick-up in business, the real question to focus on is heavy truck retail sales. Heavy truck, otherwise known in the industry as class 8 trucks, industry retail sales were 218,000 units in 2017, compared to 216,000 vehicles sold in 2016, with forecasts calling for 235,000-265,000 trucks to be sold in the U.S. and Canada during 2018.

Looking outside the U.S. and Canada, the data shows an improving European economy and that should give way to a favorable truck market there as well. European truck industry sales above 16-tonnes were a robust 306,000 trucks in 2017, and It is estimated that European truck industry sales in that category will be in the range of 290,000 to 320,000 trucks in 2018.


Paccar – more than a leading heavy truck company

And that brings us to Paccar (PCAR), whose shares have fallen some 15% as the domestic stock market moved sharply lower over the last two weeks. The company is an assembler of heavy-duty trucks, with an estimated market share near 31% in the U.S. and Canada, as well as medium duty trucks (think the kind you see being driven locally by United Parcel Services (UPS) and FedEx (FDX)). That business drove 53% of its truck deliveries in 2017, with the balance coming from Europe (36%) and other markets (11%). As truck retail sales improve in the U.S., Canada and Europe, even absent additional share gains, Paccar’s truck business in terms of revenues and profits should see a nice lift.

The improving truck market also bodes well for Paccar’s high margin truck financing business – while it generated just 6.5% of total revenue in 2017 with operating margins that are more than double the truck business, it accounted for 12% of overall operating profits.

The third leg to the Paccar stool is its Parts business (20% of 2017 revenue, 28% of 2017 operating profit), which stands to benefit from the time lag between truck orders and sales in a capacity constrained industry, where up-time for existing equipment will be crucial.

Given the industry dynamics and Paccar’s position, we are seeing revenue and earnings expectations move higher in recent weeks, with the current consensus calling for EPS of $5.34 this year up from $4.26 in 2017 on a 13% revenue increase to $20.6 billion. With the company only recently sharing its 2018 tax rate will be 23%-25% vs. 31% in 2017, we could see the 2018 consensus move higher in the coming weeks.

As mentioned above, Paccar’s share price has fallen some 15% in the last two weeks, which in our view makes the shares rather compelling given our $85 price target. That target equates to just under 16x 2018 EPS. Over the prior seven years, PCAR shares have bottomed at an average P/E of 12.2x, which derives a downside target of $67.65 based on current 2018 EPS expectations. On the upside, the average peak multiple over those same years of just over 17x hints at a potential price target near $95. Looking at a dividend yield valuation, we see upside vs. downside of $82 vs. $60.

As we add the shares, we’ll split the difference with an $85 price target, and we’ll look to aggressively scale into the shares should the market come under further pressure and drag PCAR shares closer to $60. In terms of sign posts to watch for the shares in the coming days and weeks, monthly heavy truck data as well as tonnage stats and manufacturing industrial production data is what we’ll be watching. As the current earnings season winds on, we’ll be focusing on the results and outlook from Rush Enterprises (RUSHA), which owns the largest network of commercial dealerships in the U.S., with more than 100 dealerships in 21 states.


The bottom line for this alert today:

  • On Monday morning we are adding Paccar (PCAR) shares to the Tematica Investing Select List.
  • Our price target for PCAR shares is $85, nearly 26% above where the shares closed on Friday February 9.
  • At this time we are not setting a protective stop loss, but instead will look to scale further into the shares should further pressure drag them closer to $60 per share. 


WEEKLY ISSUE: The Shakeout from Market Volatility on the Select List

WEEKLY ISSUE: The Shakeout from Market Volatility on the Select List


It’s Wednesday, February 7, and the stock market is coming off one of its wild rides it has seen in the last few days. I shared my thoughts on the what’s and why’s behind that yesterday with subscribers as well as with Charles Payne, the host of Making Money with Charles Payne on Fox Business – if you missed that, you can watch it here.

As investors digest the realization the Fed could boost interest rates more than it has telegraphed – something very different than we’ve experienced in the last several years – the domestic stock market appears to be finding its footing as gains over the last few days are being recouped. Lending a helping hand is the corporate bond market, which, in contrast to the turbulent moves of late in the domestic stock market, signals that credit investors remain comfortable with corporate credit fundamentals, the outlook for earnings and the ability for companies to absorb higher interest rates.

My perspective is this expectation reset for domestic stocks follows a rapid ascent over the last few months, and it’s removed some of the froth from the market as valuations levels have drifted back to earth from the rare air they recently inhabited.


Among Opportunity This New Market Dynamic Brings, There Have Been Casualties

While this offers some new opportunities for both new positions on the Tematica Investing Select List as well as the opportunity to scale into some positions at better prices once the sharp swings in stocks have abated some, it also means there have been some casualties.

We were stopped out of our shares in Cashless Consumption investment theme company, USA Technologies (USAT) when our $7.50 stop loss was triggered yesterday. While the shares snapped back along with the market rally yesterday, we were none the less stopped out, with the overall position returning more than 65% since we added them to the Select List last April. For those keeping track, that compares to the 15.3% return in the S&P 500 at the same time so, yeah, we’re not exactly broken up over things. We will put USAT shares on the Tematica Contender List and look to revisit them after the company reports earnings tomorrow (Thursday, Feb. 8).

That’s the second Select List position to have been stopped out in the last several days. The other was AXT Inc. (AXTI) last week, and as a reminder that position returned almost 27% vs. a 15% move in the S&P 500. Again, not too shabby!

The last week has brought a meaningful dip in shares of Costco Wholesale (COST). On recent episodes of our Cocktail Investing Podcast, Tematica Chief Macro Strategist Lenore Hawkins and I have discussed the lack of pronounced wage gains for nonsupervisory workers (82% of the US workforce) paired with rising credit card and other debt. That combination likely means we haven’t seen the last of the Cash-Strapped Consumer investment theme — of the key thematic tailwinds we see behind Costco’s business. While COST shares are still up more than 15% since being added to the Select List, we see the recent 5% drop in the shares as an opportunity for those who remained on the sidelines before the company reports its quarterly earnings in early March.

  • Our price target on Costco Wholesale (COST) shares remains $200.


Remaining Patient on AMAT, OLED and AAPL

Two other names on the Tematica Investing Select List have fallen hard of late, in part due to the market’s gyrations, but also over lingering Apple (AAPL) and other smartphone-related concerns. We are referring to Disruptive Technologies investment theme companies Applied Materials (AMAT) and Universal Display (OLED). As we shared last week, it increasingly looks that Apple’s smartphone volumes, especially for the higher priced, higher margin iPhone X won’t be cut as hard as had been rumored. Moreover, current chatter suggests Apple will once again introduce three new iPhone models this year, two of which are slated to utilize organic light emitting diode displays.

Odds are iPhone projections will take time to move from chatter to belief to fact. In the meantime, we are seeing other smartphone vendors adopt organic light emitting diode displays, and as we saw at CES 201 TV adoption is going into full swing this year. That ramping demand also bodes for Applied Materials (AMAT), which is also benefitting from capital spending plans in China and elsewhere as chip manufacturers contend with rising demand across a growing array of connected devices and data centers.

  • Our price target on Apple (AAPL) remains $200
  • Our price target on Universal Display (OLED) remains $225
  • Our price target on Applied Materials (AMAT) remains $70


The 5G Network Buildout is Gaining Momentum – Good News for NOK and DY

This past week beleaguered mobile carrier, Sprint (S), threw its hat into the 5G network ring announcing that it will join AT&T (T), Verizon (VZ), and T-Mobile USA (TMUS) in launching a commercial 5G network in 2019. That was news was a solid boost to our Nokia (NOK) shares, which rose 15% last week. The company remains poised to see a pick-up in infrastructure demand as well as IP licensing for 5G technology, and I’ll continue to watch network launch details as well as commentary from Contender List resident Dycom Industries (DY), whose business focuses on the actual construction of such networks.

Several months ago, I shared that we tend to see a pack mentality with the mobile carriers and new technologies – once one makes a move, the others tend to follow rather than risk a customer base that thinks they are behind the curve. In today’s increasingly Connected Society that chews increasingly on data and streaming services, that thought can be a deathblow to a company’s customer count.

  • Our price target on Nokia (NOK) shares remains $8.50
  • I continue to evaluate upgrading Dycom (DY) shares to the Select List, but I am inclined to wait until we pass the winter season given the impact of weather on the company’s construction business.


Disney Offers Some Hope for Its ESPN Unit

Last night Disney (DIS) announced its December quarter results while the overall tone was positive, the stand out item to me was the announcement of the new ESPN streaming service being introduced in the next few months that has a price tag of $4.99 a month. For that, ESPN+ customers will get “thousands” of live events, including pro baseball, hockey and soccer, as well as tennis, boxing, golf and college sports not available on ESPN’s traditional TV networks. Alongside the service, Disney will unveil a new, streamlined version of the ESPN app, which is slated to include greater levels of customization.

In my view, all of this lays the groundwork for Disney’s eventual launch of its own Disney streaming content service in 2019, but it also looks to change the conversation around ESPN proper, a business that continues to lose subscribers. Not surprising, given that Comcast (CMCA) continues to report cable TV subscriber defections. One of the key components to watch will be the shake-out of the rights to stream live games from the major professional leagues — the NFL, Major League Baseball, the NBA. Currently, ESPN is on the hook for about $4 billion a year in rights fees to those three leagues alone — not to mention the rights fees committed to college athletics. Those deals, however, include only the rights to broadcast those games on cable networks or on the ESPN app to customers that can prove they have a cable subscription, not cord-cutters. So the question will be how quick will customers jump on board to pay $5 a month for lower-level games, or will they be able to cut deals with the major professional sports leagues to include some of their games as well.

Nevertheless, I continue to see all of these developments as Disney moving its content business in step with our Connected Society investing theme, which should be an additive element to the Content is King investment theme tailwind Disney continues to ride. With that in mind, we are seeing rave reviews for the next Marvel movie – The Black Panther – that will be released on Feb. 16. The company’s more robust 2018 movie slate kicks off in earnest a few months later.

  • We will continue to be patient investors with Disney, and our price target on the shares remains $125


What to Make of the Recent Market Indigestion

What to Make of the Recent Market Indigestion


Subscribers to our premium research received the below note this morning from our Chief Investment Officer Chris Versace, in which he details his thoughts and insights concerning the market volatility over the past few days. Given its importance — and indigestion we are all no-doubt feeling — we wanted to share it with you as well to provide some context and perspective on what’s happening and why. 


As we all know, yesterday’s market drop saw the Dow Jones Industrial Average fall 1,175 points, marking its worst closing point decline on record. As we like to say, context is key, and that drop of more than 1,100 points, however, equated to a percentage decline of 4.6% — understandably unsettling, but nowhere near as sharp a punch to the gut one would expect by relying on just the absolute point drop. Yesterday’s market action came on the heels of the move lower we saw last week, which ended with a sharp drop on Friday following the market’s reaction to the January 2018 Employment Report.

All told over the last several days, the major domestic stocks market indices have fallen between 7% to 8.5% — quite a drop and easily the worst group of days for the domestic stock market we’ve seen in some time. It’s also erased the gains that were had thus far in 2018. As we look at domestic equity futures this morning, it looks like there is more downside to be had in the very near-term.

For the last several weeks in these posts, as well as in the Monday Morning Kickoff, the Weekly Wrap and in our Cocktail Investing Podcast, we’ve been sharing our view that the market has been increasingly priced to perfection. As it has climbed higher and higher in January, we’ve only seen it stretching a number of valuation metrics even more so along the way. While we along with most others enjoyed the climb higher and the impact it had on our holdings, it became increasingly challenging to put capital to work in new positions given questions over incremental upside to be had.


What’s fueled the market’s move higher through January as well as the months leading up to it?

Contributing to the market’s melt-up have been a combination of improving economic data and expectations for tax reform benefits to be had on corporate bottom lines, as well as a combination of incremental investment spending and capital returns to investors in the form of dividend hikes and share repurchase plans. In recent weeks, investors have received varying degrees of confirmation of those expectations, and the response has been one of the strongest upward revisions for the S&P 500 earnings expectations. Those “adjustments” have led 2018 EPS expectations for the S&P 500 to stand near $155 and $172 for 2019, up from $132.68 in 2017 and $119 in 2016.

Helping propel those upward revisions, analysts and strategists increased their earnings estimates for companies in the S&P 500 for the current quarter, a period that usually sees decreases during the first month of the quarter. Those upward revisions have led the consensus EPS view for the March 2018 quarter to $36.04 (up from $34.36) and compares to $30.84 in the year-ago quarter – all in all, an increase of more than 17% year over year. We’ve only seen year over year first quarter EPS growth expectations rise this much two other times over the last 15 years – in 2004 and 2010. Clearly, expectations are running high.

Let’s add some additional context for the melt up in those earnings expectations —  2018 EPS forecasts derived from the S&P 500 group of companies have risen to $155 from $146 exiting November, while expectations for 2019 rose from $160.50 to the current $172. Much like the stock market move, those expectations have moved pretty far pretty fast leading strategists to boost their price targets for the S&P 500 to 3,000-3,1000 or slightly higher. Some sandbox math shows those targets hinge not on additional multiple expansion, but rather EPS growth. Like we said, expectations are running high.

In many respects it was that positive spiral that led the domestic stock market to melt higher, stretching valuations as we mentioned above, with it becoming increasingly priced to perfection. When we’ve seen the market in states like this, it’s vulnerable to a pullback should something not go as planned. That’s what happened over the last several days as bond yields moved higher.


Inflation & Labor Supply Concerns Only Added Fuel to the Fire

Fueling that steady creep was the growing sense that inflation is poised to move higher, as are borrowing costs, and the January 2018 Jobs Report stoked that flame. That report showed some 200,000 jobs being created during the month with headline wage gains climbing 2.9% year over year. The report also showed an unemployment rate that continued to hover at 4.1%, and this has led some to assert the economy could be a full employment.

Looking at the monthly labor force participation ratio, much like the unemployment rate it has held steady for the last four months at 62.7%. Color us a little skeptical on full employment due in part to the data that showed a decade ago the labor force participation ratio was a 66.2%. Given the aging population, we suspect that few really know what the right labor force participation ratio is, but given the under-saved nature of many retirees, odds are more need to be augmenting their incomes than is reflected in data. That’s a reality that E*Trade made some light of in its Super Bowl ad this year — if you missed it and need to add some levity to your day you can watch it here.

While we contemplate the above, the full employment view has helped fan the flames of inflation fears. The January wage gains, the largest since June 2009, combined with the ongoing claims per the monthly JOLTS that employers can’t find qualified workers has led some to forecast a quicker rise in wages as employers look to recruit the workers they do need.

It’s been some time since we’ve seen the impact of a tight labor force and the ensuing bidding war, but we’d remind readers that for the majority of workers – the 82% that are production employees and nonsupervisory in nature – wages grew relatively tamer, at just 2.4% year over year in January. Still ahead of the Fed’s 2% inflation target, but this tells us the majority of wage gains is concentrated in a smaller group of higher paid workers. Said another way, the view on wage inflation is likely somewhat overstated.

This is coming at a time when economists and analysts are also boosting their price targets for oil as global demand picks up due to the improving nature of the global economy. Over the last four months, we’ve seen those economists and analysts boost their oil forecasts the same number of times, which had the effect of boosting oil price targets by $3 from December to the now current $61 per barrel for Brent Crude. That compares to $54.15 in 2017 and $43.74 in 2016 according to data from the U.S. Energy Information Administration. Odds are you’ve noticed the steady ascent in gas prices when you go to fill up your car or truck over the last few months.

So, we have rising inflation expectations and the growing thought the Fed could raise rates up to four times this year vs. their publicly shared target of three times and the two hikes it put under its belt in 2017. This in itself is a bit of a game changer compared to the last several years when the consensus view is the Fed wouldn’t have the data support to boost rates to the extent they had forecasted.

Added to the mix, the US deficit is expected to grow as a result of tax reform prompting the view the Treasury will need to borrow and borrow heavily. According to the Treasury Borrowing Advisory Committee, the Treasury will need to borrow $955 billion for the current fiscal year that ends in September 2018, up from $519 billion last year. The group goes on to forecast the need for additional borrowings in 2019 near $1.083 trillion and $1.128 trillion in 2020. Yes, that was trillion with a “t” and this is all coming about as the Federal government stares down another potential shut down later this week.

Let’s remember too that in addition to thinking it will boost interest rates, the Fed is also unwinding its balance sheet, which is adding to the supply of treasuries in the market.

Here’s the thing – when it comes to treasuries more supply tends to mean lower prices, which drives yields up and higher yields offer an alternative to US stocks. With the Fed keeping interest rates extremely low over the last decade, it’s been a comparatively low bar for equities to walk over, but as the Fed boosts rates or at least is expected to do so alternatives are emerging. That is something many have contemplated but is now happening.

There is also the simple fact there is better growth to be had outside the US, and that has prompted investors to shift gears, pulling capital from the domestic market and putting it to work in Europe and Japan as the global neighborhood is looking better. According to EPFR Global, as of Jan. 23, $20 billion was withdrawn from US equities since the start of 2018 with $42 billion going into continental European equities and $55 billion in Japanese stocks.

All of this has led to volatility returning, which in and of itself is something new for investors coming to the market for the first time since November 2016.

As we have shared, given the rise in the market over the last several months it has likely has led to “hold your nose and buy anyway” among institutional investors lest they be left behind by the market. Mid-January, the latest Bank of America Merrill Lynch Fund Manager Survey showed fund managers had trimmed their cash allocations to the lowest level in five years and are at a two-year high in allocation to stocks. With little institutional investor cash on the sidelines, who is left to swoop in to buy the pullback over the last week and cushion the blow? Let’s also remember the influx of funds into ETFs over the last several months as those vehicles by definition don’t have a cash component.

This has likely compounded the problem – it’s challenging to say the least to have an orderly market when there are few capable buyers.


Putting it all Together — Where Do We Go From Here?

We are seeing what we and many others have been calling for – a removal of the froth in the stock market that will pull stocks down from nosebleed levels, offering upside to be had for well-positioned companies in return. The substantial move lower in the S&P 500 over the last six trading days has been fast, but so too was the January advance and the rise in the S&P 500 since Oct. 31, 2017.

As we look at the economic data, we do not see a recession imminent, but rather a firming economy that should offer solid footing to a more sanely priced stock market as investors come to grips with the current and near-term market dynamics. The January ISM Manufacturing Index while a tad lower than December’s reading, bested forecasts to come in a 59.1 for the month vs. the expected 58.6. We saw the same with the January ISM Non-Manufacturing Index, which jumped to 59.9 in January, well ahead of the expected 56.7 and up vs. the 56.0 reading in December.

As more data arrives over the coming weeks, we’ll look to the Fed’s March meeting, which will be the first under new Fed Chair Powell and include an updated, multi-year economic forecast. If we see meaningful upward moves in that outlook, the Fed may begin to signal that more than three rate hikes could very well be on the table before year-end. The somewhat good news is the stock market is likely already pricing some likelihood of that fourth hike in.

Indigestion can be unpleasant if not painful as it occurs and that is what we’re seeing with the market now. It tends to pass and with the market at some point equilibrium will be reached as buyers match up with sellers. As we wait for that we’ll be looking at data points to be had to ferret out those companies that are best positioned for what’s ahead and are trading at favorable risk to reward profiles.