Author Archives: Chris Versace, Chief Investment Officer

About Chris Versace, Chief Investment Officer

I'm the Chief Investment Officer of Tematica Research and editor of Tematica Investing newsletter. All of that capitalizes on my near 20 years in the investment industry, nearly all of it breaking down industries and recommending stocks. In that time, I've been ranked an All Star Analyst by Zacks Investment Research and my efforts in analyzing industries, companies and equities have been recognized by both Institutional Investor and Thomson Reuters’ StarMine Monitor. In my travels, I've covered cyclicals, tech and more, which gives me a different vantage point, one that uses not only an ecosystem or food chain perspective, but one that also examines demographics, economics, psychographics and more when formulating my investment views. The question I most often get is "Are you related to…."
More U.S. Households Now Have Netflix Than a DVR… Who Even Has a DVD Player Anymore?

More U.S. Households Now Have Netflix Than a DVR… Who Even Has a DVD Player Anymore?

The power of streaming the content you want, when you want it on the device you prefer is not to be underestimated. It’s been a sea-change in how people consume content, and that has led to a shift in the hardware that people use. With Netflix outstripping digital video recorders (DVRs), we have to question how much longer companies will manufacture those devices, which could be problematic for Tivo, a company that has already been contending with built-in DVR functionality inside digital cable set-top boxes. With Google set to unveil a TV streaming service with DVR functionality in the Cloud, it’s looking more and more like the only streaming hardware we may need will be smartphones, tablets, and smart TVs…. no good for all that cable set-top box subscription fee revenue at Comcast and others. Technology evolution…. a great tailwind for some, and a painful headwind for others.

Netflix has hit a new milestone: More U.S. television households now have the streaming service than a digital video recorder, according to a recent study.

About 54% of U.S. adults said they have Netflix in their household — while 53% have a DVR, according to Leichtman Research Group’s annual on-demand study. It’s the first time that households with Netflix (including those that use shared accounts) have surpassed the level of those with a DVR in the history of LRG’s studies. In 2011, according to the research firm, 44% of TV households had a DVR and 28% had Netflix.

Netflix has now eclipsed DVR usage despite the latter having a years-long head start. TiVo’s first digital video recorder shipped in 1999, while Netflix debuted its video-streaming service in 2007 and started the shift away from its DVD-by-mail business. As of the end of 2016, Netflix had 49.4 million streaming subscribers in the U.S., up 10.5% year over year.

Overall, 64% of respondents said they get a subscription video-on-demand service from Netflix, Amazon Prime Video, and/or Hulu.

Source: More U.S. Households Now Have Netflix Than a DVR | Variety

Walking a Tight Rope as the Fed Faces a Stagflating Economy

Walking a Tight Rope as the Fed Faces a Stagflating Economy

The big question that’s been overhanging the market this week was cleared up yesterday when the Fed announced the next upward move in interest rates, something the stock market has been increasingly expecting over the last several weeks. In looking at the Fed’s new forecasts compared to those issued three months ago, there were no material changes in the outlook for GDP, the Unemployment Rate, on expected inflation.

We find the Fed’s action yesterday rather interesting against that backdrop, especially given its somewhat lousy track record when it comes to timing its rate increases —  more often than not, the Fed tends to raise interest rates at the wrong time. This time around, however, it seems the Fed is somewhat hellbent on getting interest rates back to normalized levels from the artificially low levels they’ve been at for nearly a decade. Even the language with which they announced the rate hike — “In view of realized and expected labor market conditions and inflation, the Committee decided to raise the target range for the federal funds rate to 3/4 to 1 percent” — makes one wonder exactly what data set they are using to base the decision.

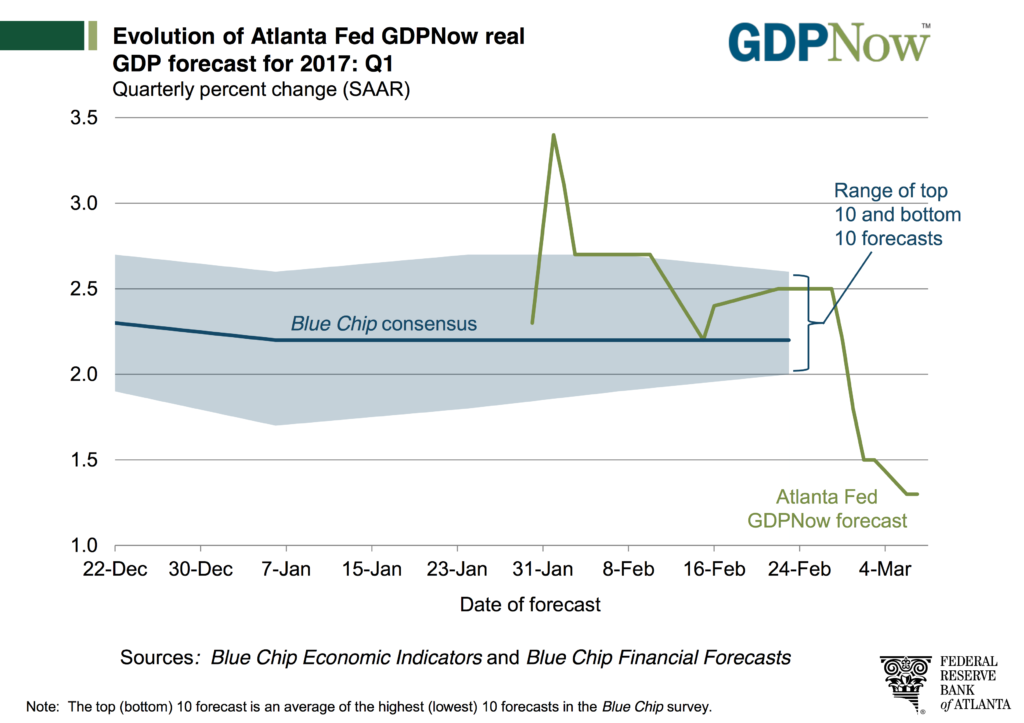
The thing is, recent economic data hasn’t been all that robust. Yesterday morning, the Fed’s own Atlanta Fed once again slashed its GDPNow forecast for 1Q 2016 yesterday to 0.9 percent from 1.2 percent last week and more than 3.0 percent in January. That’s a big downtick from 1.9 percent GDP in 4Q 2016! Given the impact of winter storm Stella, particularly in the Northeast corridor, odds are GDP expectations will once again tick lower as consumer spending and brick & mortar retail sales were both disrupted. As Tematica’s Chief Macro Strategist Lenore Hawkins pointed out yesterday, real average hourly earnings decreased 0.3 percent, seasonally adjusted, year over year in February.

Despite that lack of wage growth, we have seen inflation pick up over the last several months inside the Purchasing Managers’ Indices published by Markit Economics and ISM for both the manufacturing and services economies as well as the Producer Price Index. Year over year in February, the Producer Price Index hit 2.2 percent, marking the largest 12-month increase since March 2012. Turning to the Consumer Price Index, the headline figure rose 2.7 percent this past February compared to a year ago, making it the 15th consecutive month the 12-month change for core CPI was between 2.1 percent and 2.3 percent. We’ve all witnessed the rise in gas prices, up some 18 percent compared to this time last year, and while there are adjustments to strip out food and energy from these inflation metrics, our view at Tematica is food and energy are costs that both businesses and individuals must bear. Rises prices for those items impact one’s ability to spend, especially if wages are not growing in tandem.

It would seem the Fed is caught once again between a rock and a hard place — the economy is slowing and inflation appears to be on the move. The economic term for such an environment is stagflation. In looking to get a handle on stagflation the Fed is walking a thin line between trying to get a handle on inflation while not throwing cold water on the economy as it continues to target two more rate hikes this year.

Once again, we find ourselves rather relieved that we don’t have Fed Chairwoman Janet Yellen’s job. We’re far more content to look at the intersecting and shifting landscapes around us to look for companies positioned to prosper from multi-year thematic tailwinds like those found on the Tematica Select List. Great examples include Buy rated Applied Materials (AMAT), Dycom Industries and Universal Display (OLED) among others. As we do this, we recognize the stock market is out over its ski tips and yet to fully bake in the current and likely near-term economic reality into its thinking especially as the likely timing on potential Trump economic policies look further out than previously thought. This is likely to offer the opportunity to find such thematic beneficiaries at better prices in the coming weeks compared to today.

While we may be a tad ahead of the herd on this, we’ll continue to be prudent investors and let the data, the hard data, talk to us as we navigate our next moves with the Tematica Select List.

Thematic Tailwinds and Headwinds Drive February Retail Sales 

Thematic Tailwinds and Headwinds Drive February Retail Sales 

This morning the US Department of Commerce published its February Retail Sales report, which was in line with expectations growing 0.1 percent compared to January. This report is always an interesting read due in part to the fact that we can look at the data a number of ways — month over month, year over year, and three-month comparisons on a trailing and year over year basis. As you can imagine, this can lead to quite a bit of confusion when trying to puzzle together exactly what the investing signal is coming out of that retail report noise.

Here’s our take on it featuring the thematic lens that we hang our hat at here at Tematica . . .

February 2017 vs. January 2017

Month over month retail sales climbed by 0.1 percent, in line with expectations. The four categories that saw faster spending growth than the average were furniture (+0.7 percent), building materials (+1.8 percent), health & personal care stores (+0.7 percent) and nonstore retailers (+1.2 percent). The sequential increase in building material demand, as well as furniture, fits with the mild winter weather that led to a pickup in construction employment and a stronger than seasonal pickup in housing starts.

The continued tick higher in health & personal care stores ties with our Aging of the Population investing theme. We continue to see this category rising faster than overall retail spending as the first baby boomers turn 70 this year with another 1.5 million each year for the next 15 years. The scary part is of these baby boomers, roughly only 50 percent have saved enough for retirement, which touches on our Cash Strapped Consumer investing theme.

Finally, we once again see Nonstore retailers taking consumer wallet share in February, which comes as no surprise as Amazon and other retailers continue to expand their service offerings and geographic footprints, while other traditional brick & mortar retailers focus on growing their direct to consumer business. In short, our Connected Society investing theme continues to transform retail.

Month over month weakness was had at electronics & appliance stores, clothing, and department stores. Compared to January gasoline station sales ticked down modestly as well, which we attribute to the essentially flat gasoline prices month over month per data from AAA.


February 2017 vs. February 2016

Year over year February Retail Sales excluding autos and food rose 5.9 percent led by a 19.6 percent increase in gasoline station sales, a 13.0 percent increase in Nonstore retail, a 7.3 percent rise in building materials, a 7.0 percent increase at health & personal care stores. Without question, the rise in gasoline station sales reflects the year over year 18 percent increase in gas prices per AAA data, while the milder winter we discussed earlier is likely pulling demand forward in construction and housing — we’ll look for February and March housing data to confirm this. The rise in gas prices reflects OPEC oil production cuts, which serves as a reminder that oil and other energy products are part of our Scarce Resource investing theme — there is only so much to be had, and production levels dictate supply.

As far as the year over year increase in health & personal care goes, it’s the same story — the Aging of the Population as Father Time is a tough customer to beat no matter how people embrace our Fountain of Youth investing theme. Finally, and certainly no surprise is the continued increase in Nonstore retail sales. Candidly, we see no slowdown in this Connected Society shift — all we need to do is look at the evolving shopping habits of the “younger” generation.

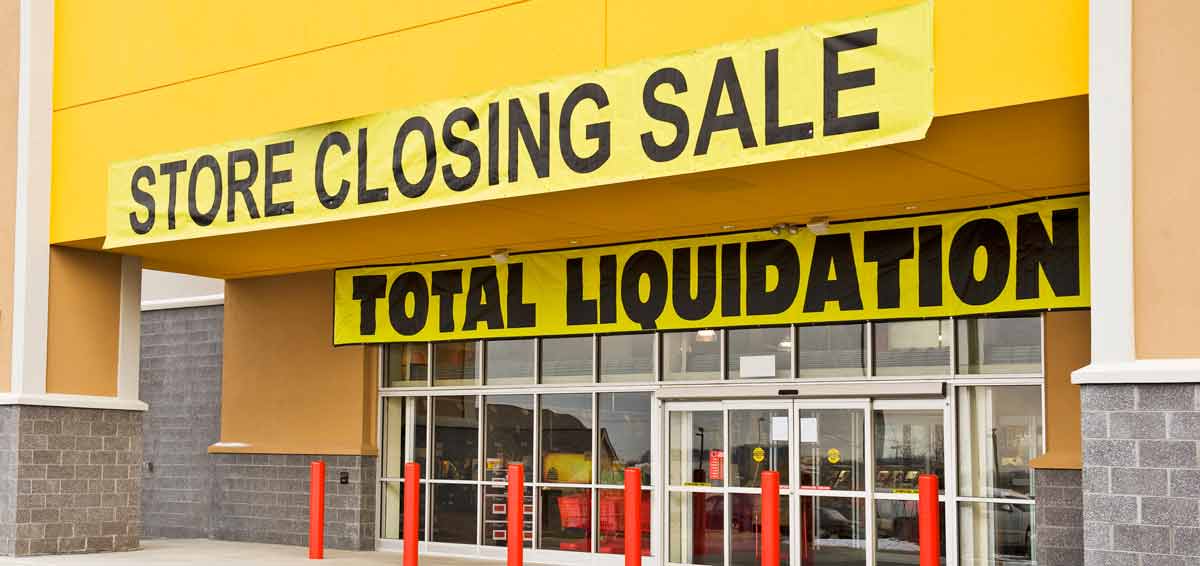
The two big declines were had were…. no surprise….. electronic & appliance stores, which fell 6 percent year over year, and department stores, which dropped 5.6 percent compared to February 2016.  With hhgregg (HGG) closing a good portion of its stores and JC Penney (JCP) recently announcing even more store closures, the results of these two categories, which are likely feeling the heat from Amazon (AMZN) in particular and others benefiting from the Connected Society tailwind, the results from these two categories is anything but surprising.

If we look at the three month rolling average on both a sequential and year over year basis, the leaders remained the same — building materials, gasoline stations, Nonstore retail and health & personal care. Behind each of these there is a clear thematic tailwind, even construction and housing, which is has historically been a beneficiary of the rising aspect of our Rise & Fall of the Middle Class investing theme. We’ll have a better sense of that with tomorrow’s February Housing Starts and Building Permits report.

And just in case anyone was holding out hope for electronics & appliance stores and department stores, the three-month rolling averages showed continued declines on both on a sequential and year over year basis. Nothing like a thematic headwind to throw cold water on your business.

The question to us is whether we will see more M&A chatter like we saw several weeks back with Macy’s (M) and more recently with Hudson Bay (TSE:HBC) being interested in Neiman Marcus. We can understand one company picking off well-positioned assets that might improve its overall customer mix, but we suspect there will be a number of companies left standing with no dance partners when this game of retail musical chairs is over. That means more companies going the way of Wet Seal than not, which means pain for mall REIT companies like Simon Property Group (SPG).

Before we go, we have to mention the piece by Tematica’s Chief Macro Strategist, better known on the Cocktail Investing Podcast as the High Priestess of Global Macro, Lenore Hawkins, which  called out the lack of weekly, year over year wage growth in February. Paired with higher prices, such as gas prices and others, that are leading to a pickup in reported inflation, it tells us our Cash-strapped Consumer investing theme has more room to go.

Hat tip to Lenore Hawkins, who added her special sauce and insights to this viewpoint. 

Note: Tematica’s subscription trading service, Tematica Pro, has a short position in SPG shares. 


Hope and enthusiasm can only carry the market so high for so long

Hope and enthusiasm can only carry the market so high for so long

Waiting for the Fed’s Economic Forecast Update

What a week it’s been! We’ve received a solid February jobs report, endured a March snow storm and late last night even saw another round of would-be news on President Trump’s 2005 tax return. Those two later stories were far less newsworthy than was widely anticipated as Trump paid a 25 percent tax rate and winter storm Stella’s impact wasn’t as extreme as expected, although it did leave trading volumes rather light yesterday. They would have been so regardless, as the market is still in wait-and-see mode as it eyes today’s afternoon announcement from the Federal Reserve on interest rates.

What was once thought of as a long shot, has reversed course and picked up steam with the market now widely anticipating the Fed to modestly boost interest rates. The rate increase is expected even though, as we pointed out in this week’s Monday Morning Kickoff, the Atlanta Fed has done nothing but trim its GDP expectations for 1Q 2017 over the last few weeks. Odds are, today’s latest iteration of that GDPNow report will see a boost up from the dismal 1.2 percent reading owing to the February Employment Report, but it will be hard pressed to break past the 1.9 percent GDP print for 4Q 2016.

Keeping in mind the Fed has a knack for boosting interest rates at the wrong time, and it looks increasingly like Trump’s fiscal policies will take longer than many have expected to take hold and boost the economy, we here at Tematica will continue to tread prudently and cautiously in the near-term.


Hope and enthusiasm can only carry the market so high for so long.

Yes, each week we continue to see confirming data points for our 17 investment themes, which you can see in our Friday missive that is Thematic Signals, but we remain concerned over the market’s stretched valuation and the simple fact that expectations have to catch up with the current economic reality.

Now when many hear talk like that, the first reaction is to get nervous. It’s understandable, but we’re not suggesting a market correction is coming. Even though there are signs the economy has slowed, it is still growing as evidenced by the recent reports from Markit Economics and ISM. Our thinking is that a market pullback — something we define to be in the 3-6 percent range — may not be popular to all the recently returned investors, but it would take, to quote former Fed Chief Alan Greenspan, some of the “irrational exuberance” out of the market. Not a bad thing as it would allow us to revisit some thematic contenders that have moved higher and faster than they probably should over the last four and a half months.

Like Warren Buffett is often quoted saying, “Price is what you pay, value is what you get.”

We couldn’t agree more.

Aside from the now largely expected interest rate increase itself, let’s remember the Fed tends to be very vague in its language and the market has a habit of not really listening to what the Fed is trying to communicate. As the Fed boosts interest rates, we’re likely to get an update on its economic and inflation forecasts in its policy statements and its that language that will either soothe the market or give it some indigestion.


You’ve probably come to the conclusion that it’s best to stand pat for now, and we certainly agree. 

We’ve got a number of positions on the Tematica Select List that are benefitting from pronounced multi-year tailwinds, like Connected Society company Dycom Industries (DY) and the 5G deployment; Disruptive Technology plays Universal Display (OLED) and Applied Materials (AMAT)Aging of the Population and AMN Healthcare (AMN) and the PureFunds ISE Cyber Security ETF (HACK) that is part of our Safety & Security investing theme to name just a few.

Two stocks we will be watching closely are Food with Integrity United Natural Foods (UNFI), which reported good quarterly earnings last week and recently stopped out Costco Wholesale (COST) shares. Both stocks drifted lower last week, with UNFI a tad below the average cost basis of $42.95 on the Tematica Select List and Costco shares breaking through their 50-day moving average at $167.34. When we’ve seen such moves in COST shares previously, it tends to take more than a few weeks for the shares to settle out. Given our Cash-strapped Consumer investing theme and the Costco’s continued expansion, as well as announced membership price hike, that should drive membership-related profits higher.

  • We’ll continue to keep our eyes on COST for an opportunity to jump back in.


Ways to Get Prepared for Future Moves

Be sure to listen to the latest edition of Cocktail Investing, in which Tematica Chief Macro Strategist Lenore Hawkins and I talk with Steve Fredette of Toast, a restaurant technology company at the intersection of the Connected Societyand Asset-lite investment themes. We’ll have another episode out tomorrow that will wrap up all the key market and economic data with a special guest Jack Mohr, who up until recently worked with Jim Cramer — yes that Jim Cramer — managing his Action Alerts Portfolio.

Also be sure to come back to Tematica Investing during the week to see our latest thoughts and comments on the economy, the market and stocks, both in and out of the Tematica Select List.

United Natural Foods Reports In-line Quarterly Results, Still Riding the Fresh & Natural Wave

United Natural Foods Reports In-line Quarterly Results, Still Riding the Fresh & Natural Wave

Last night Food with Integrity company United Natural Foods (UNFI) reported in-line quarterly earnings of $0.50 per share on revenue that rose 11.7% year over year to hit $2.29 billion. Despite that double-digit revenue growth, revenue for the quarter fell short of expectations by $50 million — not a big deal in our view, but we suspect some will look past the double-digit growth and focus on this being the second consecutive quarter where revenue fell just shy of expectations. To us that shortfall is overshadowed by the more than 16% increase in earnings before interest tax & depreciation (EBITDA) and the 12% increase in net income — we always like to see profits growing faster than revenue as it denotes margin expansion.

Given the continued deflationary environment the food and grocery industry is contending with, all in all, we were rather pleased with United Natural’s quarterly results as it continues to benefit from shifting consumers preferences and reap the benefits from cost savings initiatives and synergies with companies acquired in the last year. With those deflationary pressures poised to continue, the company is undertaking another initiative that will shed roughly 265 jobs in the current quarter, with benefits to be had in following ones. This latest effort is expected to result in pre-tax charges of $3.5-$4 million.

Even after this new initiative the company guided 2017 in line with expectations:

  • fiscal 2017 revenue between $9.38-$9.46 billion, an increase of approximately 10.7%-11.7% over fiscal 2016, and consensus expectations of $9.4 billion;
  • adjusted EPS in the range of $2.53 to $2.58 vs. the current consensus forecast of $2.54 per share.

Stepping back, we continue to see consumer shifting preferences to fresh, organic and natural products. Last week, grocery chain Kroger (KR) commented that it continues to “focus on the areas of highest growth like natural and organic products” and we’ve seen companies like Costco Wholesale (COST) continue to expand their fresh and natural offering to boost basket size and shrink time between visits. Against that backdrop that is not occurring at just Kroger and Costco, we continue to like United Natural’s strategy to expand its footprint, including its UNFI Next program that looks for new products and emerging brands and its e-commerce platform.

  • Our price target on UNFI shares remains $60, which offers more than 30% upside from current levels. As such we are keeping our Buy rating intact.


The data tells us that things aren’t exactly headed in the direction of an expanding economy

The data tells us that things aren’t exactly headed in the direction of an expanding economy

The start of March — the last month in the current quarter — started off on a much softer note than January and February, with far more modest gains in the stock market. Call it the calm before the Fed storm, given the next Federal Open Market Committee meeting next week. As we’ve moved closer to the FOMC meeting, the market’s expectations for the Fed to boost rates have climbed, but at the same time, we’ve gotten a number of conflicting data points.

Earlier this week in the Monday Morning Kickoff, we pointed out the weaker than expected January core capital goods orders and shipments, as well as disappointing January personal spending relative to expectations previously. Added to the mix are light vehicle sales data from last week and then the Atlanta Fed cutting its GDPNow forecast for the current quarter to 1.3 percent, down from 1.8 percent on March 1.

Not the direction of an expanding economy, but rather a slowing one, given the latest view that GDP in 4Q 2016 clocked in at 1.9 percent. As we outlined in this week’s Monday Morning Kickoff, there are a growing number of reasons to be cautious and the downward move in GDP expectations is another one, especially given the market’s current valuation.

Another reason for our cautiousness was published by WalletHub this week in a report based on Federal Reserve data that reminds us the Cash-strapped Consumer is alive and well. Per the report, U.S. consumers racked up $89.2 billion in credit card debt during 2016, pushing outstanding balances to $978.9 billion, which is roughly $3 billion below the all-time record set in 2007. Let’s put that into perspective — it equates to the average indebted household owing $8,377 to creditors. Yikes!

WalletHub projects that in 2017 we will surpass the current record by at least $100 billion. Not so good for an economy that has become reliant upon the consumer. This also helps explain why Automotive News reported incentive spending by automakers averaged $3,443 per vehicle in February, up 14 percent from a year ago. Another warning sign.

We’d also add in the growing brouhaha over the efforts to replace the Affordable Care Act, which given the response to the House bill put forth this week, looks to be on a course that is going to be less than smooth sailing. Following the issues surround the Executive Order on immigration, our concern is the market could wake up to the fact that it is going to take more time than expected for President Trump’s fiscal policies, especially tax reform, to ignite the domestic economy.

Given all these issues, it should be obvious why we recently raised a number of our stop loss positions, and we’ll continue to review them on an ongoing basis. Odds are we could see the market pullback in the coming weeks, and our strategy will be to scale into several positions on the Tematica Select List at better prices.


Checking in on Applied Materials and It Looks Good

A few weeks ago we added shares of semiconductor and display capital equipment company Applied Materials (AMAT) to the Tematica Select List as a Disruptive Technology play. As a quick reminder, Applied’s business is benefitting from next generation chip and display technologies that are forcing a ramp in new equipment demand. We’ve talked much about the adoption of organic light emitting diode display that has powered our Universal Display (OLED) shares higher (up nearly 57 percent as of last night’s close), but Applied is also seeing favorable demand signals for its chip equipment business.

Earlier this week, the Semiconductor Industry Association (SIA) reported worldwide sales of semiconductors rose 13.9 percent year over year to $30.6 billion for the month of January 2017. We’d note that January marked the global market’s largest year-to-year growth since November 2010, which to us confirms that chips, not cotton, are the new fabric of our increasingly digital lives.

Strong chip sales mean industry capacity should get tighter and foster additional demand for new industry capacity, and thus orders for Applied’s chip equipment business. We’re seeing tight capacity especially in the global NAND flash storage market, which led to sharp average selling prices in during 4Q 2016 per data from DRAMeXchange. Tight NAND flash supply is expected to persist through 2017 as the industry migrates to 3D NAND technology, which is spurring equipment demand at Applied as Samsung and Toshiba look to increase their output of 3D NAND flash throughout 2017.

  • We continue to rate AMAT shares a Buy with a $47 price target.
  • We continue to rate OLED shares a Buy with a $100 price target.


On Deck – Disney’s Annual Shareholder Meeting

The Walt Disney Company Chairman and CEO Robert Iger. (Photo by Chip Somodevilla/Getty Images)

Later today Content is King company Walt Disney will hold its annual shareholder meeting, and while we don’t expect anything material to emerge, CEO Bob Iger usually offers a pretty good rundown of the upcoming movie slate. As we have seen in the past and again more recently with Frozen, Star Wars and Marvel movies, the films lead to new park attractions and drive its merchandise business. So yes, we will be tuning in to hear what’s said later today.

  • As the company continues to focus on tentpole films that will ripple through its other businesses, we continue to rate Disney a Buy.
  • Our price target remains $125.
A quick reminder on being stopped out on Costco.

Last Friday afternoon we were stopped out of Costco Wholesale (COST) shares on the Tematica Select List when they briefly dipped below our $170 stop loss. Even though it was for the briefest of moments, the $169.90 low for the day means that the protective measure was triggered following quarterly earnings that missed expectations Thursday night.

Recall we sold half the position for a gain of more than 14 percent before dividends, and when paired with the stopping out of the remainder of the position, the blended return before dividends on the Tematica Select was 14 percent vs. a 9.8 percent move in the S&P 500 over the same time frame.

Given the business model dynamics and Costco continuing to benefit from the Cash-strapped Consumer tailwind, we’re inclined to revisit the shares in the coming weeks. The shares have continued to trade-off throughout this week in the $166 to $167 range, but we’re keeping an eye toward getting them back on the Tematica Select List at even better prices.

Post IPO Thoughts on Snap Shares and the $34.7 Billion Market Cap Question

Post IPO Thoughts on Snap Shares and the $34.7 Billion Market Cap Question

Last Thursday, March 2, shares of Snapchat parent Snap Inc. (SNAP) went public at $17, well above the $14-$16 initial public offering range. The shares hit a high of $29.44 on Friday morning before closing the week out at $27.09. That quick gain of just under 60 percent was great for investors that were involved with the IPO, but it wasn’t quite the same for investors that entered into SNAP shares after the shares started trading on Thursday morning.

With SNAP shares now trading in the secondary market and the buildup of the IPO now behind us, the question to us is are SNAP shares really worth the current $34.7 billion in market capitalization? At that market valuation, the shares are trading at about 37 times EMarketer’s estimate for Snap’s 2017 advertising sales. As spelled to out in the S-1 filing, Snap’s Snapchat is free and the company generates revenue “primarily through advertising,” the same was true of Facebook (FB) and Twitter (TWTR).

Actually, that’s not THE question, but rather one of the key questions as we contemplate if there is enough upside to be had in SNAP shares from current levels to warrant a Buy rating? Odds are the IPO underwriters, which include Morgan Stanley (MS), Goldman Sachs (GS), JPMorgan Chase (JPM), and Deutsche Bank (DB), that made a reported $85 million in fees from the transaction, will have some favorable research comments on SNAP shares in the coming weeks.

While SNAP shares fit within the confines of our Connected Society investing theme and are likely to benefit from the shift in advertising dollars to digital and social media platforms like Facebook and Alphabet’s (GOOGL) Google and YouTube, our charge is to question using our thematic 20/20 foresight to see if enough upside in the shares exists to warrant placing them on the Tematica Select List?

Boiling this down, it all comes down to growth

The question when looking at Snap is, “Can it grow its revenue fast enough and deliver positive earnings per share so we can see at least 20 percent upside in the shares?”

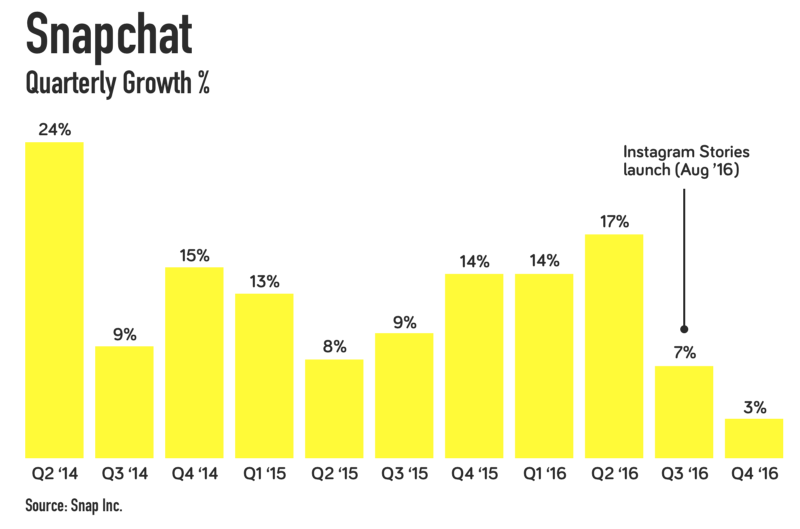
Well, right off the bat the company’s user base of 158 million active daily users was relatively flat in the December quarter and grew just 7 percent between 2Q 2016 and 3Q 2016.  Assuming the company is able to continue to grow its user base, something that has eluded Twitter for the most part, it will still need to capture a disproportionate amount of the mobile advertising market to hit Goldman Sach’s forest that calls for Snap to increase its revenue fivefold by 2018.

Snap recorded $404.5 million in revenue last year, up from $58.7 million in 2015, so a fivefold increase would put 2018 revenue at more than $2 billion. IDC projects that mobile advertising spend will grow nearly 3x from $66 billion in 2016 to $196 billion in 2020, while non-mobile advertising spend will decrease by approximately $15 billion during the same time period.

While a fivefold increase in revenue catches our investing ears, we have to question Snap’s ability to garner such an outsized piece of the mobile advertising market when going head to head with Facebook and its several platforms, Google, Twitter and others. The argument that a rising tide will lift all boats will only go so far when all of those boats are vying for the same position in the monetization river.

There are other reasons to be skeptical, including users migrating to newer social media platforms or ones that have been updated like Facebook’s Instagram that launched Stories to better compete with Snapchat. Snap called this out as a competitive concern in its S-1 filing — “For example, Instagram, a subsidiary of Facebook, recently introduced a “stories” feature that largely mimics our Stories feature and may be directly competitive.” With good reason, because as Instagram Stories reached 150 million daily users in the back half of 2016, Snapchat’s growth in average daily user count slowed substantially. Part of that could be due to Snap’s reliance on the teen demographic, which even the company has noted is not “brand loyal.” We’re not sure anyone has figured out how to model teen fickleness in multi-year revenue forecasts.
 

Making things a tad more complicated is the recent push back on digital advertising by Proctor & Gamble’s (PG) Chief Marketer Marc Pritchard, who publicly expressed his misgivings with today’s digital media practices and, “called on the media buying and selling industry to become transparent in the face of ‘crappy advertising accompanied by even crappier viewing experiences.'” As Pritchard made those and other comments, a survey from the World Federation of Advertisers showed that large brands are reviewing contracts related to almost $3 billion of advertising spend on programmatic advertising, which automates digital ad placement. The question to be answered is whether ads are actually seen and this has led to a call for companies like Snap to follow Facebook, YouTube and have Snapchat’s ad metrics audited by the Media Rating Council.


One other wrinkle in the Snap investing story is the company has yet to turn a profit.

In 2016, while Snap’s revenue was just over $400 million, it managed to generate a loss off $514.6 million and per the S-1 it will need to spend a significant amount to attract new users and fend off competition. In reading that, the concern is user growth could be far slower — and expensive — than analysts are forecasting, which would impact advertising revenue growth like we’ve seen at Twitter. The thing is, new user growth for Snapchat already slowed in the back half of 2016 as newer messaging apps like Charge, Confide and Whisper have come to market.

When Snap finally does turn a profit, we could see the outsized P/E ratio lead value and growth at a reasonable price (GARP) investors to balk at buying the shares, which means Snap will be relying on growth investors. It amazes us how some investors love companies even though they are not generating positive net income, but balk at P/E ratio that is too high the minute they start to generate positive albeit rather small earnings per share. We get around that problem by using a multi-pronged valuation approach to determine upside and downside price targets.


Is Snap the Next GoPro?

While all those numbers and forecasts are important to one’s investment decision making process (we make that point clear in Cocktail Investing: Distilling Everyday Noise into Clear Investment Signals for Better Returns), we have a more primal issue with Snap. Back in late 2015, we shared our view that GoPro (GPRO) was really a feature, not a product. As we said at the time, we saw Yelp (YELP), Angie’s List (ANGI), Groupon (GRPN) and others as features that over time will be incorporated into other products — like Facebook’s Professional Services, those at Amazon (AMZN) or others from Alphabet’s Google, much the way point-and-shoot cameras were overtaken by camera-enabled smartphones and personal information management functions were first incorporated into mobile phones and later smartphones, obviating the need for the original Palm Pilot and other pocket organizers.

When GoPro shares debuted in June 2014, they were a strong performer over the following months until they peaked near $87, but 15 months after going public GPRO shares fell through the IPO price and have remained underwater ever since.

What happened?

We recall hearing plans for a video network of user channels at GoPro as well as the management team touting the company as an “end to end storytelling solution,” but over the last few quarters, we’ve heard far more about new product issues, layoffs, facility closures and falling unit sales.  In 2016, GoPro saw camera unit sell-through fall 12 percent year-over-year to 5.3 million units from approximately 6 million units in 2015.

In our view, what happened can be summed up rather easily — GoPro was and is a feature, not a standalone product. It just took the stock market some time to figure it out once the IPO blitz and glory subsided. While we could be wrong, we have a strong suspicion that Snap is more likely to resemble GoPro than Facebook, which is monetizing multiple platforms as it extends its presence with new solutions deeper into the lives of its users and has changed the way people communicate.

As investors, we at Tematica would much rather own innovators of new products and solutions that are addressing pain points or benefitting from disruptive forces and changing economics, demographics, and psychographics in the marketplace than companies that offer features that will soon be co-opted by other companies and their products. Following that focus on 20/20 foresight, we avoided GoPro shares that fell from $19.50 in December 2015 to the recent share price of $8.84.
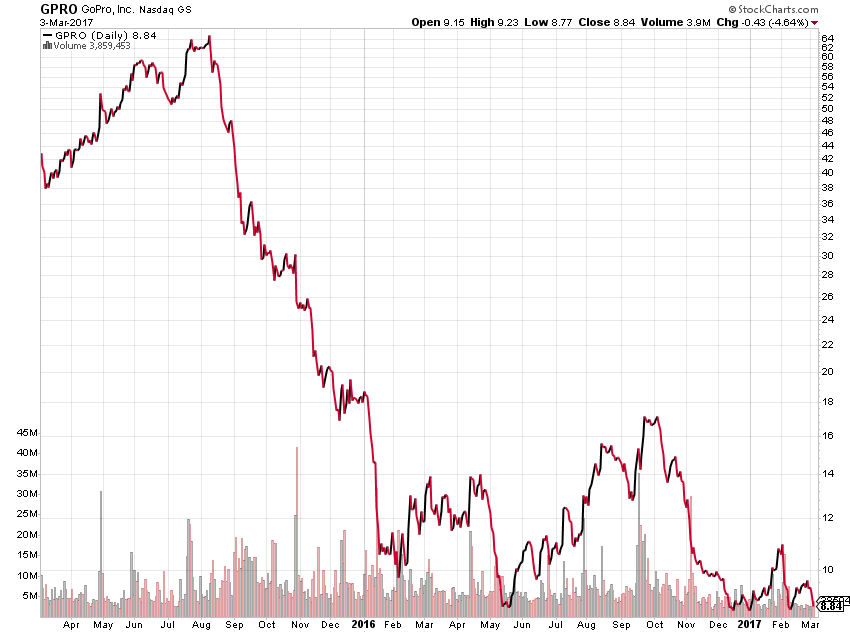
GoPro 2-year Share Price Performance


And then there’s this . . . 

There is another consideration which is not specific to Snap, but is rather an issue that all newly public companies must contend with — the lock-up expiration. For those unfamiliar with it, the lock-up period is a contractual restriction that prevents insiders who are holding a company’s stock, before it goes public, from selling the stock for a period usually between 90 to 180 days after the company goes public. Per Snap’s S-1, its lock-up expiration is 150 days, which puts it in 3Q 2017. Given the potential that insider selling could hit the shares, and be potentially disruptive to the share price, we tend to wait until the lock-up expiration comes and goes before putting the shares under the full Tematica telescope. This isn’t specific to Snap shares, but rather it’s one of our rules of thumb.

We have a strong suspicion that Snap is more likely to resemble GoPro than Facebook, but we’ll keep an open mind during the SNAP shares lock-up period, after all, companies are living entities that can move forward and backward depending on the market environment and leadership team. Let’s remember too that it took Facebook some time to figure out mobile.

Finally, we aren’t so thrilled that none of the 200 million shares floated came with voting rights, leaving the two founders Evan Spiegel and Robert Murphy with total control of the company. We prefer seeing more direct shareholder accountability… but hey, that’s us.


The Market Climbs Higher, But Look at These Two Charts and It’s Ruh-Roh Time

The Market Climbs Higher, But Look at These Two Charts and It’s Ruh-Roh Time

As the stock market continued to get further and further out over its ski tips last week, as investors we have a split mind on the current state of things. On the one hand, we’re certainly enjoying the higher stock prices. On the other hand, we are mindful of the increasingly stretched market valuation. One of the common mistakes see with investors is they all too easily enjoy the gains, but tend not to be mindful of the risks that could wash those gains away.

Over the last few weeks, we here at Tematica have been pointing out the growing disconnect between the stock market’s valuation and the current economic environment. We have a snootful of data points that underscore our cautious stance in this week’s Monday Morning Kickoff, but we wanted to share two charts from our weekend reading that caught our cautious eye.

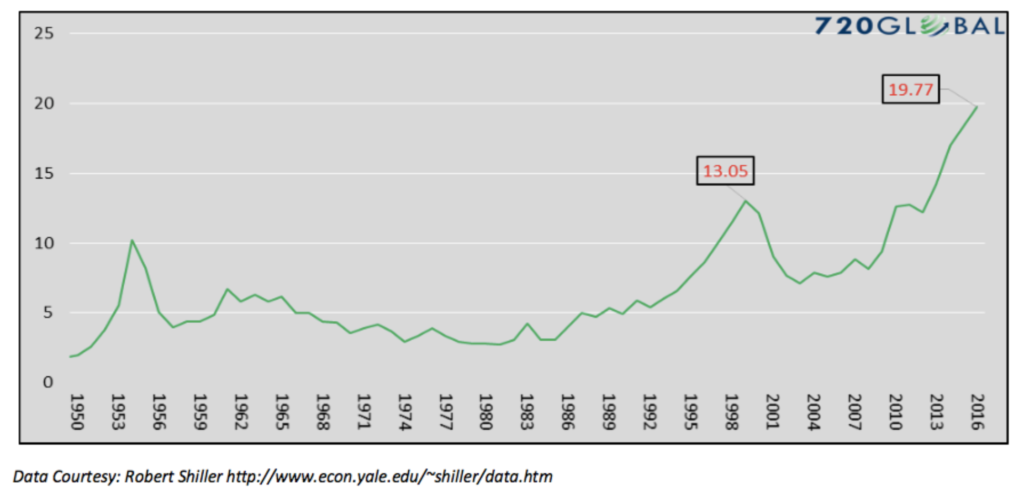
There have been some who call into question the use of Robert Schiller’s Cyclically Adjusted Price to Earnings (CAPE) ratio, but Tematica’s Chief Macro Strategist Lenore Hawkins does a pretty good job handling that criticism. Exiting last week the CAPE to GDP growth of 19.77 has far surpassed the 1999 peak and all points back to at least 1950. As we like to say when looking at data, context and perspective are key to truly understanding what it is we’re looking out. So here’s that context and perspective for the current CAPE to GDP reading —  it is over three times the average for the last 66 years. Going back to 1900, the only time today’s ratio was eclipsed was in 1933 and that reflected the Great Depression when GDP has been running at close to zero for nearly a decade.

Students of CAPE will point out that in order for the CAPE to GDP to fall back to more normalized levels, we either need to see a dramatic increase in GDP (not likely in the near-term) or we need to see a pullback in the CAPE. Here’s the thing, as Michael Lebowitz of 720 Capital points out, “if we assume a generous 3% GDP growth rate, CAPE needs to fall to 18.71 or 35 percent  from current levels to reach its long-term average versus GDP growth.” Based on the data we’re seeing, there is a rather high probability 2017 GDP is more likely to be closer to 2.5 percent than 3.0 percent per The Wall Street Journal’s Economic Forecasting Survey of more than 60 economists, which means to hit normalized levels, the CAPE would need to fall further than 35 percent.

As you ponder that and think on why it has us a tad cautious, here’s more food for thought:


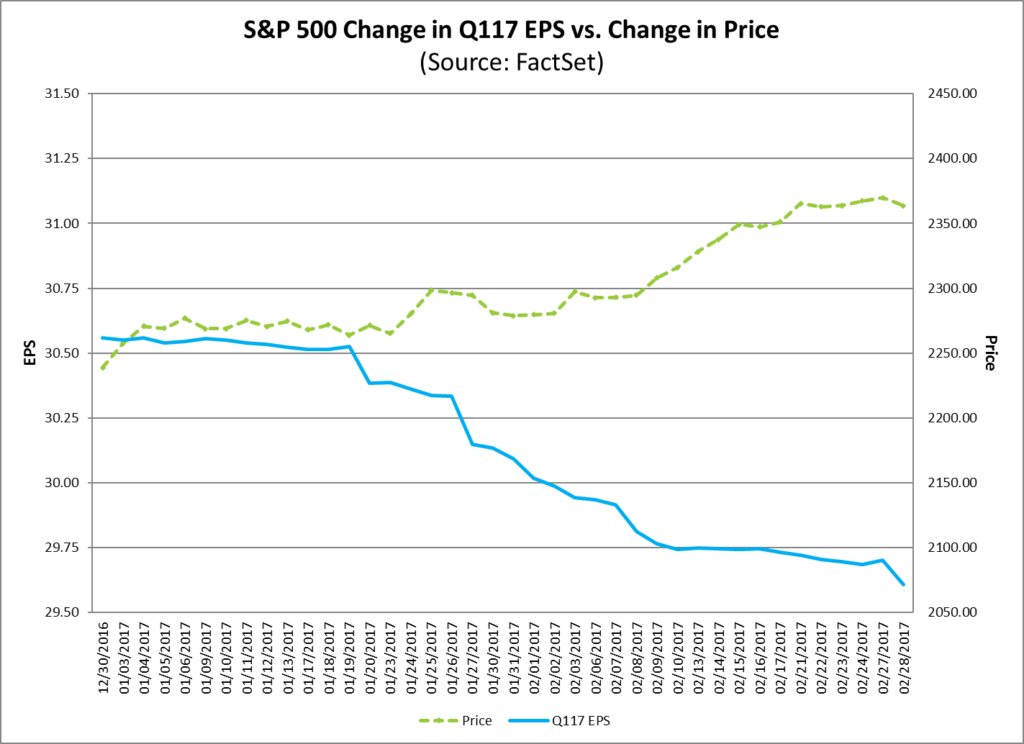
Coming into 2017, forecasts called for the S&P 500 group of companies to grow their collective earnings more than 12 percent year over year, marking one of the strongest years of expected growth in some time. Granted energy companies are likely to be more of a contributor than detractor to earnings growth this year, but we as can be seen by the graph above, earnings expectations for the S&P 500 are already coming down for the current quarter. Those revisions now have year over year EPS growth for the collective at up just over 10 percent.

Are we getting data that shows the current quarter isn’t likely to break out of the low-gear GDP we’ve been seeing for most of the last few years?

Yep.

Are earnings expectations for 2Q-4Q 2017 still calling for 8.5 to 12.5 percent earnings growth year over year?

Yep.

Is it increasingly likely that President Trump’s fiscal policies won’t have a dramatic impact until late 2017 and more likely 2018?

Yep and yep.

The bottom line is we have the stock market melting higher, pulling a Stretch Armstrong-like move in terms of valuation even though earnings expectations for 2017 are starting to get trimmed back.

Yep, you can color us cautious at least for the near-term. While we continue to use our thematic foresight to ferret our companies poised to ride several of our thematic tailwinds, the current market dynamic has us being far more selective.

l

What Now After Being Stopped Out of Costco Shares?

What Now After Being Stopped Out of Costco Shares?

On Friday afternoon we were stopped out of Costco Wholesale (COST) shares on the Tematica Select List when they briefly dipped below our $170 stop loss. Even though it was for the briefest of moments, the $169.90 low for the day means that protective measure was triggered following quarterly earnings that missed expectations Thursday night. Recall we sold half the position for a gain of more than 14 percent before dividends, and when paired with the stopping out of the remainder of the position, the blended return before dividends on the Tematica Select was 14 percent vs. a 9.8 percent move in the S&P 500 over the same time frame.


The Catalyst Behind the Dip in the Share Price

While Costco’s revenue for the quarter was a whisper below expectation, earnings for the quarter were impacted by gross margin pressure primarily due to lower gas profitability vs. a year ago. You’ve probably noticed that gas prices have undergone a large double-digit increase since last year, and even Costco is not immune. In our view, this highlights the company’s thin retail margin structure, which can create earnings volatility from time to time.

While many focused on the earnings miss, we have been far more focused on Costco’s announced membership price increase that will bring its primary membership to $60 from $55 and its Executive Memberships in the US and Canada to $120 from $110. We see those $5 and $10 increases as not egregious, especially when compared to the $100 increase in the annual fee for American Express’s (AXP) Platinum Card that kicks in later this year, and suspect the vast majority of Costco members won’t blink at the price hike.

From an investor perspective, we like the announced price hikes because it translates into higher membership fees, which account for roughly 75 percent of overall operating income and help stabilize quarterly retail margin swings. Paired with more warehouse locations as Costco continues to grow its footprint and as Cash-strapped Consumer turn increasingly to Costco for fresh foods as well as bulk items, we continue to see solid revenue and earnings growth ahead. Exiting its most recent quarter, Costco had 728 warehouses, up from 698 in the year-ago quarter, with plans to add another 29 locations during 2017.

Again, we were stopped out of the position on Friday, but given the business model dynamics and Costco continuing to benefit from the Cash-strapped Consumer tailwind, we’re inclined to revisit the shares in the coming weeks with an eye toward getting them back on the Tematica Select List at better prices.

Costco Shares Fall, But Was It All Bad News For This Cash-Strapped Consumer Play?

Costco Shares Fall, But Was It All Bad News For This Cash-Strapped Consumer Play?

On Friday shares of Costco Wholesale (COST) came under pressure triggered by quarterly earnings that missed expectations Thursday night. While revenue for the quarter was a whisper below expectation, earnings for the quarter were impacted by gross margin pressure primarily due to lower gas profitability vs. a year ago. You’ve probably noticed that gas prices have undergone a large double-digit increase since last year, and even Costco is not immune. In our view, this highlights the company’s thin retail margin structure, which can create earnings volatility from time to time.

We’ve seen such thin margins before when examining brick & mortar retailers across the board from Macy’s (M) and Kohl’s (KSS) to Kroger (KR). It makes for a challenging business, but when it comes to Costco, there’s a key differentiator above and beyond its offering of bulk products.

While many focused on the earnings miss, we have been far more focused on Costco’s announced membership price increase that will bring its primary membership to $60 from $55 and its Executive Memberships in the US and Canada to $120 from $110. We see those $5 and $10 increases as not egregious, especially when compared to the $100 increase in the annual fee for American Express’s (AXP) Platinum Card that kicks in later this year, and we suspect the vast majority of Costco members won’t blink at the price hike.

From an investor perspective, we like the announced price hikes because it translates into higher membership fees, which account for roughly 75 percent of overall operating income and help stabilize quarterly retail margin swings. Paired with more warehouse locations as Costco continues to grow its footprint and as Cash-strapped Consumer turn increasingly to Costco for fresh foods as well as bulk items, we continue to see solid revenue and earnings growth ahead. Exiting its most recent quarter, Costco had 728 warehouses, up from 698 in the year-ago quarter, with plans to add another 29 locations during 2017. More locations with more members paying more in membership fees equal more operating income to be had in the coming quarters. As any student taking Financial Statement Analysis knows, operating income is one of the key determinants of Net Income and EPS generation

Given the business model dynamics and Costco continuing to benefit from the Cash-strapped Consumer tailwind, we’re inclined to revisit the shares in the coming weeks with an eye toward getting them back on the Tematica Select List at better prices.

For those looking for more insight on the bulk product and warehouse club industry, but with a hefty dose of our Connected Society investing theme be sure to check out our most recent podcast where we talk with the CEO of Boxed.