Economic Data Continues to Paint Peaking Picture
This view never gets old.While this was a shortened week with the Memorial Day holiday, it was certainly packed with economic data. Yours truly fell a bit behind coupled with the short week and another one of my trips from Southern California back to my other home base in Italy, so this is a longer than usual post. No matter how many times I do that trip, and my frequent flier miles balance can attest to the level of insanity, I am endlessly amazed at how I can get into a steel tube in one part of the world and end up, after just one tube change in London, roughly 7,000 miles away without much fuss. Hat tip to British Airways for a lovely trip despite the pain felt by tens thousands over the holiday weekend – our thoughts on that calamity were shared on last week’s Cocktail Investing Podcast. The view from 30,000 this week was quite useful given the onslaught of data!
The week started with the Bureau of Economic Analysis inflation report which was in-line with expectations, showing the Personal Consumption Expenditures, price index was up just 1.7 percent on a year-over-year basis.
The Core PCE Price Index, which excludes food and energy, was also lower from prior periods, up just 1.5 percent year-over-year versus an increase of 1.8 percent at the beginning of the year. As we expected and called out a few times, the base effects are wearing off.
Real Personal Consumption Expenditures, which is a measure of consumer spending, weakened on a year-over-year basis, down from 3.1 percent in March to 2.6 percent in April. The peak for these expenditures during the current business cycle was back in January 2015 at 4 percent, which was below the prior business cycle peak of 4.7 percent in February 2004. We see this as confirming our Cash-Strapped Consumer theme remains solidly in the forefront of the economy.
Yes spending has been muted, but more concerning for the longer-term growth potential of the country is the ever-weakening population growth rate. The Bureau of Economic Analysis’ most recent data showed yet another drop in the growth rate to the lowest level on record with the BEA, at 0.7 percent, reinforcing our Aging of the Population theme. Over 600,000 people dropped out of the labor force just last year.
Keep in mind when you hear talk about expanding GDP growth rates that,
There are only two core factors that impact the potential growth of an economy, growth of labor and improvements in productivity.
Shipping looks to be strengthening, which is a good gauge of growth in the overall economy, but remains below longer-term normal levels and is still within the muted growth rate we’ve seen during this business cycle.
The Conference Board measure of Consumer Confidence fell more than expected in May, after having declined in April as well, although overall optimism is still relatively high. The index dropped to 117.9 in May versus expectations for 119.8, down from its peak of 125.6 in March, the highest level since December 2000.
The exceptionally large spread between “soft” sentiment data and the actual hard data has been narrowing, but that has been primarily driven by declining sentiment data.
Housing prices remain strong with the S&P/Case-Shiller Home price index coming in with 5.9 percent annual growth rate versus expectations for 5.7 percent, driven in part by exceptionally low inventories. We’d argue that this is consistent with our Asset-Light investing theme, as Millenials, in particular, show a great affinity for renting homes and using ride-sharing services than owning such assets, particularly those like cars that have inherently low utilization levels.
The US Pending Home Sales number disappointed in April, falling below last year’s levels with a 1.3 percent decline. The National Association of Realtors Existing Home Sales index was 3.3 percent lower this April than in April 2017.
source:
source: tradingeconomics.com
The rate of price increases in homes is well above the annual rate of wage growth, which makes the current pace unsustainable unless we see wages start to catch up. We may just start to see that with the improvement in job creation we saw this week from ADP, with Private Nonfarm payrolls rising 253,000 versus expectations for 180,000. The report saw jobs in construction and professional/business services rise notably, with the later experiencing is the largest one-month increase in around three years.
So things were looking pretty good on the jobs front until Friday’s payroll report from the Bureau of Labor Statistics which came in well below expectations at 138,000 new jobs versus expectations for 185,000. The Labor Force Participation rate dropped from 62.9 percent to 62.7 percent and to add insult to injury, the BLS revised the April job creation numbers down from 211,000 to 174,000.
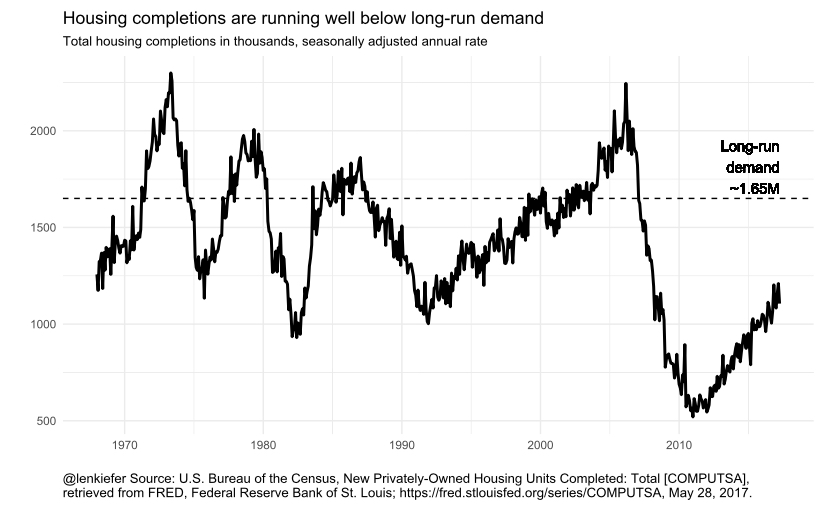
While payrolls in construction rose in the ADP report, the Census Bureau was more in line with the weaker BLS report when it reported a month-over-month decline in US Construction Spending, falling 1.4 percent versus expectations for an increase of 0.5 percent. On a year-over-year basis, spending is up 6.7 percent, with that increase coming from residential, which rose 15.6 percent in April on a year-over-year basis while total public construction spending was down 4.4 percent in April on a year-over-year basis. Residential construction is rising on a year-over-year percent basis, but the overall level is still subdued compared to what we’ve seen in prior business cycles.
Despite weaker inflation data and the weaker jobs report, the CME fed fund futures market is still predicting, with over 90 percent probability, that the Fed will raise rates at the June meeting to a target of between 100 and 125 basis points. The probably of an additional September hike is now below 25 percent. YOU SHOULD SAY WHY YOU AGREE THE FED WILL HIKE EVEN THOUGH THE EMPLOYMENT REPORT WASN’T “GOOD ENOUGH” (OR WAS IT?)
The manufacturing PMI from the Institute for Supply Management (ISM) came in slightly better than expectations, at 54.9 from 54.8 in April versus expectations for 54.5 with New Orders, Employment and Inventories rising versus weaker Production.
source: tradingeconomics.com
source: tradingeconomics.com
However, the Markit survey presents a slightly different picture, with US Manufacturing PMI down to 52.7 in May from 52.8 in April, sitting at the lowest level in 8 months with a moderate improvement in New Business.
source: tradingeconomics.com
source: tradingeconomics.com
Both surveys agreed on falling input prices for manufacturers as inflation looks to be easing across the board. That sound you hear is falling prices, not us patting ourselves on the back for seeing this ahead of the herd.
Auto sales continue to decline in May with sales coming in at the second weakest in the past 26 months, surpassed only by March’s weaker read. Unit volumes are at a roughly 11 percent decline versus Q1, which experienced a 17.5 percent decline.
Bottom Line on the economy is that the data is still mixed, but when we distil it all down, we see an economy that is highly unlikely to accelerate to the upside from here with distinct indications that we are nearing the end of this business cycle. This view is further reinforced when we see President Trump’s approval rating at 40 percent with a disapproval rate at 54 percent. Much hope was based on campaign promises that will be difficult to pass through Congress without support from the other side of the isle, support that is less likely with those kinds of approval ratings given the number of Democrats up for reelection at the mid-term.


