What The Financial News Isn’t Telling You That You Need to Know
Investors as a group are notorious for chasing returns, which means everyone piles into whatever has been working best lately and more often than not tends to be late to the party. The catch this time around is whatever has been working best lately is whatever has gone up in price the most. All this is completely antithetical to the mantra, “Buy low and sell high,” as that requires selling that which was been performing stupendously and buying that which has been getting gut punched like Rocky did my Mister T in the first half of Rocky 3. Imagine hearing that kind of advice on mainstream financial TV!
In our defense, we humans are genetically programmed to buy high and sell low because that’s what you do when you follow the herd and rely on headlines for insight. Remember, our ancestors were the ones that had the good sense to run deep in the crowds when that sabre-toothed tiger got the munchies.
With that in mind, recall that yesterday we talked about how investors have been choosing passively managed funds over active funds at an accelerating rate in a market that has gained more in the past three months, (S&P 500 up 7.6 percent) than in the two years prior to the election, (S&P 500 up 3.3 percent).
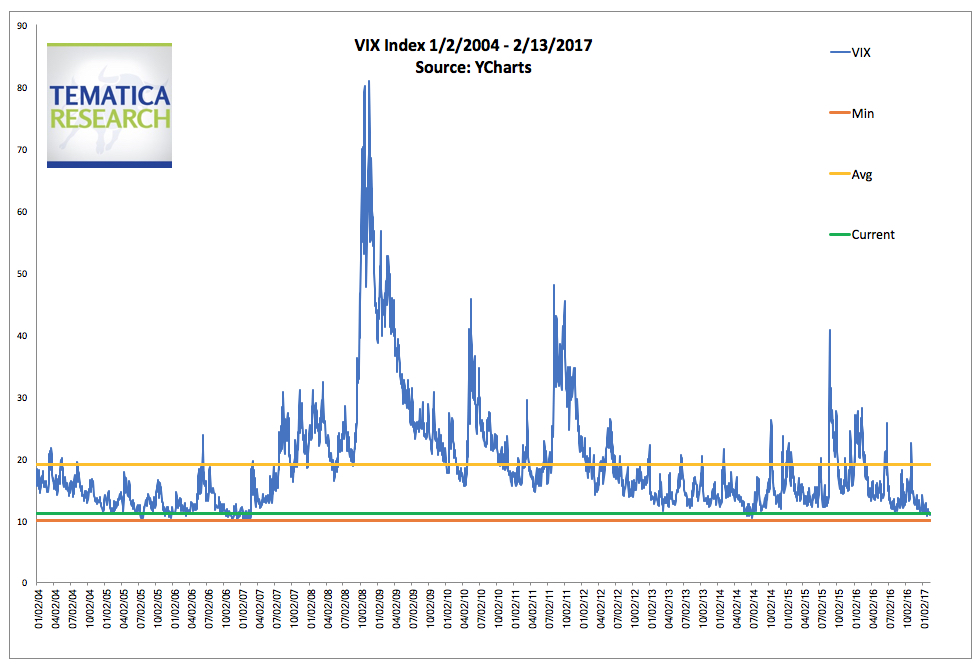
That move up has been oddly calm, with the S&P 500 having moved less than 1 percent intraday now for 40 consecutive trading days. That is the longest streak in at least thirty-five years! As Real Vision Television founder Raoul Pal likes to say, suppressed volatility invariably leads to hyper-volatility. The following chart shows just how low volatility has been relative to historical norms.
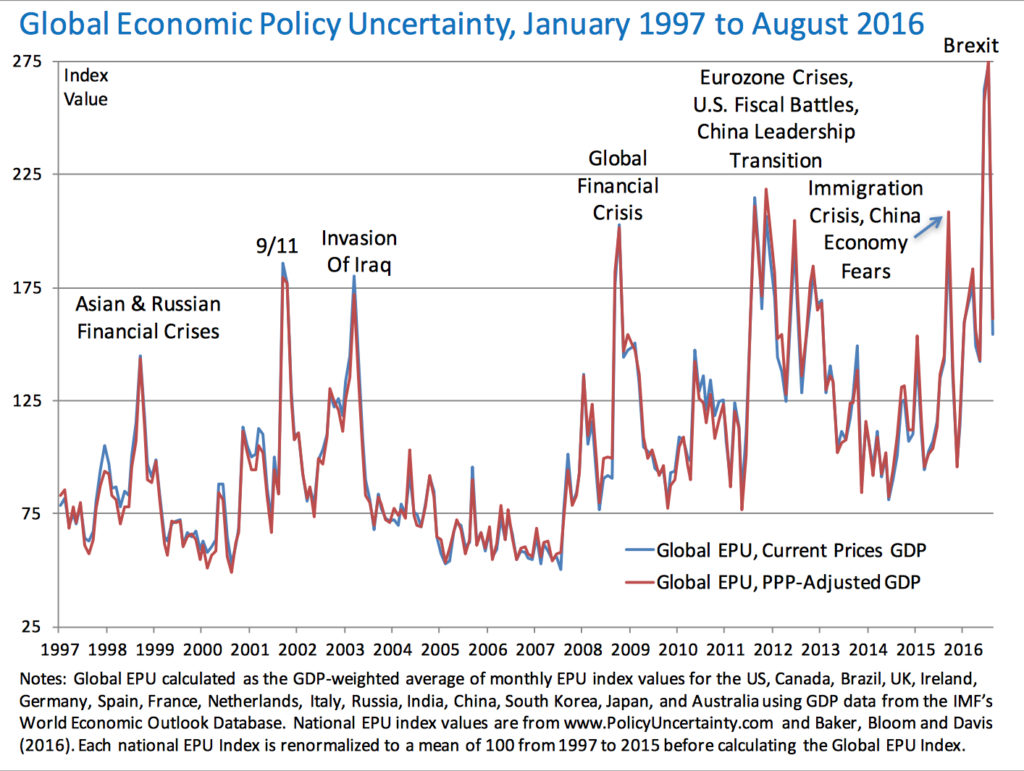
The VIX is currently just slightly above the lowest levels we’ve seen in the past twelve years and is well below the average over that time frame. This stands in stark contrast to the level of global economic policy uncertainty and the current P/E valuation accorded to the S&P 500.
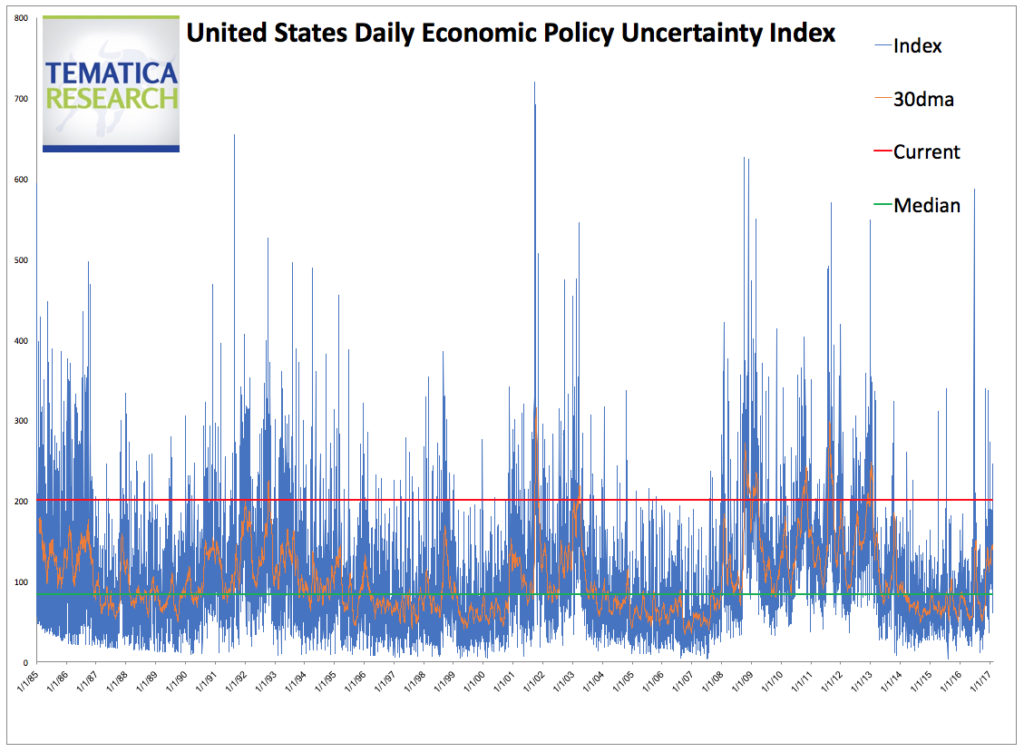
Within just the States, the level of political uncertainty is also well above the median, reaching the 82nd percentile!
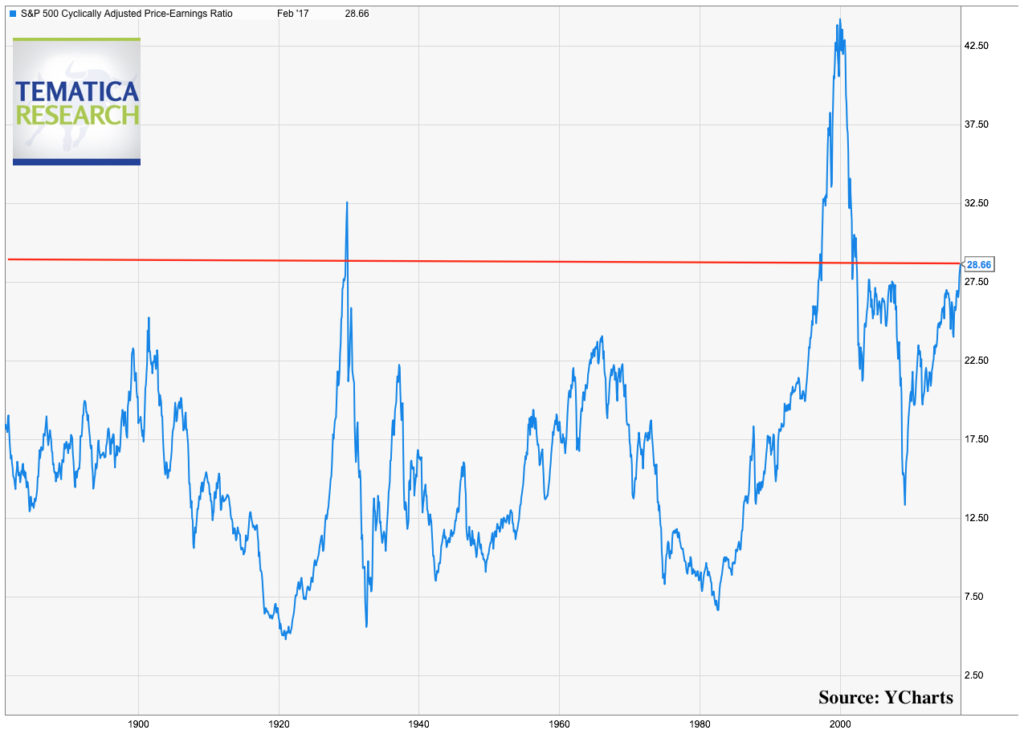
So we have volatility at exceptionally low levels with significantly heightened policy uncertainty both in and outside the U.S., yet stocks are trading at historically very pricey levels according to a wide range of metrics. The chart below shows the S&P 500 Cyclically Adjusted Price-Earnings Ratio (CAPE) going back all the way to 1881. According to this metric, stocks have only seen these levels just prior to the 1929 crash and the dotcom bust.
As of 12/30/2016, (the latest date for which comparative data is available) the U.S. was quite expensive on a relative basis, with a CAPE of 26.4, the third highest in the world, trailing behind Denmark at 33.3 and Ireland at 31.2. The CAPE of the U.S. was trading at a 60% premium over developed Europe and an 89% premium over emerging markets.
If we look at trailing-twelve-month price to cash flow ratio, as of 12/30/2016, the U.S. was trading at a 25% premium to developed Europe and a 41% premium to emerging markets.
If we look at trailing-twelve-month price to sales ratio, as of 12/30/2016, the U.S. was trading at a 73% premium to developed Europe and a 46% premium to emerging markets.
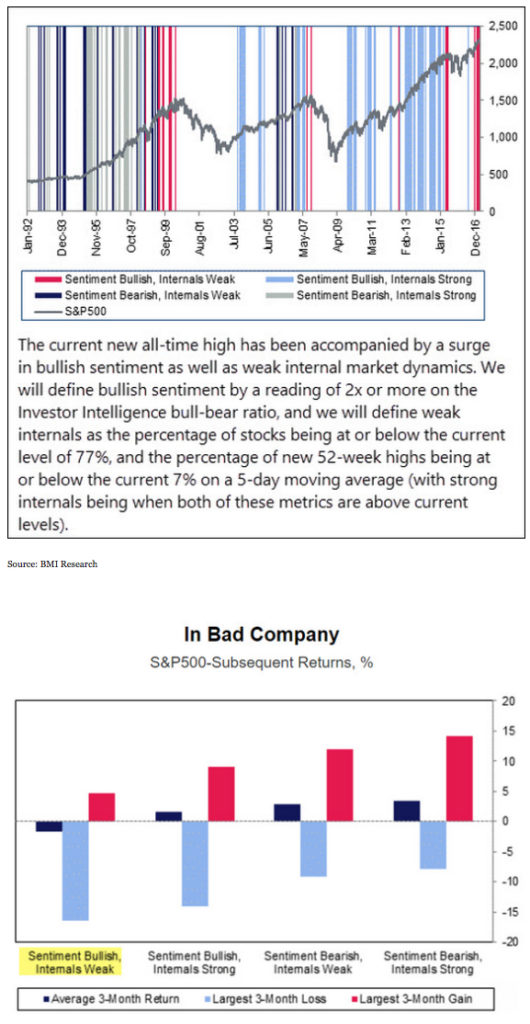
If that doesn’t have you convinced that we are in heady territory, BMI Research recently pointed out that the technicals in the U.S. market are setting up for some seriously unattractive returns over the next three months based on historical norms.
The bottom line is investing is all about probabilities and with stocks in the U.S. at such lofty level with a whole lot of perfection expectation priced in, the downside risk relative to upside potential is something that ought to not be ignored.
So the question is, what could push U.S. equities higher aside from P/E ratios moving further out into the stratosphere? Check back tomorrow for our discussion on just that.


