Weekly Wrap: As Investors Remain Complacent, Insiders are Cashing in Their Shares
Historically volatile September is so far a Steady Eddie as markets regain optimism with calming trade wars. Insiders, however, are selling.
The Markets
Our heart and hopes go out to those affected by Hurricane Florence, which has forced nearly a million people to evacuate their homes. The fear of Flo has pushed shares of Home Depot (HD) and Lowe’s (LOW) up 1.7% and 3.1% respectively this week as of Thursday’s close. Outside of the obvious impact of the storm on home improvement stocks, shares of United Rentals (URI) gained 8.5%, Beacon Roofing Supply (BECN) rose 3.6%, while rental car companies Hertz Global Holdings (HTZ) and Avis Budget Group (CAR) gained 4.8% and 7.8% respectively. On the other end of the spectrum, insurance companies are crying, “Please no Flo” as Allstate (ALL) and Travelers (TRV) fell 2.0% and 2.8% respectively. And as one might suspect, Flo led a number of airlines to preemptively cancel flights, which could weigh on their quarterly results.
For the week in full . . .
The markets closed mixed Monday with the Dow Jones down -0.2% after having gained ground earlier in the trading day while the S&P 500 and Russell 2000 enjoyed slight gains, closing up +0.2% and +0.3% respectively. Volume was particularly light, with the 13thfewest shares traded on Monday for 2018.
The combination of Tuesday’s strong NFIB report and the record-setting JOLTS report, more on them later, on top of last week’s report on rising wages pushed the probability of two Fed rate hikes this year up to nearly 80% on Tuesday, which made for markets that just managed to close in the green, mostly thanks to calming in the trade wars.
In contrast, the Shanghai Composite Index and the Hong Kong’s Hang Seng closed Tuesday at 52-week lows, solidly in bear territory, down -25.1% and -20.3% from their January highs respectively. The MSCI Emerging Market Index is in definite correction, closing down -13% from its January high.
Wednesday the markets were again relatively unchanged, trading in a narrow sideways range, as the trade war tensions eased on the news that the Trump administration is reaching out to China for another round of discussions. The more trade-sensitive shares outperformed such as Boeing (BA) up 2.0%, and Caterpillar (CAT) up 2.6% the overall market, that day.
The US Treasury curve flattened further as the 2-year rose to 2.74%, with the spread between the 10-year and 2-year narrowing to just 21 basis points, near the flattest we’ve seen since 2007.
Thursday the major indices gained ground on word that the Administration’s proposed new round of negotiations with the Chinese could prevent additional tariffs on $200 billion of Chinese imports. Also propping the market higher was the weaker than expected inflation reading in the August Consumer Price Index. That combination led the S&P 500 to gain +0.5% on the day, closing in the green for the fourth consecutive trading day and just one third of a percentage point below its all-time record close.
This week Brent Crude rose about $80 a barrel for the first time since May on news from the Department of Energy that the US experienced a 5.3 million barrel drawdown of crude oil inventories for the week, well above expectations for a 2 million decline. This coupled with Hurricane Florence on top of the sanctions on Iran helped push prices up. OPEC is expected to meet in Algeria later this month with a press conference to follow on September 23rd.
Keep in mind that the US is now the largest crude oil producer globally, outpacing both Russia and Saudi Arabia. Looking at the International Energy Agency’s reduced 2019 US production forecast and reports from Halliburton (HAL) that is it seeing a slower ramp up in capacity than previously expected, the bull market in oil and oil related stocks is likely to continue. However, we are keeping an eye on gasoline stockpiles, which are well above the 5-year range. Despite that stockpile, gas prices per data published by the US’s Energy Information Administration remain up $0.15 per gallon on average, leaving Middle-Class Squeeze consumers feeling a bit of a pinch.
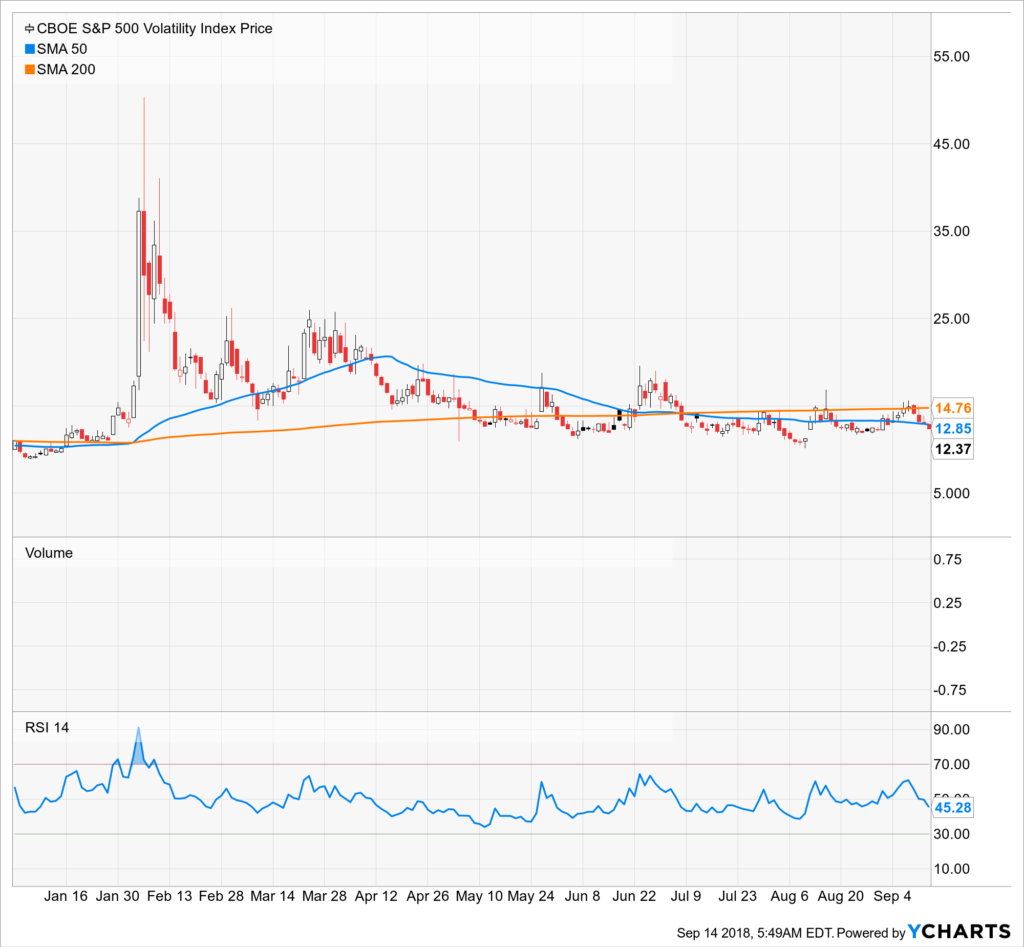
Stock market complacency continue to reign in this market given week the CBOE S&P 500 Volatility Index (VIX) closed Thursday at 12.17, below its 50-day and 200-day moving averages. The S&P 500 has not moved over 1% in either direction in over 50-days now, the longest streak in about 18 months. One area that we are not seeing complacency in, however, is the “C” suite as executive sold over $10 billionof their own stocks holdings in August. Not exactly something that bolsters investor confidence in the stock market given that its valuation is stretched as it is once again dancing near record levels.
The Economy
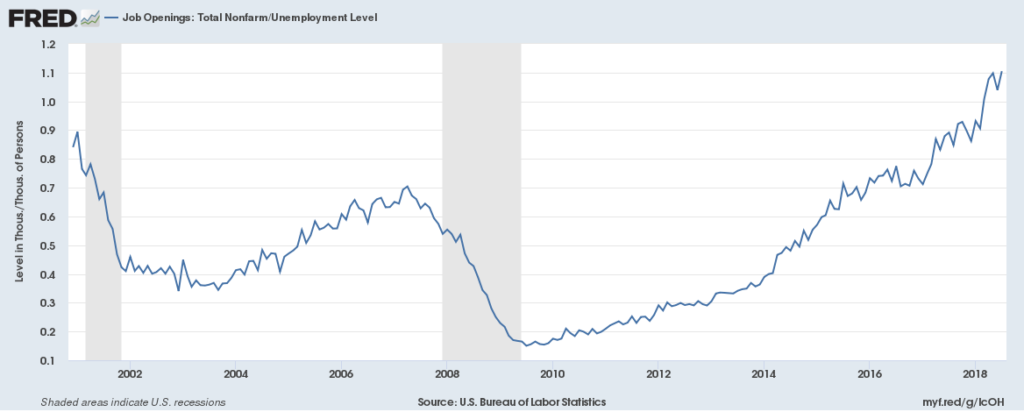
Tuesday’s Job Openings and Labor Turnover Survey (JOLTS) from the Bureau of Labor Statistics revealed more job openings, 6.94 million, than the 6.68 expected, which sent the market into a tizzy (technical term) on fears that this would get the Federal Reserve even hotter for a rate hike. The current level of job openings is astounding with the number of unfilled positions relative to total employment in Manufacturing and Leisure/Hospitality at record highs, a fact that stands in utter contradiction to the political discussion around protecting American jobs. Of course, as we are seeing once again the administration has little problem playing a little fast and loose with reported figures. Manufacturing, Construction, Leisure/Hospitality have also seen the highest increases in job openings in recent months.
Back in March, the number of job openings was greater than the number of folks sitting on the sidelines for the first time since 2001 when the data started being collected. Through July there are now a record 11 job openings for every 10 job hunters. The number of voluntary quits continues to accelerate higher and is now at the highest rate since just before the 2001 recession. The lack of people available to fill jobs is a significant constraint to growth and a tailwind to wage growth. One area that continues at high levels is healthcare, which bodes well for shares of Aging of the Populationcompany AMN Healthcare (AMN) that reside on the Tematica Investing Select List.
On Tuesday the August NFIB Small Business Optimism report saw the index by the same name rise to the highest level in its 45-year history at 108.8, passing the prior September 1983 record of 108.0. The report confirmed the previous JOLTS report from the BLS with a whopping 89% of small business owners finding no or few qualified applicants for their open positions. A record high 25% of small businesses reported the Quality of Labor as their biggest problem. Things have certainly changed. A few years back Taxes and Red Tape were the biggest headaches, but today, combined, they are only slightly more challenging than the Labor situation. While this likely means companies will need to train workers to fill slots, something that can hit margins and productivity, it also means we are staring down a headwind for GDP.
Wednesday the markets got a reprieve from the over-heating data when the Producer Price Index (PPI) fell -0.1% in August versus expectations for a +0.2% gain after being flat in July. This was the first drop for the index in 18 months, dropping the year-over-year rate of increase to +2.8% from 3.3% in July and expectations for 3.2%. Core PPI year-over-year declined to +2.3% versus expectations for +2.7%.
Thursday the Consumer Price Index data was released which like the PPI, came in below expectations for 2.8% year-over-year at 2.7% with core CPI at 2.2% versus expectations for 2.4%. The slowdown may be transitory, but it reduced expectations around rate hikes which in turn weakened the dollar. Rent inflation, which is still near the higher end of the historical spectrum slowed, but new and used car inflation increased. Personal computer prices saw a record increase, a result of the tariffs on Chinese imports.
Friday’s report on August retail sales saw the smallest gain in six months, rising just +0.1% versus expectations for +0.4% and July was revised upwards to +0.7% from +0.5%. If it were for an increase in gas prices, which led to a +1.7% increase in purchases at gas stations, retail sales would have declined in August. The big hit came from car sales, which fell -0.8%. Sales at department stores and outlets also declined. Our Digital Lifestyleinvesting theme was on display again, with internet retail sales a standout of the report, rising +0.7%.
Friday we also learned that US import prices in August experienced their biggest decline since January 2016, falling -0.6%, versus expectations for a -0.2% drop, thanks to the strong dollar. July’s import prices were revised downward as well to -0.1% from unchanged.
The results from recent ZEW surveys of economist reveal they aren’t particularly enthused about the outlook for the global economy with growth expectations for regions at or near the lows. That said, their view of current conditions is pretty sunny, so more concerns that we are peaking. That seems to be the growing view everywhere, and even JPMorgan is now saying we could see the next financial crisis emerge in 2020. Not that I hang my hat as a Contrarian, but this is making me think I need to seriously revisit my analysis as there are entirely too many thinking this way, which usually means something else is likely to happen – as the saying goes the market likes to make fools of the greatest numbers of participants.
The euro area’s industrial production growth contracted year-over-year in August versus expectations for an increase of 1.0% with Italy’s down -1.3% versus expectations for an increase of +1.6%. In the United Kingdom, forward looking economic activity indicators are deteriorating, much around the continued uncertainty and lack of progress around Brexit.
The strength of the dollar continues to vex emerging markets with 28 different EM currencies making new 52-week lows in the past two weeks alone. The number of 52-week lows is around the highest since January of 2016, when there were 42 making new 52-week lows. In August of 2015, there were 70 making new 52-week lows, so there is still plenty of room to move, which means there is likely more pain to be had so we aren’t rushing in yet to find the fire sales. While equity valuations for EM have come down, most markets still remain pricey by historical averages.
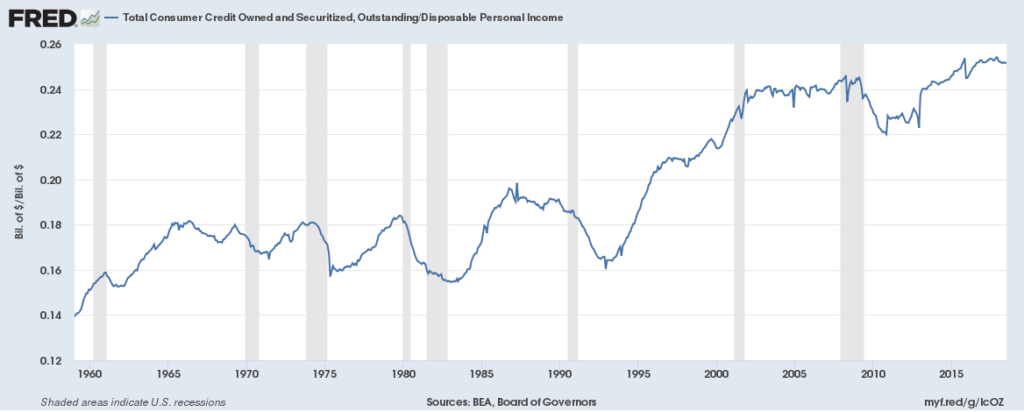
As we look into the future at the inevitable downturn – the business cycle cannot be wished nor voted away – I was pleased to see that consumer credit as a percent of disposable personal income has been declining, although it remains near the highest levels on record.
Total consumer credit rose $16.6 billion in July versus expectations for just $13.9 billion, to a seasonally adjusted $3.91 trillion, a 5.1% annual growth rate. The major source of growth was in nonrevolving credit, which is mostly auto and student loans, (the report does not include mortgages) which rose 6.4% in July after rising 4.0% in June. Such high levels of debt make the household sector, which accounts for roughly 70% of GDP, more vulnerable in an economic downturn, which means GDP is likely to get hit harder thanks to a bigger contraction in consumer spending than would occur with less household debt.
The bad news for housing continues with student debt at a record 30% of total consumer loans. Those student loans are a major headwind to first-time homebuyers. Without the first-time buyer, the trade-up buyer has no one to bid up the price of their first home.
The debt problem isn’t just at the household level as UBS estimates that lower-quality corporate loans and high-yield bonds have risen to a record high $4.3 trillion from $2.4 trillion in 2010. High-yield corporate bonds (aka junk) has risen from $781 billion in 2010 to $1.3 trillion.
But wait, there’s more. The federal deficit in the first 11 months of fiscal 2018 was 32% higher than in 2017 as revenues rose by 1% but spending increased by 7%. This was driven by a 30% decline in corporate income tax receipts and an increase of 4% in individual and payroll tax receipts. Overall the budget deficit increased to $898 billion putting the total debt load to $21.5 trillion. In Q1 total federal debt as a percent of GDP had hit 105%. For those of us who recall the furious debates over the balloon federal debt levels in the early 1980s when this ratio was less than 40%, the utter indifference these days is astounding.
The Bottom Line for the Week
So far September is not living up to its reputation, with steady markets thanks to toned down trade war rhetoric despite much of the economic data coming in weaker than expected. The labor market continues to tighten and elevated levels of consumer credit relative to disposable income remains a material vulnerability for the economy, particularly in light of the growing fiscal deficit and record levels of corporate debt.
Next week we’ll get updates on housing and construction with building permits, existing home sales and home builders index. We’ll also get Markit data on manufacturing and services PMI.


