Category Archives: Middle Class Squeeze

Weekly Issue: While Most Eyes Are on the Fed, We Look at a Farfetch(ed) Idea

Weekly Issue: While Most Eyes Are on the Fed, We Look at a Farfetch(ed) Idea

Key points inside this issue

  • The Fed Takes Center Stage Once Again
  • Farfetch Limited (FTCH) – A fashionable Living the Life Thematic Leader
  • Digital Lifestyle – The August Retail Sales confirms the adoption continues


Economics & Expectations

The Fed Takes Center Stage Once Again

As we saw last week, the primary drivers of the stock market continue to be developments on the U.S.-China trade front and the next steps in monetary policy. As the European Central Bank stepped up its monetary policy loosening, it left some to wonder how much dry powder it had remaining should the global economy slow further and tip into a recession. Amid those concerns, along with some discrepancy among reports that President Trump would acquiesce to a two-step trade deal with China, stocks finished last week with a whimper after rebounding Wednesday and Thursday.

We continue to see intellectual property and national security as key tenets in negotiating a trade deal with China. We will watch as the lead up to October’s next round of trade negotiations unfolds. Given the Fed’s next two-day monetary policy meeting that begins on Tuesday and culminates with the Fed’s announcement and subsequent press conference, barring any new U.S.-China trade developments before then, it’s safe to say what the Fed says will be a key driver of the stock market this week.

Leading up to that next Fed press conference, we will get the August data for Industrial Production and Housing Starts as well as the September Empire State Manufacturing Index. Paired with Friday’s August Retail Sales report and last Thursday’s August CPI report, that will be some of the last data the Fed factors into its policy decision.

Per the CME Group’s FedWatch tool, the market sees an 82% probability for the Fed to cut interest rates by 25 basis points this week with possibly one more rate cut to be had before we exit 2019. Normally speaking, parsing the Fed’s words and Fe Chair Powell’s presser commentary are key to getting inside the central bank’s “head,” and this will be especially important this time around. One of our concerns has been the difference between the economic data and the expectations it is yielding in the stock market. Should the Fed manage to catch the market off guard, odds are it will give the market a touch of agita.

On the earnings front

there are five reports that we’ll be paying close attention to this week. They are Adobe Systems (ADBE), Chewy (CHWY), FedEx (FDX), General Mills (GIS) and Darden Restaurants (DRI). With Adobe, we’ll be examining the rate of growth tied to cloud, an aspect of our Disruptive Innovators investing theme. With Darden we’ll look to see if the performance at its full-service restaurants matches up with the consumer trade-down data being reported by the National Restaurant Association. That data has powered shares of Cleaner Living Thematic Leader and Cleaner Living Index resident Chipotle Mexican Grill (CMG) higher of late, bringing the year to date return to 82% vs. 20% for the S&P 500. Chewy is a Digital Lifestyle company that is focused on the pet market serving up food, toys, medications and other pet products. Fedex will not only offer some confirmation on the digital shopping aspect of our Digital Lifestyle investing theme it will also shed some light on the global economy as well.


Farfetch Limited – A fashionable Living the Life Thematic Leader

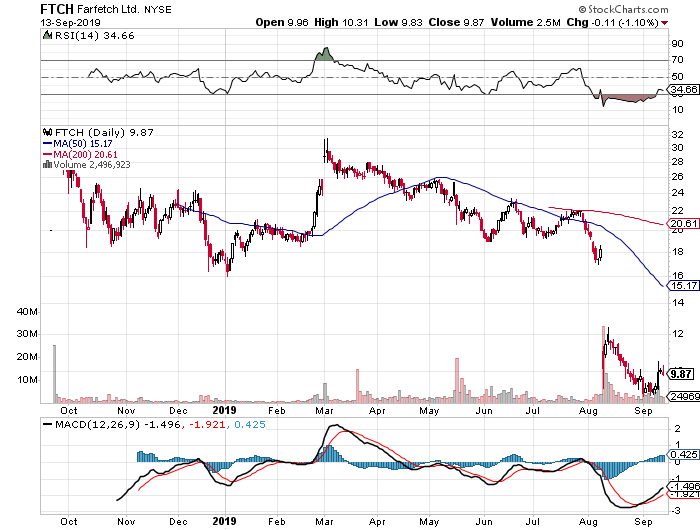
In last week’s issue, I mentioned that I was collecting my thoughts on Farfetch Limited (FTCH), a company that sits at the intersection of the luxury goods market and digital commerce. Said thematically, Farfetch is a company that reflects our Living the Life investment theme, while also benefitting from tailwinds of our Digital Lifestyle theme. Even though the company went public last year, it’s not a household name even though it operates a global luxury digital marketplace. As the shares have fallen over the last several weeks, I’ve had my eyes on them and now is the time to dip our toes in the water by adding FTCH as a Thematic Leader.


Farfetch Provides Digital Shopping to the Exploding Global Luxury Market

Farfetch is a play on the global $100 billion online luxury market with access to over 3,200 different brands across more than 1,100 brand boutique partners across its platform. With both high-end and every-day consumers continuing to shift their shopping to online and mobile platforms, we see Farfetch attacking a growing market that also has the combined benefit of appealing to the aspirational shopper and being relatively inelastic compared to mainstream apparel.

Part of what is fueling the global demand for luxury and aspirational goods is the rising disposable income of consumers in Asia, particularly China. According to Hurun’s report, The Chinese Luxury Traveler, enthusiasm for overseas travel shows no signs of abating, with the proportion of time spent on overseas tourism among luxury travelers increasing 5% to become 70% of the total. Cosmetics, (45%), local specialties (43%), luggage (39%), clothing and accessories (37%) and jewelry (34%) remain the most sought — after items among luxury travelers. High domestic import duties and concerns about fake products contribute to the popularity of shopping abroad.

It should come as little surprise then that roughly 31% of FarFetch’s 2018 revenue was derived from Asia-Pacific with the balance split between Europe, Middle East & Africa (40%) and the Americas (29%). At the end of the June 2019 quarter, the company had 1.77 million active customers, up from 1.35 million exiting 2018 and 0.9 million in 2017. As the number of active users has grown so too has Farfetch’s revenue, which hit $718 million over the 12 months ending June 2019 compared to $602 million in all of 2018 and $386 million in 2017.

Farfetch primarily monetizes its platform by serving as a commercial intermediary between sellers and end consumers and earns a commission for this service. That revenue stream also includes fees charged to sellers for other activities, such as packaging, credit-card processing, and other transaction processing activities. That business accounts for 80%-85% of Farfetch’s overall revenue with the balance derived from Platform Fulfillment Revenue and to a small extent In-Store Revenue.

New Acquisition Transformed Farfetch’s Revenue Mix 

In August, Farfetch announced the acquisition of New Guards Group, the Milan-based parent company of Off-White, Heron Preston and Palm Angels, in a deal valued at $675 million. New Guards will serve as the basis for a new business segment at Farfetch, one that it has named Brand Platform. Brand Platform will allow Farfetch to leverage New Guards’ design and product capabilities to expand the reach of its brands as well as develop new brands that span the Farfetch platform. For the 12-month period ending April 2019, the New Guards portfolio delivered revenue of $345 million, with profits before tax of $95 million. By comparison, Farfetch posted $654 million in revenue and an operating loss of $183 million over that time frame.

Clearly, another part of the thought behind acquiring New Guards and building the Brand Platform business is to improve the company’s margin and profit profile. And on the housekeeping front, the $675 million paid for New Guards will be equally split between cash and stock. Following its IPO last year, Farfetch ended the June quarter with roughly $1 billion in cash and equivalents on its balance sheet.

In many ways what we have here is a baby Amazon (AMZN) that is focused on luxury goods. Ah, the evolution of digital shopping! And while there are a number of publicly traded companies tied to digital shopping, there are few that focus solely on luxury goods.

Why Now is the Time to Add FTCH Shares

We are heading into the company’s seasonally strongest time of year, the holiday shopping season, and over the last few years, the December quarter has accounted for almost 35% of Farfetch’s annual sales. With the company’s active user base continuing to grow by leaps and bounds, that historical pattern is likely to repeat itself. Current consensus expectations have Farfetch hitting $964 million in revenue for all of 2019 and then $1.4 billion in 2020.

At the current share price, FTCH shares are trading at 1.6x expected 2020 sales on an enterprise value-to-sales basis. The consensus price target among the 10 Wall Street analysts that cover the stock is $22, which equates to an EV/2020 sales multiple of near 3.5x when adjusting for the pending New Guards acquisition. As we move through this valuation exercise, we have to factor into our thinking that Farfetch is not expected to become EBITDA positive until 2021. In our view, that warrants a bit of haircut on the multiple side and utilizing an EV/2020 sale multiple of 2.5x derives our $16 price target.

  • Despite that multiple, there is roughly 60% potential upside to that target vs. downside to the 52-week low of $8.82.
  • We are adding FTCH shares to the Thematic Leaders for our Living the Life investing theme.
  • A $16 price target is being set and we will wait to put any sort of stop-loss floor in place.


Digital Lifestyle – The August Retail Sales confirms the adoption continues

One of last week’s key economic reports was the August Retail Sales report due in part to the simple fact the consumer directly or indirectly accounts for two-thirds of the domestic economy. Moreover, with the manufacturing and industrial facing data – both economic and other third-party kinds, such as truck tonnage, railcar loadings and the like – softening in the June quarter, that quarter’s positive GDP print hinged entirely on the consumer. With domestic manufacturing and industrial data weakening further in July and August, the looming question being asked by many an investor is whether the consumer can keep the economy chugging along?

In recent months, I’ve voiced growing concerns over the spending health of the consumer as more data suggests a strengthening tailwind for our Middle-Class Squeeze investing theme. Some of that includes the Federal Reserve Bank of New York’s latest Household Debt and Credit Report, consumer household debt balances have been on the rise for five years and quarterly increases continue on a consecutive basis, bringing the second quarter 2019 total to $192 billion. Also a growing number of banks are warning over rising credit card delinquencies even as the Federal Reserve’s July Consumer Credit data showed revolving credit expanded at its fastest pace since November 2017.

Getting back to the August Retail Sale report, the headline print was a tad better than expected, however once we removed auto sales, retail sales for the month were flat. That’s on a sequential basis, but when viewed on a year over year one, retail sales excluding autos rose 3.5% year over year. That brought the year over year comparison for the three-months ending with August to up 3.4% and 1.5% stronger than the three months ending in May on the same basis.

Again, perspective can be illuminating when looking at the data, but what really shined during the month of August was digital shopping, which rose 16.0% year over year. That continued strength following the expected July surge in digital shopping due to Amazon Prime Day and all the others that looked to cash in on it led year over year digital shopping sales to rise 15.0% for the three months ending in August.

Without question, this aspect of our Digital Lifestyle investing theme continues to take consumer wallet share, primarily at the expense of brick & mortar retailers, especially department stores, which saw their August retail sales fall 5.4%. That continues the pain felt by department stores and helps explain why more than 7,000 brick & mortar locations have shuttered their doors thus far in 2019. Odds are there is more of that to come as consumers continue to shift their dollar purchase volume to online and mobile shopping as Walmart (WMT), Target (TGT) and others look to compete with Amazon Prime’s one day delivery.

  • For all the reasons discussed above, Amazon remains our Thematic King as we head into the seasonally strong holiday shopping season. 


Keys to July Retail Sales and Walmart Earnings Results

Keys to July Retail Sales and Walmart Earnings Results


Plus the Biggest Threat to the German Auto Industry

On this episode of the Thematic Signals podcast, we’re digging into the July Retail Sales and quarterly earnings results from Walmart as both confirm the hard-blowing tailwinds associated with our Digital Lifestyle, Middle-Class Squeeze, Aging of the Population and Cleaner Living Investing themes.


We also breakdown a recent article in The Wall Street Journalthat discusses how one aspect of our Cleaner Living investing theme — electric vehicles — could threaten the German economy. It’s the same structural shift that should have folks more than a little concerned about Tesla, both its business as well as its shares. All that and much more on this episode of the podcast. 

Have a topic or a conversation you think we should tackle on the podcast, email me at cversace@tematicaresearch.com

And don’t forget to subscribe to the Thematic Signals Podcast on iTunes!

Resources for this podcast:

WEEKLY ISSUE: Mismatched Economic Data, Earnings and the Fed

WEEKLY ISSUE: Mismatched Economic Data, Earnings and the Fed

Key points inside this issue

  • Did you notice the June quarter GDP depended on the consumer?
  • Earnings, earnings, earnings and what it may mean for the market
  • Waiting on the Fed and what Powell says about what’s ahead

Did you notice the June quarter GDP depended on the consumer?

While last week’s corporate earnings included the usual mix of better-than-expected and weaker-than-expected results, we also saw mismatched economic data. The IHS Markit July Flash US manufacturing index hit a reading of 50.0, while the initial second-quarter GDP print came in warmer than anticipated at 2.1% vs. expectations for 1.8% – 2.0% it was down from 3.1% in the first quarter. Parsing the GDP data, the quarter was all about the consumer, with personal consumption expenditures rising 4.3% (annual rate), the strongest performance in six quarters.

Given rising debt levels, I continue to have concerns over the consumer’s ability to spend at such a vigorous rate given rising debt levels. We’ve seen rising delinquency rates reported by American Express (AXP)and Capital One Financial Corp (COF). If you’re thinking this meshes with our Middle-Class Squeeze investing theme that has propelled the shares of Middle-Class Squeeze Leader Costco Wholesale (COST) by more than 37% this year (head and shoulders above all the major market indices), you would be right.  And the fact that personal consumer expenditures contributed 2.85 percentage points to the initial GDP print of 2.1% isn’t lost on us here at Tematica.

The upcoming economic data will be critical to assessing the vector and velocity of the domestic economy, in part because it will tell us if the consumer is able to sustain the economy at a time when it relies most on him and her – the year-end shopping season.  In the very near term, however, the market will be fixated on the Fed and the degree to which it uses monetary policy to attempt a “Goldilocks” move for the U.S. economy. Once we are past today’s expected Fed rate cut, odds are investor will get back to business breaking down economic and other data. We hear at Tematica will continue to do that as well as ferret out the latest signals for our investing themes.

Earnings, earnings, earnings and what it may mean for the market

Coming into this week, 220 or 44% of the S&P 500 group of companies had reported their earnings for the second calendar quarter, and among those more than 1,050 reports coming at us this week will be another 168 S&P 500 companies. When the stock market closes on out this week, 78% of the S&P 500 will have reported.

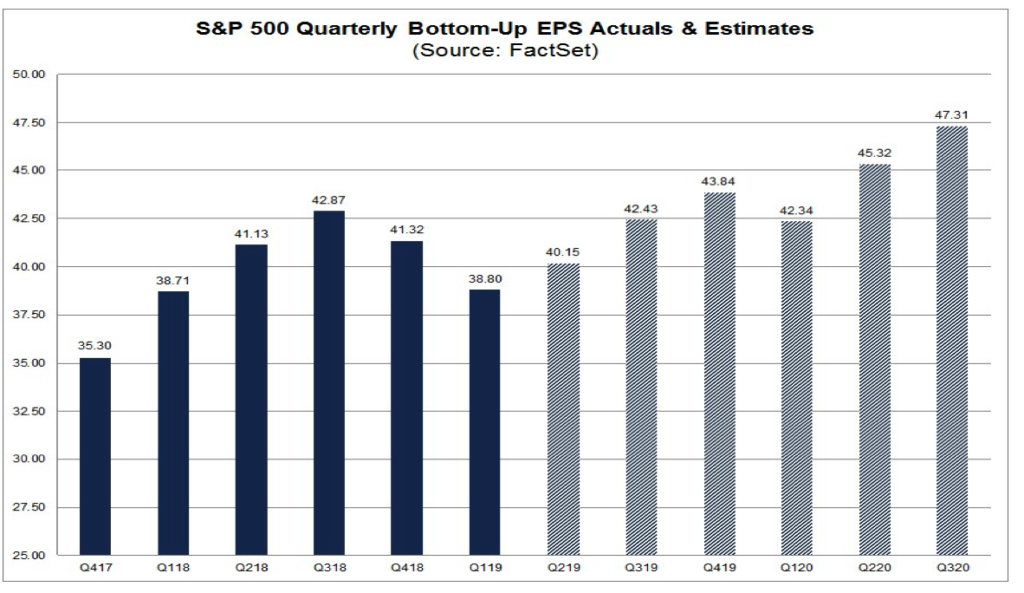
From a statistically significant perspective, this gives us a very hard look at how the second half of 2019 is shaping up from an earnings expectations perspective. As of Friday, July 26 afternoon this is what the picture looked like:

You’ll notice there really isn’t any earnings growth year over year for the first three quarters of 2019, leaving all of the expected over year 2019E PS growth for the S&P 500 that now stands at just 2.6% to come during the December quarter.

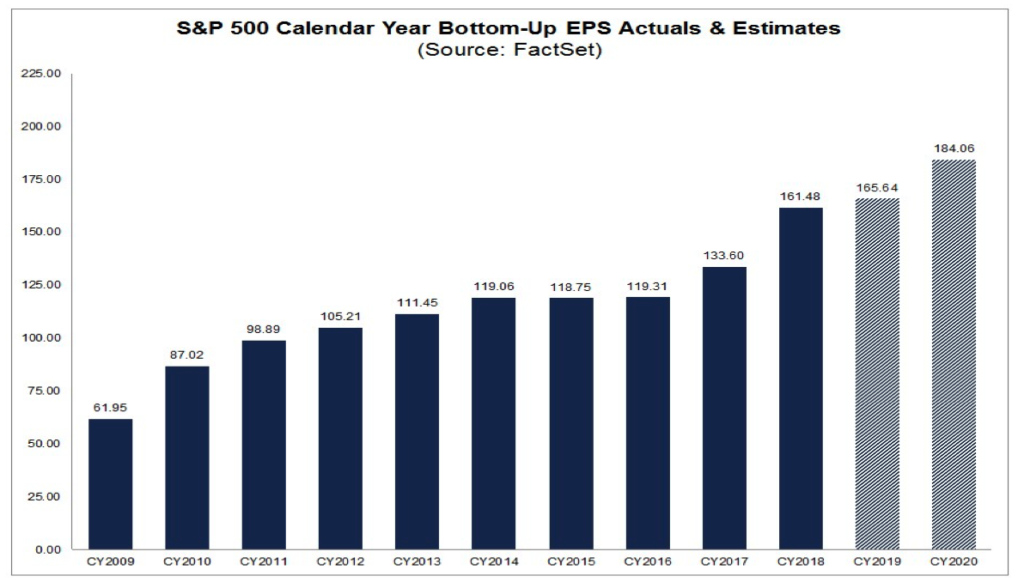
And if you’re thinking like me that expected 11% EPS growth forecast for the S&P 500 group of companies in 2020 looks a little bit much, well, here’s some perspective:

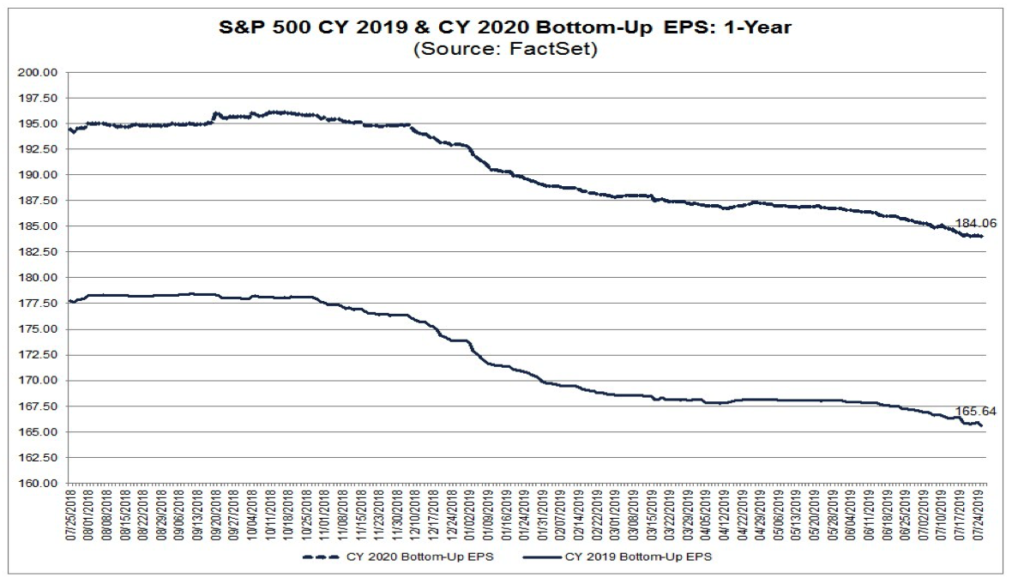
The point to that last graph is that for some reason the investing herd seems to start out with a +10% or more EPS growth assumption for the coming year. I’m not sure why that is, I merely comment on the data being presented. Given the vector and velocity of the global economy today, it seems that forecast is more likely to move lower than higher. And odds are rather high we’re not going to see yet another tax cut like we did exiting 2017 that goosed corporate EPS in 2018.

The last time we saw back to back years of little to no earnings growth for the S&P 500 was 2015-2016, and the S&P 500 peaked around 18.4x earnings. If 2020 EPS expectations for the S&P 500 continue to fall toward 2019 levels near $165 per share, it could mean we are seeing a market ceiling near the 3,040-3,060 range for the S&P 500.

No doubt there are some moving pieces in that analysis, but I find it is a smart move to keep a bead on how real earnings expectations are as well as their likely directionality vis a vis the global economy when charting what to do next with one’s investments.

Again, this is not a snapshot kind of a thing, but rather an evolving story. Yeah, I may sound like the Fed hear, but it shouldn’t come as a surprise the evolving nature of the market. So… I guess this means more on this as the story continues.

Waiting on the Fed and what Powell says about what lies ahead

Just after 2 p.m. ET today, we’ll hear from the Federal Reserve following its much-anticipated July FOMC meeting and the prevailing expectation is for a 25-basis-point rate cut. We do not expect an update to the Fed’s June economic projection materials, but what Jerome Powell says during the press conference will likely set expectations for the Fed’s three remaining monetary policy meetings in September, October and December. Odds are the central bank will remain on message, saying it will continue to be data dependent.

Weekly Issue: Several thematic bright spots among  2nd Quarter earnings disappointments

Weekly Issue: Several thematic bright spots among 2nd Quarter earnings disappointments

Key points inside this issue

  • Boosting our stop loss on Middle-Class Squeeze Thematic Leader Costco Wholesale (COST) to $240.
  • Safety & Security Thematic Leader Axon Enterprise Inc. (AAXN) catches a TAZR win.
  • Housekeeping: The next issue of Tematica Investing will be published during the week of July 29th. Why? Because next week I will be on vacation. Even though I’ll be catching up on some reading and thematic thinking, I’ll be kicking back and recharging for what lies ahead.

Last week, we started the June-quarter earnings season. While there were only 20 reports, what we heard from BASF SE, Fastenal (FAST), and MSC Industrial (MSM) served to remind us that, even though the Fed will likely cut interest rates, odds are the current earning seasons will be a challenging one. That view was reaffirmed this week with results from JB Hunt (JBHT) and CSX (CSX) that confirmed the slowdown in freight traffic, an indicator that we here at Tematica watch rather closely as a gauge for the domestic economy’s health.

Given the declines in the Cass Freight Index over the last seven months, the results out of JB Hunt, CSX and other shippers should hardly be news to the investment community. On the other hand, what is somewhat concerning to me is that these declines in freight are coming in even as June Retail Sales surprise to the upside and e-tailers, like Thematic King Amazon (AMZN), Walmart (WMT), Target (TGT) and others, are embracing one-day and same-day shipping from the prior table stakes that were two-day shipping. The growing concern that I have is that despite the tailwind associated with our Digital Lifestyle investing theme, continued declines in the Cass Freight Index and other freight indicators could signal that the domestic economy is moving from one that is slowing into one that is in contraction territory.

Despite the upside surprise in the June Retail Sales report, it was counterbalanced by a revelation contained in the June Industrial Production & Capacity Utilization report. What we learned yesterday from that report was that domestic factory production fell at an annualized rate of 2.2% in the June quarter. Paired with the slowing freight-related signals mentioned earlier, there is little question over the vector of the domestic economy. Clearly the June quarter will be slower than the March one, but the real question we need to face as investors is, how slow will it be in the current third quarter, as well as the fourth quarter this year? That speed along with the degree of the expected July Fed rate cut and the continuation of the current US-China trade war will influence business spending and earnings expectations for the back half of the year.

As far as the June Retail Sales report goes, while I am all for consumers spending, I’m not in love with the fact that it is increasing credit card debt that is likely driving it. According to data collected by the FDIC and published by MagnifyMoney, “Americans paid banks $113 billion in credit card interest in 2018, up 12% from the $101 billion in interest paid in 2017, and up 49% over the last five years.” And as we’ve seen in the monthly Consumer Credit Report issued by the Federal Reserve, revolving consumer credit, which includes credit card balances, has only grown year to date. In other words, consumers are using credit card debt to fund their spending and rising interest payments will squeeze disposable income levels.

While increasing consumer debt is not exactly an uplifting thought, and certainly a headwind for the economy in the coming quarters, these development are a tailwind for Middle-Class Squeeze Thematic Leader Costco Wholesale (COST):

  • Year to date, COST shares are up some 37%, and we are only now heading into the seasonally strongest time of the year for the company’s business. We should continue to hold COST shares, but we will also increase our stop loss to $240 from roughly $225.

Thematic Leader dates to watch

With investor attention turning to corporate earnings, here are the announced reporting dates for the Thematic Leaders:

  • Netflix (NFLX) –  July 17
  • Chipotle Mexican Grill (CMG) – July 23
  • Amazon (AMZN) – July 25
  • AMN Healthcare (AMN) – August 6
  • Dycom Industries (DY) – N/A
  • Costco Wholesale (COST) – N/A
  • Alibaba (BABA) – N/A
  • Axon Enterprises (AAXN) – N/A

Not all of the Leaders have shared the reporting dates for their latest quarterly earnings, but no worries as I’ll be filling the calendar in as the missing ones announce them. And it goes without saying that as the June 2019 earning season continues, I’ll be sifting through the sea of reports looking for thematic data points to be had.

Safety & Security Thematic Leader Axon Enterprise Catches a TAZR Win

As I was putting this issue of Tematica Investing to bed, I saw that Safety & Security Thematic Leader Axon Enterprises (AAXN) announced a big win for its business — a significant order for its TASER Conducted Energy Weapons from agencies across the United States. These orders, which were landed during the first half of 2019, will ship in multiple phases in the coming quarters.

Why are we only hearing about this now?

Partly because Axon needed permission from the agencies make the announcement, and even with such permission granted, the company still needed further permission to name those agencies as customers. A full list of those announced orders can be found here.

Of course, this news is a positive for Axon, and it serves as a reminder that even though the headline story for Axon is the company’s ongoing transformation into a digital security company as it grows it body-camera and digital subscription storage business, the steadfast TAZR business remains a firearm alternative.

We’ve enjoyed a nice run in Axon shares since they were added to the Thematic Leader board, and year to date the shares are up more than 46%. I see no reason to abandon them just yet and our long-term price target of $90 remains intact. For now, our stop loss on the shares continues to sit at $51.

And for what it’s worth, as impressive as that year to date gain is for AAXN shares, it still trails behind Cleaner Living Leader Chipotle Mexican Grill (CMG), which as of last night’s close was up more than 76% year to date.

Central Bankers’ New Clothes

Central Bankers’ New Clothes

In this week’s musings:

  • Earnings Season Kicks Off 
  • Central Bankers’ New Clothes 
  • Debt Ceiling – I’m Baaack
  • Trade Wars – The Gift that Keeps on Giving
  • Domestic Economy – More Signs of Sputtering
  • Stocks – What Does It All Mean

It’s Earnings Season

Next week banks unofficially kick off the June quarter earnings season with expectations set for a -2.6% drop in S&P 500 earnings, (according to FactSet) after a decline of -0.4% in the first quarter of 2019. If the actual earnings for the June quarter end up being a decline, it will be the first time the S&P 500 has experienced two quarters of declines, (an earnings recession) since 2016. Recently the estimates for the third quarter have fallen from +0.2% to -0.3%. Heading into the second quarter, 113 S&P 500 companies have issued guidance. Of these, 87 have issued negative guidance, with just 26 issuing positive guidance. If the number issuing negative guidance does not increase, it will be the second highest number since FactSet began tracking this data in 2006. So not a rosy picture.

Naturally, in the post-financial crisis bad-is-good-and-good-is-bad-world, the S&P 500 is up nearly 20% in the face of contracting earnings — potentially three quarters worth — and experienced the best first half of the year since 1997. In the past week, both the S&P 500 and the Dow Jones Industrial Average have closed at record highs as Federal Reserve Chairman Powell’s testimony before Congress gave the market comfort that cuts are on the way. This week’s stronger than expected CPI and PPI numbers are unlikely to alter their intentions. Welcome to the world of the Central Bankers’ New Clothes

Central Bankers’ New Clothes

Here are a few interesting side-effects of those lovely stimulus-oriented threads worn in the hallowed halls of the world’s major central banks.

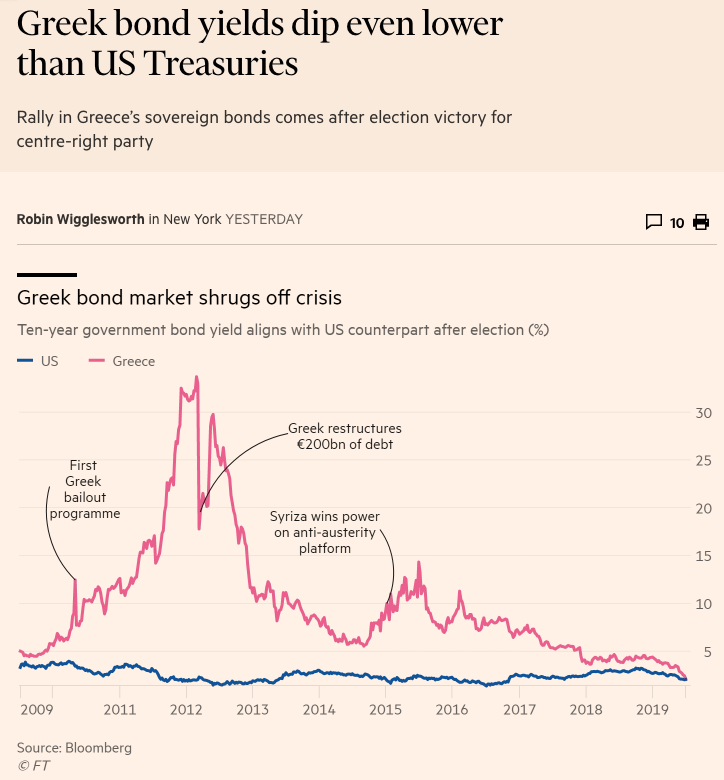
https://www.tematicaresearch.com/wp-content/uploads/2019/07/2019-07-12-EU-EM-Neg-Yields.png https://www.tematicaresearch.com/wp-content/uploads/2019/07/2019-07-12-Greek-below-UST.png

Yes, you read that right. Greece, the nation that was the very first to default on its debt back in 377BC and has been in default roughly 50% of the time since its independence in 1829, saw the yield on its 10-year drop below the yield on the 10-year US Treasury bond. But how can that be?

Back to those now rather stretchy stimulus suits worn by the world’s central bankers that allow for greater freedom of movement in all aspects of monetary policy. In recent weeks we’ve seen a waterfall of hints and downright promises to loosen up even more. The European Central Bank, the US Federal Reserve, the Bank of Canada have all gone seriously dovish. Over in Turkey, President Erdogan fired his central banker for not joining the party. Serbia, Australia, Dominican Republic, Iceland, Mozambique, Russia, Chile, Azerbaijan, India, Australia, Sri Lanka, Kyrgyzstan, Angola, Jamaica, Philippines, New Zealand, Malaysia, Rwanda, Malawi, Ukraine, Paraguay, Georgia, Egypt, Armenia, and Ghana have all cut rates so far this year, quite a few have done so multiple times. From September of 2018 through the end of 2018, there were 40 rate hikes by central banks around the world and just 3 cuts. Since the start of 2019, there have been 11 hikes and 38 cuts.

That’s a big shift, but why? Globally the economy is slowing and in the aftermath of the financial crisis, a slowing economy is far more dangerous than in years past. How’s that?

In the wake of the financial crisis, governments around the world set up barriers to protect large domestic companies. The central bankers aimed their bazookas at interest rates, which (mostly as an unintended consequence) ended up giving large but weak companies better access to cheap money than smaller but stronger companies. This resulted in increasing consolidation which in turn has been shrinking workers’ share of national income. For example, the US is currently shutting down established companies and generating new startups at the slowest rates in at least 50 years. Today much of the developed world faces highly consolidated industries with less competition and innovation (one of the reasons we believe our Disruptive Innovators investing theme is so powerful) and record levels of corporate debt. It took US corporations 50 years to accumulate $3 trillion in debt in the third quarter of 2003. In the first quarter of 2019, just over 15 years later, this figure had more than doubled to $6.4 trillion.

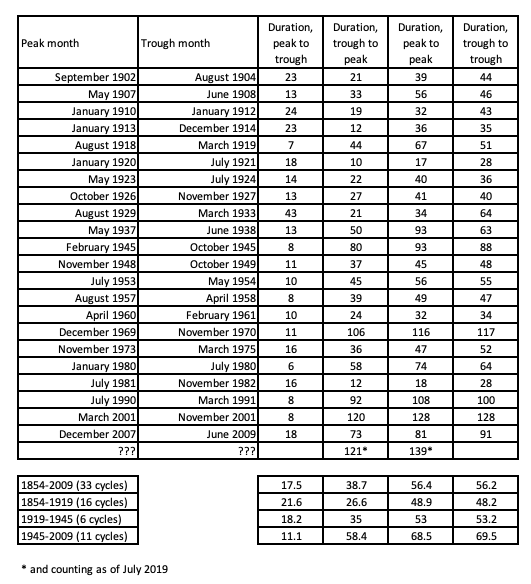
Along with the shrinking workers’ share of national income, we see a shrinking middle class in many of the developed nations – which we capitalize on in our Middle Class Squeeze investing theme. As one would expect, this results in the economy becoming more and more politicized – voters aren’t happy. Recessions, once considered a normal part of the economic cycle, have become something to be avoided at all costs. The following chart, (using data from the National Bureau of Economic Research) shows that since the mid-1850s, the average length of an economic cycle from trough to peak has been increasing from 26.6 months between 1854 and 1919 to 35 months between 1919 and 1945 to 58.4 months between 1945 and 2009. At the same time, the duration of the economic collapse from peak to trough has been shrinking. The current trough to (potential peak) is the longest on record at 121 months – great – but it is also the second weakest in terms of growth, beaten only by the 37-month expansion from October 1945 to November of 1948.

https://www.tematicaresearch.com/wp-content/uploads/2019/07/2019-07-12-Economic-Cycles.png

Why has it been so weak? One of the reasons has been the rise of the zombie corporation, those that don’t earn enough profit to cover their interest payments, surviving solely through refinancing – part of the reason we’ve seen ballooning corporate debt. The Bank for International Settlements estimates that zombie companies today account for 12% of all companies listed on stock exchanges around the world. In the United States zombies account for 16% of publicly listed companies, up from just 2% in the 1980s. 

This is why central bankers around the world are so desperate for inflation and fear deflation. In a deflationary environment, the record level of debt would become more and more expensive, which would trigger delinquencies, defaults and downgrades, creating a deflationary cycle that feeds upon itself. Debtors love inflation, for as purchasing power falls, so does the current cost of that debt. But in a world of large zombie corporations, a slowing economy means the gap between profit and interest payments would continue to widen, making their survival ever more precarious. This economic reality is one of the reasons that nearly 20% of the global bond market has negative yield and 90% trade with a negative real yield (which takes inflation into account).

Debt Ceiling Debate – I’m baack!

While we are on the topic of bonds, the Bipartisan Policy Center recently reported that they believe there is a “significant risk” that the US will breach its debt limit in early September if Congress does not act quickly. Previously it was believed that the spending wall would not be hit until October or November. As the beltway gets more and more, shall we say raucous, this round could unnerve the markets.

Trade Wars – the gift that keeps on giving

Aside from the upcoming fun (sarcasm) of watching Congress and the President whack each other around over rising government debt, the trade war with China, which gave the equity markets a serious pop post G20 summit on the news that progress was being made, is once again looking less optimistic. China’s Commerce Minister Zhong Shan, who is considered a hardliner, has assumed new prominence in the talks, participating alongside Vice Premier Liu He (who has headed the Chinese team for over a year) in talks this week. The Chinese are obviously aware that with every passing month President Trump will feel more pressure to get something done before the 2020 elections and may be looking to see just how hard they can push.

Trade tensions between the US and Europe are back on the front page. This week, senators in France voted to pass a new tax that will impose a 3% charge on revenue for digital companies with revenues of more than €750m globally and €25m in France. This will hit roughly 30 companies, including Apple (AAPL), Facebook (FB), Amazon (AMZN) and Alphabet (GOOGL) as well as some companies from Germany, Spain, the UK and France. The Trump administration was not pleased and has launched a probe into the French tax to determine if it unfairly discriminates against US companies. This could lead to the US imposing punitive tariffs on French goods.

Not to be outdone, the UK is planning to pass a similar tax that would impose a 2% tax on revenues from search engine, social media and e-commerce platforms whose global revenues exceed £500m and whose UK revenue is over £25m. This tax, which so far appears to affect US companies disproportionately, is likely to raise additional ire at a time when the US-UK relationship is already on shaky ground over leaked cables from the UK’s ambassador that were less than complimentary about President Trump and his administration.  

That’s just this week. Is it any wonder the DHL Global Trade Barometer is seeing a contraction in global trade? According to Morgan Stanley research, just under two thirds of countries have purchasing manager indices below 50, which is contraction territory and further warning signs of slowing global growth. This week also saw BASF SE (BASFY), the world’s largest chemical company, warn that the weakening global economy could cut its profits by 30% this year.

Domestic Economy – more signs of sputtering

The ISM Manufacturing index weakened again in June and has been declining now for 10 months. The New Orders component, which as its name would imply, is more forward-looking, is on the cusp of contracting. It has been declining since December 2017 and is at the lowest level since August 2016. Back in 2016 the US experienced a bit of an industrial sector mini-recession that was tempered in its severity by housing. Recall that back then we saw two consecutive quarters of decline in S&P 500 earnings. Today, overall Construction is in contraction with total construction spending down -2.3% year-over-year. Residential construction has been shrinking year-over-year for 8-months and in May was down -11.2% year-over-year. Commercial construction is even worse, down -13.7% year-over-year in May and has been steadily declining since December 2016. What helped back in 2016 is of no help today.

While the headlines over the employment data (excepting ADP’s report last week) have sounded rather solid, we have seen three consecutive downward revisions to employment figures in recent months. That’s the type of thing you see as the data is rolling over. The Challenger, Gray & Christmas job cuts report found that employer announced cuts YTD through May were 39% higher than the same period last year and we are heading into the 12thconsecutive month of year-over-year increases in job cuts – again that is indicative of a negative shift in employment.

Stocks – what does it all mean?

Currently, US stock prices, as measured by the price-to-sales ratio (because earnings are becoming less and less meaningful on a comparative basis thanks to all the share buybacks), exceed what we saw in the late 1999s and early 2000s. With all that central bank supplied liquidity, is it any wonder things are pricey?

On top of that, the S&P 500 share count has declined to a 20-year low as US companies spent over $800 million on buybacks in 2018 and are poised for a new record in 2019 based on Q1 activity. Overall the number of publicly-listed companies has fallen by 50% over the past 20 years and the accelerating pace of stock buybacks has made corporations the largest and only significant net buyer of stocks for the past 5 years! Central bank stimulus on top of fewer shares to purchase has overpowered fundamentals.

This week, some of the major indices once again reached record highs and given the accelerating trend in central bank easing, this is likely to continue for some time — but investors beware. Understand that these moves are not based on improving earnings, so it isn’t about the business fundamentals, (at least when we talk about equity markets in aggregate as there is always a growth story to be found somewhere regardless of the economy) but rather about the belief the central bank stimulus will continue to push share prices higher. Keep in mind that the typical Federal Reserve rate cut cycle amounts to cuts of on average 525 basis points. Today the Fed has only about half of that with which to work with before heading into negative rate territory.

The stimulus coming from most of the world’s major and many of the minor central banks likely will push the major averages higher until something shocks the market and it realizes, there really are no new clothes. What exactly that shock will be — possibly the upcoming debt ceiling debates, trade wars or intensifying geological tensions — is impossible to know with certainty today, but something that cannot go on forever, won’t.

What’s Behind the Commodities Rally?

What’s Behind the Commodities Rally?


On this episode of The Thematic Signals Podcast Chris Versace checks in with Sal Gilbertie, Teucrium Trading Chief Investment Officer


Welcome to the Thematic Signals podcast, where we look to distill everyday noise into clear investing signals using our thematic lens and our 10 investing themes. On this episode Chris Versace welcomes Sal Gilbertie, the Chief Investment Officer at  Teucrium Trading, back to the podcast. In the past on Tematica’s Cocktail Investing podcast, Chris and Sal have talked about the thematic influences on agricultural commodities, including Tematica’s New Global Middle-class one. They touch on that today but also discuss the current supply constraints as well as looming ones that have led to a supply imbalance, particularly for corn and soybeans, that has sent prices soaring. Sal explains how investors should think about these commodities across the 5 to 7 year cycle and shares why the upcoming G20 summit could serve as another catalyst for commodity prices to move higher. The two also discuss the ripple effect to be had on both consumers and companies in the agricultural complex but also those that count corn as a key input. 

Have a topic or a conversation you think we should tackle on the podcast, email me at cversace@tematicaresearch.com

And don’t forget to subscribe to the Thematic Signals Podcast on your favorite Apple device

Resources for this podcast:


Welcome to the New Thematic Signals Podcast

Welcome to the New Thematic Signals Podcast


Welcome to the Thematic Signals podcast, where we look to distill everyday noise into clear investing signals using our thematic lens and our 10 investing themes. Every week we not only discuss key events that are shaping the stock market, but we also look at key sign posts for the changing economic, demographic, psychographic, and technological landscapes that are driving the structural changes occurring around us. 

On this episode, with retailer earnings in the spotlight, we dig into which ones are winning the fight for consumer wallet share and those that are losing. The implications are huge given that retail accounts for nearly 20% of the S&P 500 and roughly 16% of US GDP.  Those that are winning the wallet share fight, such as Target, Hibbett Sports, Walmart, TJX Companies. Best Buy and others are leveraging our Middle-Class Squeeze, Digital Society and to a lesser extent our Aging of the Population investing theme. We also talk about what investors should be looking for next as earnings season winds down and share some of the latest signals for our 10 investing themes.

Have a topic or a conversation you think we should tackle on the podcast, email me at cversace@tematicaresearch.com

And don’t forget to subscribe to the Thematic Signals Podcast on iTunes!

Resources for this podcast:

Weekly Issue: As trade concerns escalate, investors brace for an expectations reset

Weekly Issue: As trade concerns escalate, investors brace for an expectations reset


Key points inside this issue

  • Safety & Security Thematic Leader is up big year to date, and new body camera and digital records products hitting later this year should accelerate the company’s transition. Our long-term price target on AAXN shares remains $90.
  • The April Retail Sales Report should offer confirmation for Thematic King Amazon (AMZN) as well as Middle-Class Squeeze Thematic Leader Costco Wholesale (COST). 


Given the wide swings in the market over the last few days that are tied back to the changing US-China trade talk landscape, I thought it prudent to share my latest thoughts even if it’s a day earlier than usual. 

As we discussed in the last issue of Tematica Investing, we knew that coming into last week, it was going to be a challenging one. Trade tensions kicked up to levels few were expecting 10 days ago and as the week progressed the tension and uncertainty crept even higher. We all know the stock market is no fan of uncertainty, but when paired with upsized tariffs from both the US and China that will present new economic and earnings headwinds, something that was not foreseen just a few weeks ago, investors will once again have to revisit their expectations for the economy and earnings. And yes, odds are those past and even more recent expectations will be revisited to the downside. 

What was originally thought to have been President Trump looking to squeeze some last- minute trade deal points out of the Chinese instead turned out to be more of a response to China’s attempt to do the same. This revealed the tenuous state of U.S./China trade talks. Last Friday morning, the U.S. had boosted tariffs to 25% from 10% on $200 billion worth of Chinese goods with President Trump tweeting there is “absolutely no need to rush” and that “China should not renegotiate deals with the U.S. at the last minute.” Even as the new tariffs and tweets arrived, trade negotiations continued Friday in Washington with no trade deal put in place, which dashed the hopes of some traders. Candidly, I didn’t expect a trade deal to emerge given what had transpired over the prior week. 

That hope-inspired rebound late Friday in the domestic stock market returned to renewed market pressure over the weekend and into this week as more questions over U.S.-China trade have emerged. As we started off this week, the trade angst between the U.S. and China has edged higher as China has responded to last week’s U.S. tariff bump by saying it would increase tariffs on $60 billion of U.S. goods to 25% from 10% beginning June 1st. Clearly, the latest round of tweets from President Trump won’t ease investor concern as to how the trade talks will move forward from here.

As the trade war rhetoric kicks up alongside tariffs, the next date to watch will be the G-20 economic summit in Japan next month. According to Trump economic adviser Larry Kudlow, there is a “strong possibility” Trump will meet Chinese President Xi and this morning President Trump confirmed that. 

The cherry or cherries on top of all of this is the growing worries over increasing tension with Iran, which is weighing on the market this morning, and yet another 2019 growth forecast cut by the EU that came complete with a fresh warning on Italy’s debt levels. Growth projections by the European Commission showed a mere 0.1% for GDP growth this year in Italy. The country has the second-largest debt pile in the EU and, according to the latest forecasts by the commission, the Italian debt-to-GDP ratio will hit 133% this year and rise to 135% in 2020. I point these out not to worry or spook you, but rather remind you there are other issues than just US-China trade that have to be factored into our thinking.

The natural market reaction to all of these concerns is to adopt a “risk off” attitude, which, as we’ve seen before, can ignite a storm of “fire first, ask questions later.” And as should be no surprise, that has fueled the sharp move lower in the major market indices. Over the last several days, the S&P 500, which as we know if the barometer used by most institutional and professional investors, fell 4.7% while the small-cap heavy Russell 2000 dropped 5.7%.

At times like this, it pays to do nothing. Hard to believe but as you’ve often heard few will step in to catch a falling knife and given the sharp declines, we also run the risk of a dead cat bounce in the market. We should be patient until the market finds its footing, which means parsing what comes next on the economic and earnings as well as trade front.  

I’ll continue to look for replacements for open Thematic Leader slots as well as other contenders poised to benefit from our pronounced thematic tailwinds. In the near-term, that will mean focusing on ones that also have a more U.S.-focused business model, a focus on inelastic and consumable products. Another avenue that investors are likely to revisit is dividend-paying companies, particularly those that fall into the Dividend Aristocrats category because they’ve consistently grown their dividends for the past 10 years. As I sift through the would-be contenders, I’ll be sure to look for those that intersect our investing themes and the aristocrats. 


Tematica Investing

As the stock market has come under pressure, a number of our Thematic Leaders, as well as companies on the Select List, have given back some of their year-to-date gains. One that has rallied and moved higher in spite of the market sell-off is Safety & Security Thematic Leader Axon Enterprises (AAXN) and are up some 48% year to date. That makes it the second-best performer on the Thematic Leaderboard year to date behind Clean Living company Chipotle Mexican Grill (CMG) that is up nearly 60% even after the market’s recent bout of indigestion.

Axon reported its March quarter earnings last week, which saw revenue grow 14% year over year as Axon continues to shift its business mix from Taser hardware to its Software & Sensor business that fall under the Axon Body and Axon Records businesses. During the company’s earnings conference call, the management team shared its next gen products will be available during the back half of the year. These include the Axon Body, its first camera with LTE live streaming, will launch during the September quarter and Axon Records, its first stand-alone software product. Records w will launch with a major city police department and it is already testing with a second major police department. As far as the new Axon Body product, I suspect the untethering of this camera could spur adoption much the way Apple’s (AAPL) Apple Watch saw a pronounced pick up when it added cellular connectivity to its third model. 

These new products, which leverage the intersection between our Digital Infrastructure investing theme and our Safety & Security one, should accelerate the transition to a higher margin, recurring revenue business in the coming quarters. In other words, Axon’s transformation is poised to continue and as that happens investors will be revisiting how they value the company’s business. More than likely that means further upside ahead for AAXN shares. 

  • Our price target on Safety & Security Thematic Leader Axon Enterprises (AAXN) remains $90.


Here comes the April Retail Sales Report

Later this week, we’ll get the April Retail Sales Report, which should benefit for the late Easter holiday this year. Up until the March report, this data stream was disappointing during December through February but even so from a thematic perspective the reports continued to reinforce our Digital Lifestyle and Middle-class Squeeze investing themes. 

When we look at the April data, I’ll be looking at both the sequential and year over year comparisons for Nonstore retailers, the government category for digital shopping and the category that best captures Thematic King Amazon (AMZN). I’ll also be looking at the general merchandise stores category with regard to Middle-Class Squeeze Thematic Leader Costco Wholesale (COST). Costco has already shared its April same-store sales, which rose 7.7% in the US despite having one less shopping day during the month compared to last year. Excluding the impact of gas prices and foreign exchange, Costco’s April sales were up 5.6% year over year. From my perspective, the is the latest data point that shows Costco continues to take consumer wallet share. 

With reported disposable income data inside the monthly Personal Income & Spending reports essentially flat for the last few months and Costco continuing to open new warehouse locations, which should spur its high margin membership revenue, I continue to see further upside ahead in COST shares. And yes, the same applies to Amazon shares as well.

  • Our $250 price target for Middle-class Squeeze Thematic Leader Costco Wholesale (COST) is under review.


This Week’s Issue: Hear those engines? It’s earnings season!

This Week’s Issue: Hear those engines? It’s earnings season!

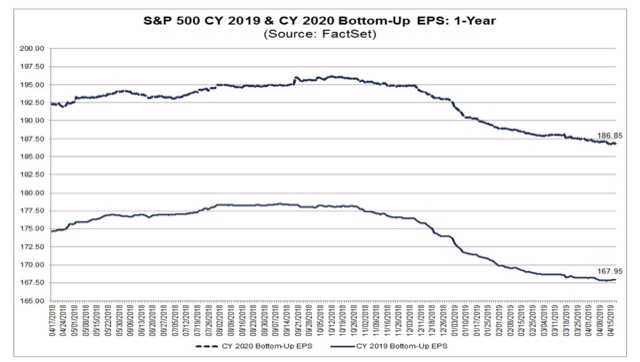
Coming into this week 15% of the S&P 500 companies have reported and exiting it that percentage will jump to 45%. What the market and investors will be focusing on this week is what led to upside or downside surprises for the reported quarter and how is the current quarter shaping up relative to expectations. Remember, that during the March quarter we saw downward revisions in S&P 500 EPS expectations for the quarter such that the consensus called for EPS declines year over year. Currently, expectations for the current June quarter are up 10% sequentially but are flat year over year. 


If we get the data to show these March reports and prospects for the current quarter are better than expected or feared, we could see the 2019 view for S&P 500 earnings move higher vs. the meager 3.7% growth forecast to $167.95. If that happens, it will mark a change in view for 2019 expectations, which have been eroding over the last several months, and could drive the market higher. However, if we see a pickup in downward EPS cuts, we could see those 2019 S&P 500 consensus expectations come under pressure, which would make the stock market even more expensive following its year to date run of 16%. 

Now to sift through the onslaught of more than 680 companies reporting this week, which based on what we’re seeing this morning from Coca-Cola (KO), Lockheed Martin (LMT), Twitter (TWTR) and Pulte Group (PHM) suggest potential upside to be had. Tucked inside those results were positive data points for several of our investing themes:

Coca-Cola is feeling the tailwind of our Cleaner Living investing theme as sales of its flavored waters and sports drinks rose 6% year over year, significantly faster than the 1% growth posted by its carbonated drinks business. During the earnings conference call, CEO James Quincy shared that the management team is looking to make Coca-Cola a “total beverage company” by adding coffees, teas, smoothies and flavored waters to a portfolio that has traditionally offered aerated drinks.

Lockheed Martin Corp reported better-than-expected quarterly profit yesterday, benefitting from the Safety & Securitytailwind associated with President Donald Trump’s looser policies on foreign arms sales boosted demand for missiles and fighter jets.

Efforts to improve its advertising business model helped Twitter capture some of our Digital Lifestyletailwind as year over year monetizable daily user growth returned to double digits for the first time in several quarters. 

Verizon (VZ) beat quarterly expectations and on its earnings conference call 5G and its deployment in the coming quarters was a key topic during the question and answer session. Verizon will continue to build out its network and bring more 5G capable smartphones to market, which in my view continues to bode well for our Digital Infrastructureand Disruptive Innovators Thematic Leaders, Dycom (DY) and Nokia (NOK). Nokia will report its quarterly results later this week, and following Ericsson’s better than expected results that tied to strength in North America and 5G, Nokia could surprise on the upside as well.


Splitting the Housing and Retail Sales hairs

Late last week we received some conflicting economic data in the form of the March Retail Sales report and the March Housing Starts data. While retail sales for the month came in stronger than expected — a welcome sign following the last few months in which that data disappointed relative to expectations — March housing starts fell to their weakest point since 2017 despite a tick down in mortgage rates. Now let’s take a deeper dive into those two reports:

In looking at the March Retail Sales report, total retail rose 1.7% month over month (3.5% year over year) with broad-based sales strength and nice gains seen across discretionary spending categories. While we are quite pleased with the month’s data, subscribers know we tend to favor a longer-term perspective when it comes to identifying data trends. Consequently, as we are bracing for the March quarter earnings onslaught it makes sense to examine how retail sales in this year’s March quarter compared to the year-ago quarter. Here we go:

Leaders for the March 2019 quarter vs. March 2018 quarter:

  • Nonstore retailers up more than 11%, which bodes very well for Thematic King Amazon  (AMZN) and to a lesser extent our Alphabet (GOOGL). Let’s remember that those packages need to get to their intended destinations, which likely means positive things for United Parcel Service (UPS), and I’ll be checking that report, which is out later this week. 
  • Food services & drinking places rose 4.4%, which points to favorable data for Guilty Pleasure Thematic Leader Del Frisco’s Restaurant Group (DFRG). And yes, I continue to wait on more about its strategic review process. 
  • Health & personal care stores were up 4.6%.
  • Building material & garden suppliers and dealers increased by 4.7%.

Laggards for the March 2019 quarter vs. March 2018 quarter:

  • Sporting goods, hobby, musical instrument, & book stores were down 7.9 
  • Department Stores fell 3.8%, which comes as no surprise to me given the accelerating shift to digital shopping that is part of our Digital Lifestyle investing theme. 
  • Miscellaneous store retailers were down 3.8%

Turning to the March Housing Starts report, the aggregate starts data fell to the weakest level since 2017, but that decline includes both single-family and multifamily housing starts. Breaking down those two components, single-family starts were down 0.4% to 781,000, the slowest pace since September 2016, while permits decreased 1.1% to 808,000, the lowest since August 2017. Multifamily starts, which include apartments and condominiums, were unchanged month over month at 354,000, while those permits fell 2.7%. 

The March results may have been influenced to some degree by harsh weather in the Northeast, which contended with heavy snowfalls, and in the South as it dealt with record flooding along the Mississippi and Missouri rivers. Even so, the housing data were off despite a decline in the 30-year mortgage rate to roughly 4.15% this month from 4.86% last October, according to data from Marcrotrends. This decline likely signals that consumers are being priced out of the market as developers and home builders continue to struggle with building affordable properties amid rising labor and materials costs. We also must consider the state of the consumer, who is dealing with the impact of higher debt levels across credit cards, auto loans and student loans — a combination that is sapping disposable income and the ability to service mortgages on homes they may not be able to afford.

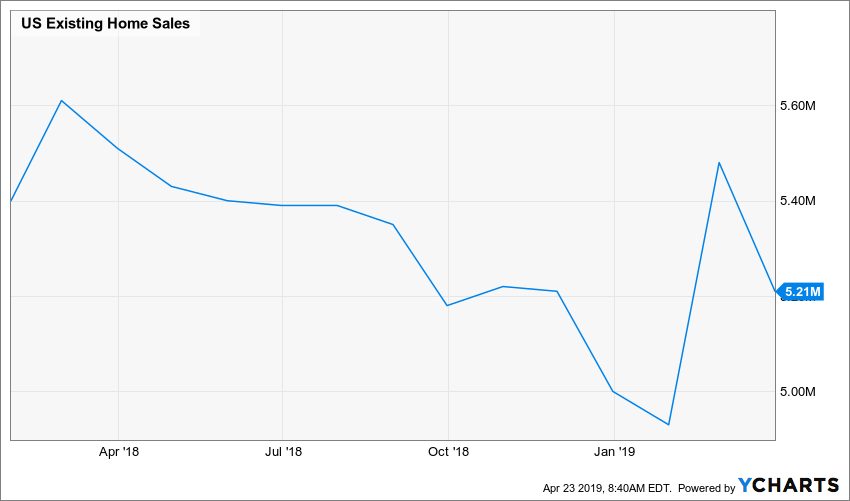
Generally speaking, most existing homeowners in the U.S. use the capital from selling their current homes to help fund the purchase of their next dwellings. This means we as investors should watch Existing Home Sales data as a precursor to new home sales and housing starts. Despite February’s better-than-expected sequential print, Existing Home Sales have been falling on a year-over-year basis since February 2018.

Per March Existing Home Sales report, which showed a 5.4% sequential drop vs. February and a similar decline vs. a year ago. For the March quarter, existing home sales fell 5.3%, which in our opinion does not augur well for a near-term pick up in the overall housing market, especially as the recent decline in mortgage rates has not jump started new mortgage applications.

Generally speaking, the housing market has two seasonally strong periods during the year, the spring and fall selling seasons, of which spring tends to be the stronger one. This year, it could be argued that harsh weather in various parts of the U.S. has resulted in the spring selling season getting off to a slow start. Leading up to it, we have seen a climb in the inventory of new homes listed for sale, according to Realtor.com. That’s the supply side of the equation, but the side we remain concerned about is demand.

As we get more data in the coming weeks, we’ll be better able to suss out if we are dealing with a weather related situation, a consumer affordability one or some combination of the two. If the data points to a consumer affordability one, we may consider Home Depot (HD), which is a company that cuts across our Middle Class Squeeze and Affordable Luxury investing themes. Through last night, however, HD shares are up some 28% year to date, and are sitting in over bought territory. Should we see a sizable pullback over the coming weeks as more earnings reports are had and digested, this could be one to revisit. 

Weekly Issue: Apple and Disney Showing Transformational Signals

Weekly Issue: Apple and Disney Showing Transformational Signals

Key points inside this issue

  • What the March NFIB Small Business Optimism Index had to say
  • Making sense of the IMF’s latest economic forecast cut
  • Ahead of Disney’s (DIS) Investor Day today, we continue to have a Buy on Disney (DIS) shares, and our $125 price target is under review
  • Based on its recent string of monthly same-store-sales reports and year over year progress in warehouse openings, with more to come, I am bumping our price target on Middle-Class Squeeze Leader Costco Wholesale (COST) to $260 from $250.  
  • Our price target on Thematic King Amazon (AMZN) shares remains $2,250.
  • Our price target on Alphabet/Google (GOOGL) shares remains $1,300.


What the March NFIB Small Business Optimism Index had to say

This past Tuesday, we received the March Small Business Optimism Index reading from the National Federation of Independent Business (NFIB). The index edged higher, month over month, to 101.8. For the March quarter, the Optimism Index reading averaged 101.56, with March’s reading the highest, which was well below the March 2018 quarter’s 106.4 reading and the 105.5 level for the December 2018 quarter. Clearly, the year-ago level benefited from tax-reform euphoria and while the index has fallen in recent months, the uptrend during first quarter is another sign the domestic economy continues to grow, rather than contract like we are seeing in the Big 3 economies of Europe: Germany, France and Italy.

Digging into the report, one of the bigger soft spots was inventories, as levels were viewed as too large and plans to invest pointed to more firms reducing rather than adding to their inventories. That’s another sign to us of potentially softer guidance relative to expectations in the upcoming earnings season.

Adding to that we also found the Outlook for General Business Conditions component, which looks at the coming six months, has softened considerably, hitting 11 in March, continuing the downtrend in the data since peaking at 35 last July. To us, this reflects that the ongoing trade war, domestic economic data and growing worries over the consumer have taken their toll.

What’s most worrisome to us, however, is the accelerating decline in small business earnings over the last two months. Survey respondents chalk this up to falling sales volume and rising costs that include labor, materials, finance, taxes and regulatory costs.

With lower tax rates and the cut in federal regulation by the Trump administration, the other three factors are the likely culprits behind the month-over-month declines in earnings the last few months. On top of that, the sales expectation for the coming three months has also softened compared to the second half of 2018.

With small business being one of the key job creation engines, these softening sales and earnings expectations could pressure hiring plans and corporate spending, adding to the headwind(s) for the domestic economy.

What’s also interesting ahead of bank earnings that kick off later this week, is the survey revelation that loan availability became harder to obtain during February and March. There was also a drop in expectations for credit in March.

Rather than relying on just one set of numbers, we here at Tematica prefer to leverage several pieces of data to get a fuller, more robust picture. In this case, however, it does mean that we’ll be on guard with bank earnings, especially from those that are outside of the bulge bracket banks — JPMorgan Chase (JPM), Citigroup (C), Bank of America (BAC) and the like. Those names tend to be far more diversified in their revenue streams and can weather the potential storm far better than smaller, regional banks, such as First Community Bankshares (FCBC), that make their profits primarily on deposit and loan volumes.


Making sense of the IMF’s latest economic forecast cut

Also, on Tuesday, the IMF lowered its 2019 World Growth Outlook to 3.3% from 3.5% in January to reflect cuts in both US and European forecasts and a modest upward revision in China. The downward revisions come as the IMF appears to be factoring the recent global economic data that we’ve been getting in recent weeks and in its view “this weakness” is expected to continue in the first half of 2019. Following on that, yesterday morning the European Central Bank (ECB), held interest rates steady and warned that recent data pointed to a “slower growth momentum” in the eurozone.  

In many respects these comments were not surprising given the domestic economic and global IHS Markit data we’ve been reviewing here over the last few months. If anything, we see the IMF’s downgrade as overdue. But similar to how the Fed is a cheerleader for the domestic economy, the IMF is forecasting a global economic rebound in 2020, but then proceeds to list a series of downside risks and uncertainties, including “a rebound in Argentina and Turkey and some improvement in a set of other stressed emerging market and developing economies” and a “realization of these downside risks could dramatically worsen the outlook.” 

Rather than get wrapped up in the economic forecasts of the IMF, the Fed or other entity, we’ll continue to parse the data and triangulate the data points to get as real-time a view on the domestic and global economy as possible. This includes not only the government issued economic indicators, but also those from trade associations and other third parties. Yesterday we talked on the March Small Business Optimism Index from the NFIB and what it had to say. Other indicators we’ll be watching include monthly truck tonnage data, which fell year over year in February per the American Trucking Association, and weekly rail carloads fell 8.9% year over year in March per data from the Association of American Railroads. 

Late yesterday, we received the Fed’s minutes from its March FOMC monetary policy meeting. Recall that exiting the March meeting, the Fed’s post-meeting statement said it would be patient when it comes to future monetary policy actions as it downgraded its GDP forecast in 2019 and 2020. Moreover, it’s updated Economic Projections forecasted only one rate hike between March 2019 and the end of 2020. The meeting minutes confirmed this patient view was widespread across the committee. No surprise there in my view. With inflation data, as well as the vector and velocity of other recent domestic data, tipping lower, I expect the Fed is likely to remain optimistic but dovish in its forthcoming commentary and speeches, especially as the US-China trade negotiations drag on. 


And here we go…. March quarter earnings season 

The March quarter earnings season “fun” will start off with a trickle of earnings this week, 28 in all including several high-profile bank earnings later this week. The pace will pick up next week when roughly 170 companies will be issuing their results. The following week, which begins on April 22nd, it jumps considerably with more than 700 companies issuing their quarterly results and guidance. It is going to be fast; it is going to be furious. 

As you know, over the last few weeks I’ve been increasingly vocal about the potential for a rocky stock market during this earnings season as expectations are likely to get reset for a variety of reasons including the slowing speed of the global economy, dollar headwinds, rising costs, and trade uncertainties to name a few. And let’s remember the March 2018 earnings season saw companies wrap their heads around the impact of tax reform on their collective bottom lines. That bottom-line life preserver, from a guidance perspective, has come and gone.  Be sure to hold some downside protection over the next few weeks, like the ProShares Short S&P 500 ETF (SH) shares.


Tematica Investing


First Apple and today Disney

A few weeks ago, Apple (AAPL) held its special event that focused on its Services businesses, specifically the forthcoming streaming video, gaming and news services, all of which look to drive recurring subscription revenue. Today, The Walt Disney Company (DIS) will hold its annual investor meeting at which it will debut Disney+, its own streaming service. The new service from Disney will not only utilize the entire Disney and Fox entertainment library but also build on the company’s direct to consumer efforts with original programming across its Marvel, Star Wars, Pixar and other tentpole franchises. 

While DIS shares have not graduated to the Thematic Leaders, they have been on the Select List since mid-2016 as part of our former Content is King investment theme, which has since been folded into the Digital Lifestyle theme. When we first learned of the Disney+ service, my view was that if success is measured by consumer adoption, it had the possibility of transforming how investors should value the company. As more details have emerged on the service, it seems that more across Wall Street have adopted that same view. Earlier this week DIS shares received an upgrade from Cowen & Company to Buy, while BMO Capital Markets raised its rating to Outperform. These moves follow a boost from Goldman Sachs and Rosenblatt Securities last week. 

As we move from leaks and rumors on Disney+ to firm details with today’s event — and event that should also touch on other developments as well such as the roll out of Star Wars across Disney’s theme parks — I will revisit my longstanding $125 price target on the shares. 

  • Ahead of Disney’s (DIS) Investor Day today, we continue to have a Buy on Disney (DIS) shares, and our $125 price target is under review


Costco Wholesale does it again in March

Last night Middle Class Squeeze Thematic Leader Costco Wholesale (COST) reported March same-store comps of +5.7% (5.9% excluding gas and foreign exchange.) Compared to the data in recent Retail Sales reports, Costco continues to take consumer wallet share, but to me what was far more striking was the step up in its same-store comps month over month from +3.5% (+4.6% excluding gas and foreign exchange). It would seem it’s not just me looking to fight the tide of rising food prices by buying in bulk at Costco. 

The other item that I track rather closely when Costco issues these monthly reports is the number of open warehouses. Exiting March, it had 770 open warehouses, which compares to 749 exiting March 2018. That year over year increase bodes extremely well for Costco as more warehouses delivers increased high-margin membership fee revenue, which generates roughly 70% of the company’s operating income. 

  • Based on its recent string of monthly same-store-sales reports and year over year progress in warehouse openings, with more to come, I am bumping our price target on Middle-Class Squeeze Leader Costco Wholesale (COST) to $260 from $250.  


eMarketer sees continued Digital Advertising growth ahead

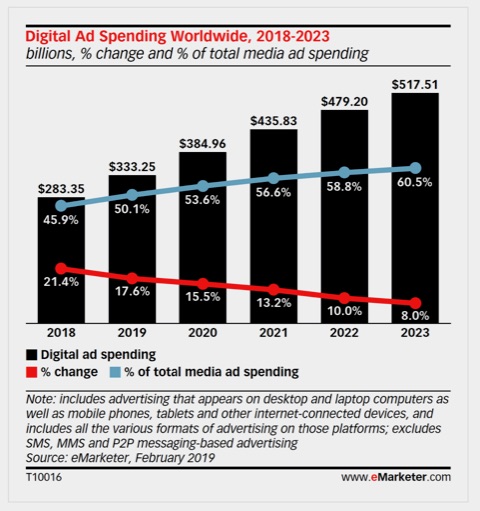
Ad spending will continue to rise across the globe, with digital driving most of the growth. According to data published by eMarketer, this year worldwide digital ad spending will rise by 17.6% to $333.25 billion, which means that, for the first time, digital will account for roughly half of the global ad market. In my view, this reflects the changing nature of where, how and when we consume content be it video, music, news or some other format that is a key part of our Digital Lifestyleinvesting theme. Advertisers want to go where the eyeballs are, and while this is a tailwind for a number of companies, the change in ad spend location is a growing headwind for “legacy” media companies. No wonder CBS (CBS), Comcast’s (CMCSA) NBC and others are looking to join the streaming video fray. 

eMarketer’s forecast depicts one of the core thesis items behind our holding shares of Alphabet Inc. (GOOGL) — namely, that digital advertising will continue to take share of total media spending. Per eMarketer’s forecast, digital advertising will grow to more than 60% of media spending by 2023, up from roughly 46% of advertising last year. While those outer years in the forecast range may be off by a point or two, it’s the direction and year-over-year share gains by digital advertising that matter for our Google shares as well as our Amazon.com (AMZN) shares.


Digging into eMarketer’s forecast, it sees Google remaining the top digital ad seller dog in 2019 with 31% market share. Behind it will be Facebook (FB) and its various properties and then Alibaba (BABA). In fourth place is Amazon, which eMarketer sees as generating $14 billion in ad revenue this year. To most companies, $14 billion would be the business, but at Amazon it should account for roughly 5% of its 2019 revenue. And while it is on the smaller side for the company, it’s bound to be rather profitable.

We are seeing some shifting of ad spend among Google, Facebook and Amazon, with Amazon being the up and comer. That said, the digital ad spend tide is still rising, and with concerns over privacy for Facebook and others the odds are better than good that both Google and Amazon will continue to ride that tide over the next few years. Longer term, as the shift to digital advertising continues, we will see slower growth rates much like any maturing industry, but we’re far from that point today.

  • Our price target on Thematic King Amazon (AMZN) shares remains $2,250.
  • Our price target on Alphabet/Google (GOOGL) shares remains $1,300.