Category Archives: Middle Class Squeeze

In the Midst of Rising Unknowns, Focus on What We Do Know

In the Midst of Rising Unknowns, Focus on What We Do Know

As someone famous (or infamous depending on your leanings) once said, “there are known knowns….there are known unknowns…but there are also unknown unknowns.”

We’ve got a whole lot of the second two going around these days and that is not good for growth. Life and investing requires dealing with uncertainty to be sure, but holy cow these days investors and businesses are facing a whole other level of who-the-hell-knows and that is a headwind to growth.

  • The bumbling battle over Brexit
  • China’s earnings recession
  • Slowing in Europe
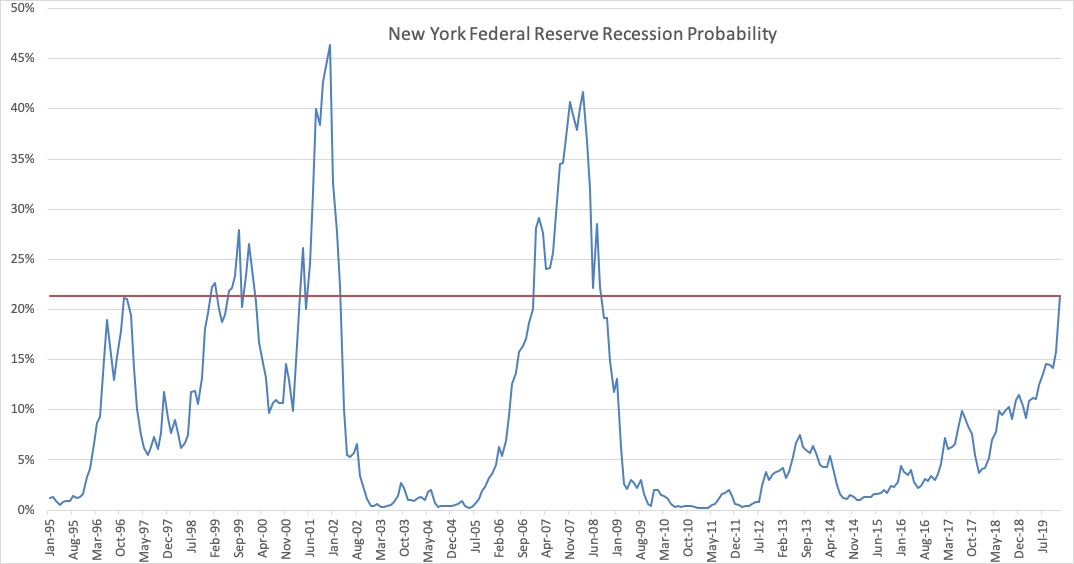
  • Yield curve inversions
  • Record levels of frustration with Capital Hill
  • The Cost of Corporate Uncertainty
  • The battle over the GDP pie
  • Beware Reversion to the Mean

Brexit

The United Kingdom, in or out? The mess that has become of Brexit is wholly unprecedented in modern history. As of March 29th, the day the UK was set to leave the EU, Brexit has never been more uncertain nor has the leadership of the UK in the coming months. This graphic pretty much sums it up.
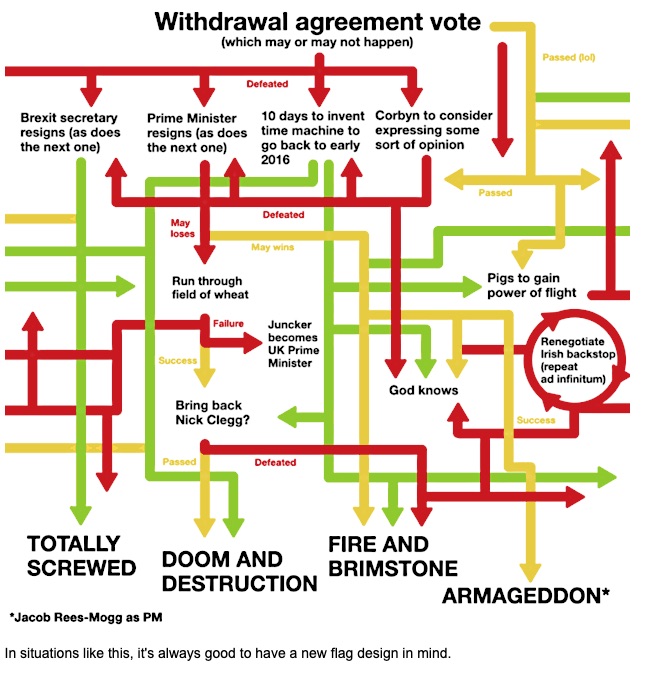
Many Brits are unhappy with the state of their nation’s economy and are blaming those folks over in Brussels, as are many others in the western world – part of our Middle Class Squeeze investment theme.

China

Its economy is slowing, but just how bad it is and just how dire the debt situation in the nation is difficult to divine given the intentional opacity of the nation’s leadership. The ongoing trade negotiations with America run as hot and cold as Katy Perry depending on the day and when you last checked your Twitter feed.

Most recently China’s industrial profits fell 14% year-over-year in the January and February meaning we are witnessing an earnings recession in the world’s second largest economy.

Europe

Last week the markets ended in the red, driven in part by weaker than expected German manufacturing PMI from Markit with both output and new orders falling significantly – new orders were the weakest in February since the Financial Crisis.
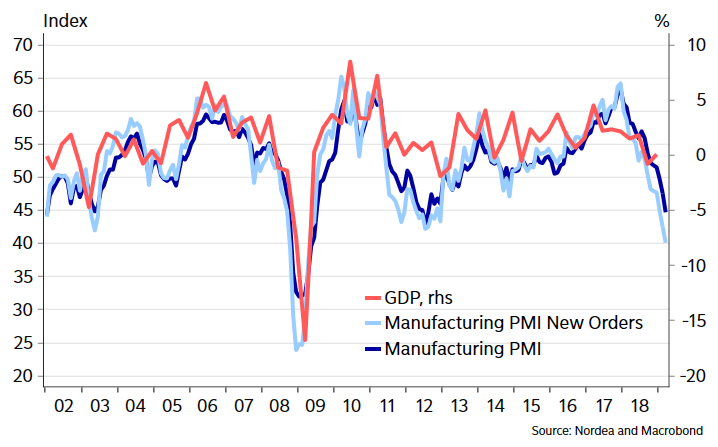
Markit German Manufacturing PMI

It wasn’t just the Germans though as the French Markit Composite Index (Manufacturing and Services) dropped into contraction territory as well in February, coming in at 48.7 versus expectations for 50.7, (anything below 50 is in contraction). The French PMI output index is also in contraction territory.

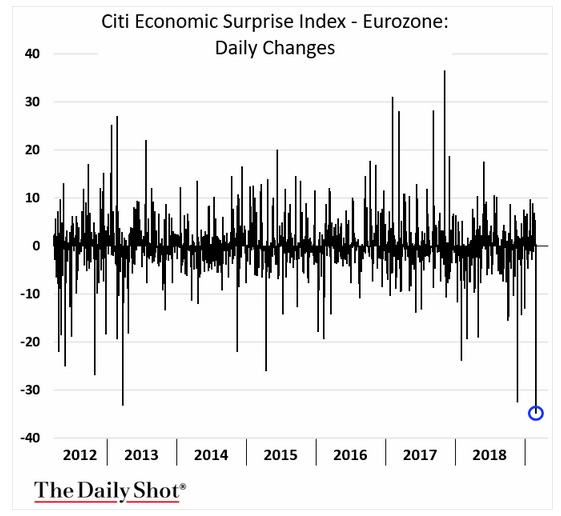
This led to the largest one-day decline in the Citi Eurozone Economic Surprise Index in years, (hat tip TheDailyShot).
Yield Curve Inversion

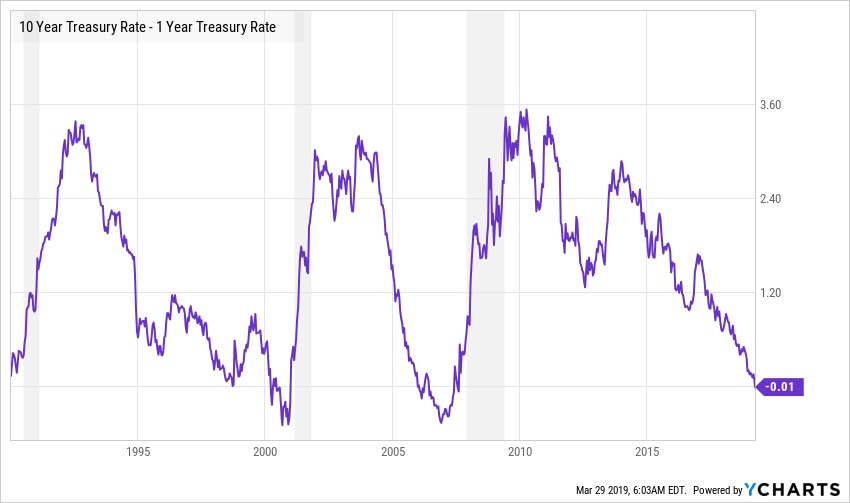
This pushed the yield on the German 10-year Bund into negative territory for the first time since 2016 while in the US Treasury market, the 10-year to 3-month and 10-year to 1-year spreads went negative – an inverted yield curve which has been a fairly reliable predictor of US recessions. The 10-year 3-month inverted for the first time in 3,030 days – that is the longest period going back over 50 years. The Australian yield curve has also inverted at the short end.
No Love for Capital Hill

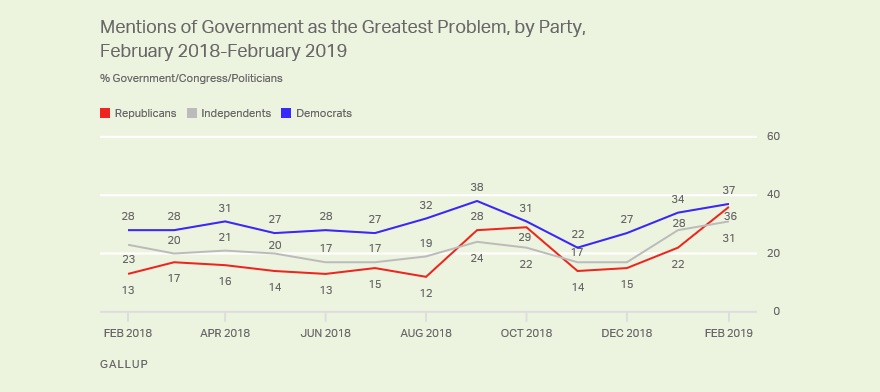
Americans’ view of their government is the worst on record – another manifestation of our Middle-Class Squeeze Investment theme. Gallup has been asking Americans what they felt was the most important problem facing the country since 1939 and has regularly compiled mentions of the government since 1964. Prior to 2001, the highest percentage mentioning government was 26% during the Watergate scandal. The current measure of 35% is the highest on record.
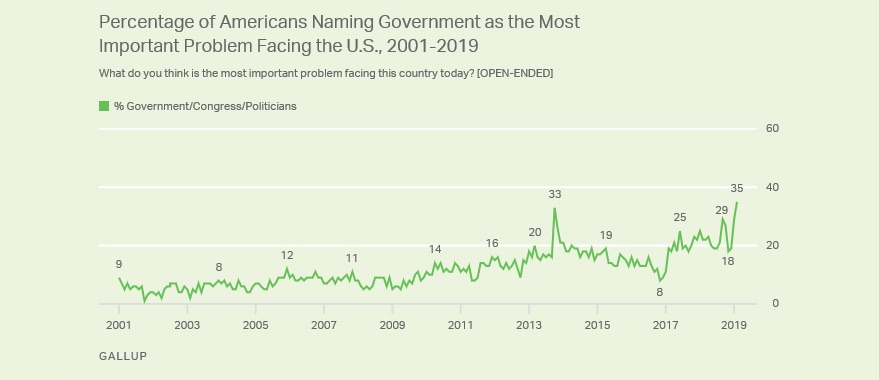
Few issues have every reached this level of importance to the American public: in October of 2001 46% mentioned terrorism; in February of 2007 38% mentioned the situation in Iraq, in November 2008 58% mentioned the economy and in September 2011 39% mentioned unemployment/jobs.

While America appears to be more and more polarized politically, the one thing that many agree upon, regardless of political leanings – government is the greatest problem.
It isn’t just the US that is having a tiff with its leaders. Last weekend over 1 million (yes, you read that right) people protested in London calling for a new Brexit referendum – likely the biggest demonstration in the UK’s history and then there are all the firey protests in France.

The Cost of Corporate Uncertainty

When companies face elevated levels of uncertainty, they scale back and defer growth plans and may choose to shore up the balance sheet and reduce overhead rather than invest in opportunities for growth. So how are companies feeling?

A recent Duke CFO Global Business Outlook Survey found that nearly have of the CFOs in the US believe that the nation will be in a recession by the end of this year and 82% believe a recession will have begun before the end of 2020.

It isn’t just in the US as CFOs across the world believe their country will be in a recession by the end of this year – 86% in Canada, 67% in Europe, 54% in Asia and 42% in Latin America.

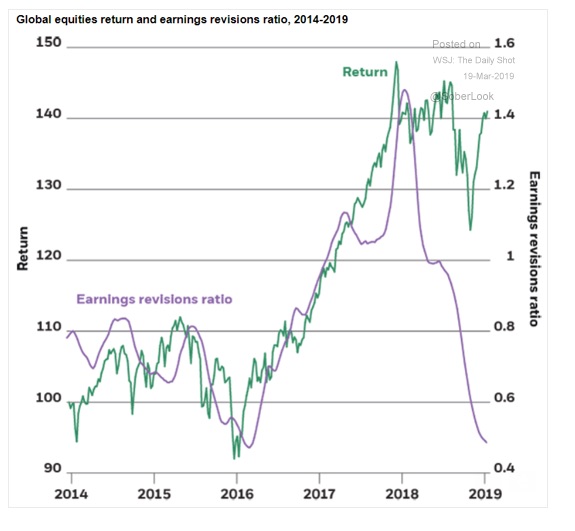
All that uncertainty is hitting the bottom line. Global earnings revision ratio has plunged while returns have managed to hold up so far.
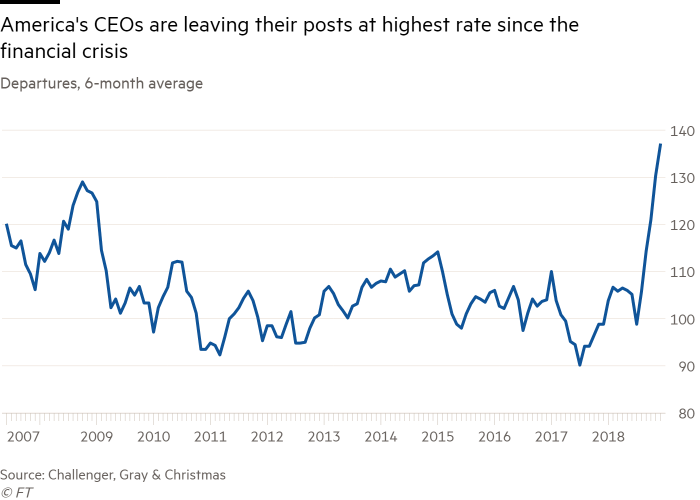
It isn’t just the CFO that is getting nervous as CEOs are quiting at the highest rates since the financial crisis – getting out at the top?

The GDP Pie

To sum it up, lots of unknowns of both the known and unknown variety and folks are seriously displeased with their political leaders.

So what do we actually know?

We know that US corporate profits after tax as a percent of GDP (say that five times fast) are at seriously elevated levels today, (nearly 40% above the 70+ year average) and have been since the end of the financial crisis. No wonder so many people are angry about the 1%ers.
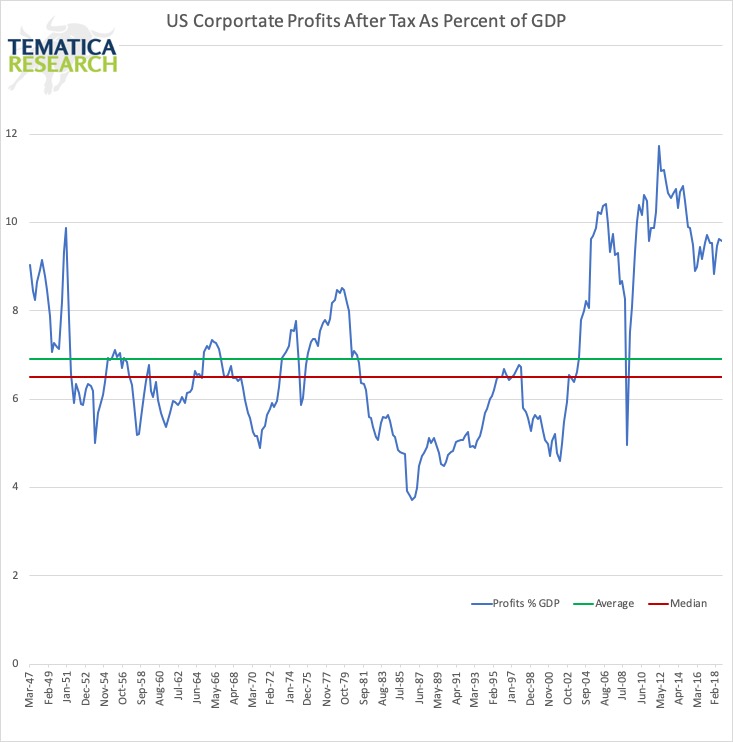
Corporate profits have never before in modern history been able to command such a high portion of GDP. This is unlikely to continue both because of competition, which tends to push those numbers down and public-policy. If the corporate sector is going to command a bigger piece of GDP, that means either households or the government is going to have to settle for a smaller portion.

It isn’t just the corporate sector that has taken a bigger piece of the GDP pie. Federal government spending to GDP reached an all-time high of 25% in the aftermath of the financial crisis and has remained well above historical norms since then.
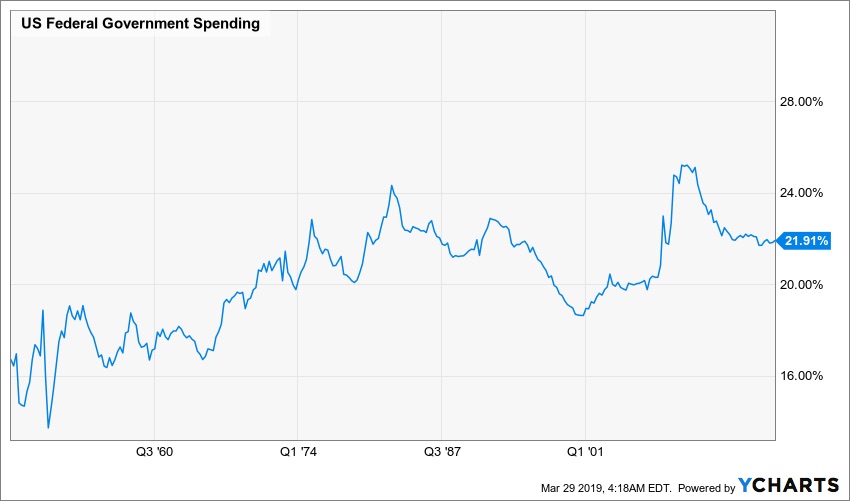
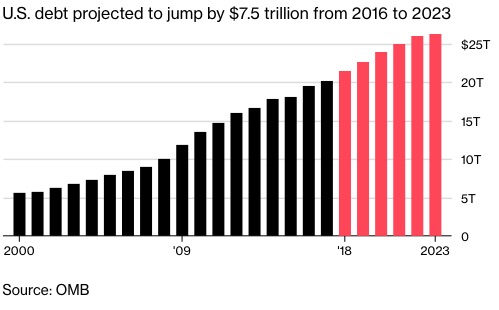
Given the level of dissatisfaction we discussed earlier concerning Capital Hill, it is highly unlikely that we will see a reduction in government deficit spending. When was the last time a politician said, “So you aren’t satisfied with what we are doing for you? Great, then we’ll just do less.”

That leaves the households with a smaller portion of the economic pie – evidence of which we can see in all the talk around how wage growth remains well below historical norms.
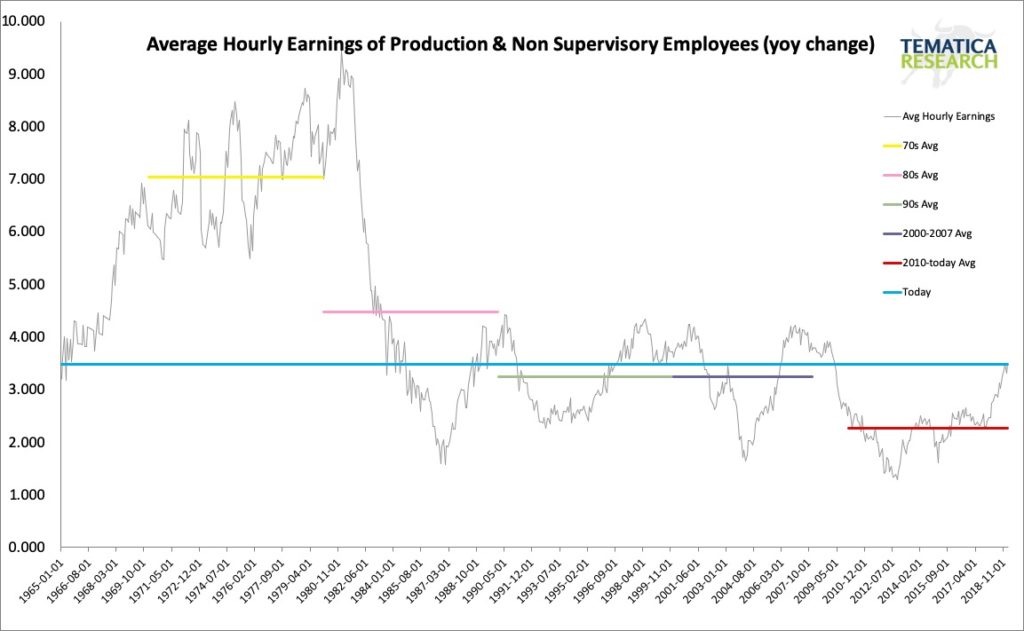
Reversion to the Mean

Given the current political climate, it is unlikely that government spending as a percent of GDP is going to decline in any material way, which leaves the battle between the corporate and household sector. Again, given the current political climate (hello congresswoman AOC) it is unlikely that the corporate sector is going to be able to maintain its current outsized share of GDP – the headlines abound with forces that are working to reduce corporate profit margins and as we’ve mentioned earlier, global earnings are being revised downward significantly. If the corporate sector’s portion of GDP falls to just its long-term average (recall today it is 40% above and has been above that average for about a decade), it would mean a significant decline in earnings.

The prices investors are willing to pay for those earnings are also well above historical norms.
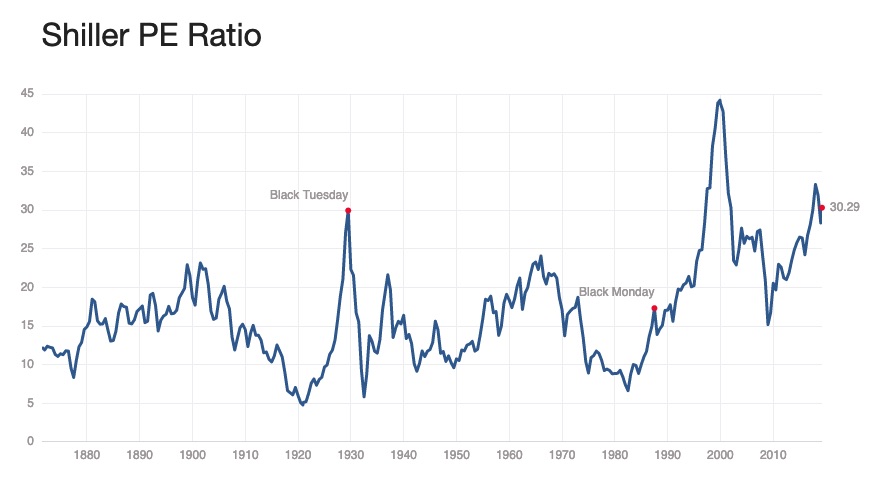
Today the Cyclically Adjusted PE Ratio (CAPE) is 82% above the long-term mean and 93% above the long-term median. What is the likelihood that this premium pricing will continue indefinitely? My bets are it won’t.

The bottom line is that the level of both corporate profits and what investors are willing to pay for those profits are well outside historical norms. If just one of those factors moves towards their longer-term average, we will see a decline in prices. If both adjust towards historical norms, the fall will be quite profound.

Weekly issue: Downside Protection Critical Amid These Uncertain Conditions

Weekly issue: Downside Protection Critical Amid These Uncertain Conditions

Key points inside this issue

  • Ahead of the Fed’s latest dot blot, 2019 GDP expectations move lower.
  • With uncertainties again on the rise, we reiterate our Buy rating on the ProShares Short S&P 500 ETF (SH) ahead of the upcoming March quarter earnings season.


Weakening GDP Expectations for the Remainder of 2019

Looking back over the last few weekly issues, it would be fair to say they were a little wordy. What can I say, between the economic data and earnings season, plus thematic data points, there was a lot to share over the last few weeks. Today, however, I’m going to cut to the point with my comments, largely because all investor eyes and ears are waiting to see and hear what Fed Chair Jerome Powell has to say about the speed of the US economy as they look for signs over what is coming next out of the Fed.

We’ve talked quite a bit about the slowing speed of the global economy, and even though there have been some individual bright spots across the aggregated hard and soft economic data from both government and third-party sources, the slowing speed is hard to ignore. Based on the published data, domestic GDP hit 3.1% last year, and as we’ve shared recently we’ve started to see the expectations for 2019 move lower in recent weeks. Per the March CNBC Fed Survey of 43 economists and Fed watcher findings, GDP for 2019 is now expected to clock in around 2.3% — not quite cut in half compared to 2018, but dramatically lower and significantly lower than folks were looking for in the back half of 2018.

When the Fed issues its post FOMC meeting statement today, the focus will more than likely not be on the interest rate decision – almost no one expects a hike. Instead, rapt attention will be paid to the Fed’s updated economic dot plot, which will reveal how it sees the US economy shaping up. Let’s remember that one unofficial aspect of the Fed’s job is to be a cheerleader for the economy, so it becomes a question of “if they are cutting their GDP forecast” how deep of a cut could we really see?

Culprits of the slowing economy and these cuts include aspects of our Middle-Class Squeeze investing theme as consumers in the US grapple with debt levels that have risen precipitously over the last several years. The consumer spending tailwind associated with our Living the Life investing theme appears to be slowing some given the rising debt levels of Chinese consumers. Governments have also run up debt in recent years as the current business cycle has grown longer in the tooth. And of course, there is the impact of currency as well as political and trade uncertainties, including the pushout of US-China trade talks to June.


Downside Protection is Key Under These Circumstances

In a little over 10 days, we will be exiting March, entering the second quarter and beginning the earnings season dance all over again. My concern is that given the above and the several unknowns therein, we are poised to see another earnings season during which aggregate expectations will be adjusted lower. Case in point, with the  US-China trade agreement timetable slipping and slipping, it becomes rather difficult for a company to factor any resolution into its guidance, especially when the terms of the agreement are unknown.

Despite all of the above, the domestic stock market has continued to chug higher, once again approaching overbought levels, even though 2019 EPS cuts for the S&P 500 have made the market even more expensive than it was as we exited 2018.

The potential poster child for this is FedEx (FDX), which saw its shares take a fall last night after the company cut its annual profit forecast for the second time in three months due to slowing global growth, rising costs from a 2016 acquisition in Europe and questions over its ability to withstand U.S.-China trade tensions and uncertainty over the U.K.’s exit from the European Union.

Not to go all Groundhog Day on you, but this looks increasingly like the situation we saw in December when I added the ProShares Short S&P 500 ETF (SH) to the Select List. If we didn’t have those shares to offer some downside protection for what lies ahead, I would be adding them today. If you don’t have any of those shares in your holdings, my advice would be to add some. Much like insurance, you may not know exactly when you’ll need it, but you’ll be happy to have it when something goes bad.

  • With uncertainties again on the rise, we reiterate our Buy rating on the ProShares Short S&P 500 ETF (SH) ahead of the upcoming March quarter earnings season.


Weekly Issue: Talking Thematics, Boeing and Retail Sales

Weekly Issue: Talking Thematics, Boeing and Retail Sales

Key points inside this issue

  • We are issuing a Buy on and adding shares of Energous Corp. (WATT) to the Select List as part of our Disruptive Innovators investing theme with an $11 price target.
  • We will continue to patiently hold Thematic Leader Del Frisco’s Restaurant Group (DFRG) shares as the Board continues to review potential strategic alternatives.


I’m just back from some meeting in New York, and it was a busy trip that included visits with Yahoo Finance and Cheddar to discuss the January retail sales report and the gyrations in the Dow Jones Industrial Average given the issues and concerns that have erupted with Boeing (BA) following another 737 MAX aircraft crash over the weekend. You can watch my appearance on Yahoo Finance here and the one with Cheddar here, but quickly on those two items, while the January retail sales report was better than expected, the headline figure for December was revised lower from the first negative print we received.

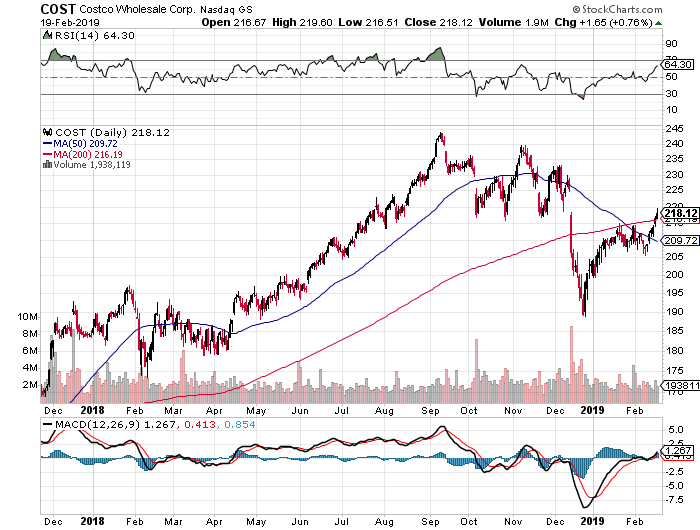
Also, we’ve started to get February same-store comp sales and from a growing number of retailers, those figures have been negative. And you’ve probably noticed that we are once again seeing a sea of store closures being announced by retailers. If you haven’t, I walked through some of these on last week’s Cocktail Investing podcast, which you can listen to here. As I pointed out on my appearances on Yahoo Finance and Cheddar, we are seeing a bifurcation in the retail land. Those that are riding the tailwinds associated with our Living the Life and Middle-Class Squeeze investing themes are thriving, while those caught in between – Macy’s (M), Gap (GPS), L Brands (LB) and others – are struggling once again. We here at Tematica have talked about rising consumer debt and delinquency levels, and I continue to see those increasingly cash-strapped consumers turning to off-price retailers and warehouse clubs, like Middle-Class Squeeze leader Costco Wholesale (COST) in the coming months.

With regard to Boeing, while it isn’t a Thematic Leader or on the Select List, the demand for its aircraft is being powered by international air travel, particularly out of Asia, which fits very well with our New Global Middle-Class investing theme. The issue plaguing the company and its shares is two 737 MAX planes have crashed in a relatively short time, and this has led several countries to ground those planes as issues behind the most recent crash are sought. This has raised several questions for Boeing as the 737 family is an important one, accounting for 80% of its aircraft backlog entering 2019 and 58% of its January order book. How long will those planes be grounded? What does it mean for future 737 family orders and production levels that drive revenue, profits, and earnings?

In the past Boeing has quickly dealt with situations such as these, and it has already announced an extensive change to the flight-control system in the 737 MAX aircraft. I’ll continue to watch these developments and gauge the impact to be had on2019 expectations. Odds are they will be coming in from where they were just a few weeks ago. In the past, these situations, while dreadful, have offered a favorable entry point to BA shares provided the timing is right. Right now, it seems to be a tad too early, but with upside to $450, it’s one to watch closely.

On a side note, the Boeing issue highlights a key difference in how the major market indices are constructed. BA shares account for just under 10% of Dow Jones Industrial Average, which means the recent stock pressure has weighed on that index heavily. This explains the wide difference this week between how the Dow has performed vs. the S&P 500, which only has 0.9% exposure to Boeing shares. That’s a huge difference, and it points to understanding the ins and outs of the indices for not only the market but for any passive ETFs that one may own. In the case of Boeing, there are a number of ETFs that hold the shares, but one of the ones with sizable exposure is the ETFMG Drone Economy Strategy ETF (IFLY). That ETF, which looks to invest in drones, holds 4.96% of its assets in BA shares, even though its revenues from drones and other autonomous systems are so small they aren’t even broken out by the company in SEC filings.


Tematica Investing


Powering up the Select List with WATT shares

In our increasingly connected society, two of the big annoyances we must deal with are keeping our devices charged and all the cords we need to charge them. When I upgraded my iPhone to one of the newer models, I was pleasantly surprised by the ease of charging it wirelessly by laying it on a charging disc. Pretty easy.

I’m hardly alone in appreciating this convenience, and we’ve heard that companies ranging from Tesla Inc. (TSLA) to Apple Inc. (AAPL) are looking to bring charging pads to market. That means a potential sea change in how we charge our devices is in the offing, which means a potential growth market for a company that has the necessary chipsets to power one or more of those pads. In other words, if there were no such chipsets, we would not be able to charge wirelessly.

Off to digging, I went to see if there is a pure-play company that fits this Disruptive Innovator investment theme charge (and yes, that was a very poor pun on my part.) What I turned up was Energous Corp. (WATT) and its WattUp solution. WattUp consists of proprietary semiconductor chipsets, software and antennas that enable radio frequency (RF)-based, wire-free charging of electronic devices. Like the charging disc I have, and the ones depicted by Apple, WattUp is both a contact-based charging and at-a-distance charging solution, which means all we need do is lay our wireless devices down be it on a disc, pad or other contraption to charge them. In November 2016, Energous entered into a Strategic Alliance Agreement with Dialog Semiconductor (DLGNF), under which Dialog manufactures and distributes IC products incorporating its wire-free charging technology.

Dialog happens to be the exclusive supplier of these Energous products for the general market and Dialog is also a well-known power management supplier to Apple across several products, including the iPhone. Indeed, last week Dialog bucked the headline trend of late and shared that it isn’t seeing a demand hit from Apple after fellow suppliers Lumentum Holdings Inc. (LITE) and Qorvo Inc. (QRCO) cut guidance earlier this week.

On its September quarter earnings call, Dialog shared it was awarded a broad range of new contracts, including charging across multiple next-generation products assets, with revenue expected to be realized starting in 2019 and accelerating into 2020. I already can feel several mental carts getting ahead of the horse as some think, “Ah, Energous might be the technology that will power Apple’s wireless charging solution!”

Adding fuel to that fire, on its September quarter earnings conference call Energous shared that “given the most recent advances in our core technology” its relationship with its key strategic partner – Dialog – “has now progressed beyond development, exploration and testing to actual product engineering.”

Since then, there have been several additional developments:

  • In late December, Energous announced its first commercial product to receive FCC approval, the WattUp-enabled personal sound amplification products (PSAPs) from Delight. Energous’ WattUp wireless technology allows the Delight PSAP to charge on a charging pad. The products are now certified to be marketed and sold in the United States.
  • At CES in January, Energous launched Wireless Charging 2.0 and demonstrated with Deutsche Telekom (DTEGY) a transmitter design that can charge multiple electronic devices at a distance.
  • We are hearing renewed chatter that Apple’s (AAPL) delayed wireless charging solution, known as the Airpower charging mat, is likely to hit shelves in the coming months. As I pointed out, Apple has long used Dialog Semiconductor (DLGNF) for its power solutions and Dialog is the exclusive supplier for Energous products. In early January, Apple supplier Luxshare Precision initiated AirPower production and that would seem to confirm rumored timetables that AirPower would begin shipping during the first half of 2019.
  • In the company’s December quarter earnings release, Energous shared that on the back of a favorable showing at the CES 2019 and Mobile World Congress 2019, “no less than 10 companies currently tracking for product launches to the consumer in 2019 with chip sales starting in the first half of the year and ramping in the second half.”

Taken together these recent developments point to robust revenue growth for Energous (WATT) compared to the $1.1 million-$1.4 million range between what was reported in 2017 and what’s expected for 2018. Current consensus estimates have the company delivering revenue of $94 million in 2020, which reflects a full year of shipping product. Two points of caution on that forecast: First, it comes from a combination of two Wall Street analysts, which is not a wide enough number that inspires 100% confidence; Second, Energous is on the cusp of going from essentially a start-up company to a real one, and odds are there will be fits and starts, delays and pushouts along the way. This will require us to be patient with the shares, but it also means continuously evaluating the competitive landscape.

As that revenue ramp and bottom-line improvement come to fruition, valuation metrics are likely to move higher for WATT shares. There is also potential upside following the eventual teardown analysis of Apple’s Airpower charging mat, which could very well bring the Apple halo to WATT.

So why now with WATT shares?

Alongside the company’s December quarter earnings report, it also completed a $25 million common stock offering of 3.3 million shares priced “in the hole” at $7.70. I say “in the hole” because prior to that offering the shares were trading well above $9. For some, that was clearly a disappointment, especially given the $20.1 million the company had in cash on its balance sheet exiting 2018. Odds are the company entered into this transaction in order to have sufficient capital as it heads into the oncoming production ramp to meet demand from these “no less than 10 customers.” Not a great transaction, but also not a horrible thing given that it likely heads off an even more painful one later on. For us, it’s given us the opportunity to get into WATT shares at a far better price point.

Our 12-18-month price target on WATT shares is $11, which equates to an enterprise value to 2020 revenue multiple of 4.0x vs. the current 2.4x multiple. If you’re thinking the combination of revenue growth and that valuation framework could make Energous a takeout candidate, I would have to agree.

  • We are issuing a Buy on and adding shares of Energous Corp. (WATT) to the Select List as part of our Disruptive Innovators investing theme with an $11 price target.


Del Frisco’s delivers, but no word on the strategic alternatives

Yesterday, Living the Life Thematic Leader Del Frisco’s (DFRG) reported its December quarter results, which were modestly ahead of expectations. On the company’s earnings call it reviewed the usual metrics and shared a long-term favorable outlook, which candidly was expected. What the company did not say, however, was anything about the strategic initiatives it is reviewing. Recall that several months ago, the company added a new Board member with investment banking experience to spearhead this activity. Given the level of steak house M&A that has happened in recent years, due in part to the more defensive nature of higher-end dining vs. casual restaurants, they’ve been a sought-after asset.

With Just One More Restaurant, the company that licenses the Palm Steakhouse name, filing for Chapter 11 late last week due to fiduciary misconduct, there is one less prospect to be had. Much like a game of musical chairs, as the number of seats or in this case steak house businesses drop, they become more valuable. We will continue to patiently hold DFRG shares as the Board continues to review the alternatives. Should a transaction fail to emerge, I am inclined to revisit the company’s position on the Thematic Leader board.

  • For now, we will continue to patiently hold Thematic Leader Del Frisco’s Restaurant Group (DFRG) shares as the Board continues to review potential strategic alternatives.


Doubling Down on Digital Infrastructure Thematic Leader

Doubling Down on Digital Infrastructure Thematic Leader

Key point inside this issue

  • We are doubling down on Dycom (DY) shares on the Thematic Leader board and adjusting our price target to $80 from $100, which still offers significant upside from our new cost basis as the 5G and gigabit fiber buildout continues over the coming quarters.

We are coming at you earlier than usual this week in part to share my thoughts on all of the economic data we received late last week.


Last week’s data confirms the US economy is slowing

With two-thirds of the current quarter behind now in the books, the continued move higher in the markets has all the major indices up double-digits year to date, ranging from around 11.5-12.0%% for the Dow Jones Industrial Average and the S&P 500 to nearly 18% for the small-cap heavy Russell 2000. In recent weeks we have discussed my growing concerns that the market’s melt-up hinges primarily on U.S.-China trade deal prospects as earnings expectations for this year have been moving lower, dividend cuts have been growing and the global economy continues to slow. The U.S. continues to look like the best economic house on the block even though it, too, is slowing.

On Friday, a round of IHS Markit February PMI reports showed that three of the four global economic horsemen — Japan, China, and the eurozone — were in contraction territory for the month. New orders in Japan and China improved but fell in the eurozone, which likely means those economies will continue to slug it out in the near-term especially since export orders across all three regions fell month over month. December-quarter GDP was revealed to be 2.6% sequentially, which equates to a 3.1% improvement year over year but is down compared to the 3.5% GDP reading of the September quarter and 4.2% in the June one.  Slower growth to be sure, but still growing in the December quarter.

Before we break out the bubbly, though, the IHS Markit February U.S. Manufacturing PMI fell to its lowest reading in 18 months as rates of output and new order growth softened as did inflationary pressures. This data suggest the U.S. manufacturing sector is growing at its slowest rate in several quarters, as did the February ISM Manufacturing Index reading, which slipped month over month and missed expectations. Declines were seen almost across the board for that ISM index save for new export orders, which grew modestly month over month. The new order component of the February ISM Manufacturing Index dropped to 55.5 from 58.2 in January, but candidly this line item has been all over the place the last few months. The January figure rebounded nicely from 51.3 in December, which was down sharply from 61.8 in November. This zig-zag pattern likely reflects growing uncertainty in the manufacturing economy given the pace of the global economy and uncertainty on the trade front. Generally speaking though, falling orders translate into a slower production and this means carefully watching both the ISM and IHS Markit data over the coming months.

In sum, the manufacturing economy across the four key economies continued to slow in February. On a wider, more global scale, J.P. Morgan’s Global Manufacturing PMI fell to 50.6 in February, its lowest level since June 2016. Per J.P. Morgan’s findings, “the rate of expansion in new orders stayed close to the stagnation mark,” which suggests we are not likely to see a pronounced rebound in the near-term. We see this as allowing the Fed to keep its dovish view, and as we discuss below odds are it will be joined by the European Central Bank this week.

Other data out Friday included the December readings for Personal Income & Spending and the January take on Personal Income. The key takeaway was personal income fell for the first time in more than three years during January, easily coming in below the gains expected by economists. Those pieces of data not only help explain the recent December Retail Sales miss but alongside reports of consumer credit card debt topping $1 trillion and record delinquencies for auto and student loans, point to more tepid consumer spending ahead. As I’ve shared before, that is a headwind for the overall US economy but also a tailwind for those companies, like Middle-class Squeeze Thematic Leader Costco Wholesale (COST), that help consumers stretch the disposable income they do have.

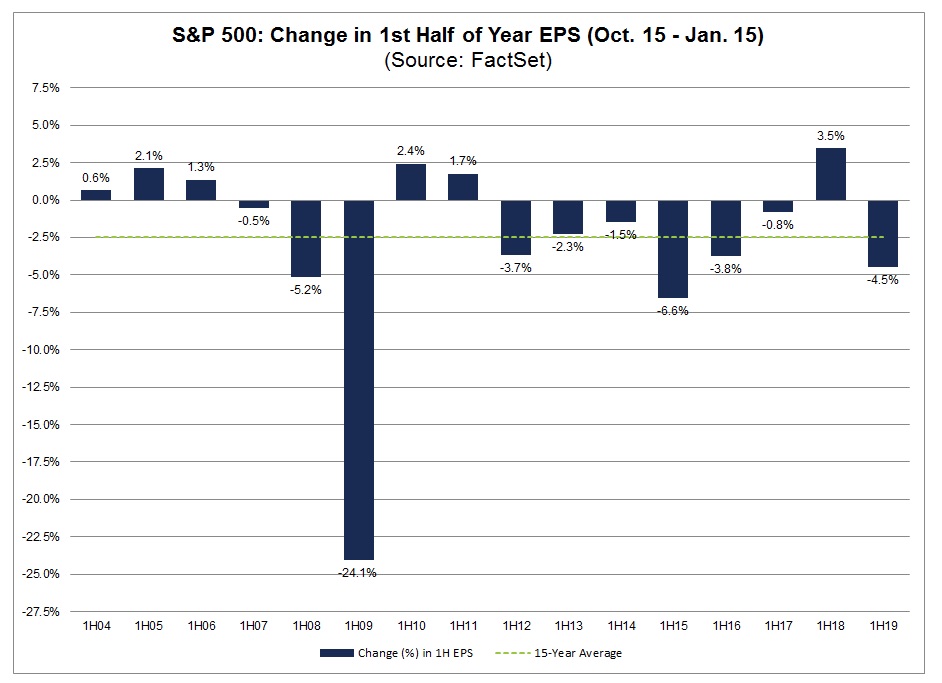
We have talked quite a bit in recent Tematica Investing issues about revisions to S&P 500 2019 EPS estimates, which at last count stood at +4.7% year over year, down significantly from over +11% at the start of the December quarter. Given the rash of reports last week – more than 750 in total –  we will likely see that expected rate of growth tweaked a bit lower.

Putting it all together, we have a slowing U.S. and global economy, EPS cuts that are making the stock market incrementally more expensive as it has moved higher in recent weeks, and a growing number of dividend cuts. Clearly, the stock market has been melting up over the last several weeks on increasing hopes over a favorable trade deal with China, but last week we saw President Trump abruptly end the summit with North Korea’s Kim Jong Un with no joint agreement after Kim insisted all U.S. sanctions be lifted on his country. This action spooked the market, leading some to revisit the potential for a favorable trade deal between the U.S. and China.

Measuring the success of any trade agreement will hinge on the details. Should it fail to live up to expectations, which is a distinct possibility, we could very well see a “buy the rumor, sell the news” situation arise in the stock market. As I watch for these developments to unfold, given the mismatch in the stock market between earnings and dividends vs. the market’s move thus far in 2019 I will also be watching insider selling in general but also for those companies on the Thematic Leader Board as well as the Tematica Select List. While insiders can be sellers for a variety of reasons, should we see a pronounced and somewhat across the board pick up in such activity, it could be another warning sign.


What to Watch This Week

This week we will see a noticeable drop in the velocity of earnings reports, but we will still get a number of data points that investors and economists will use to triangulate the speed of the current quarter’s GDP relative to the 2.6% print for the December quarter. The consensus GDP forecast for the current quarter is for a slower economy at +2.0%, but we have started to see some economists trim their forecasts as more economic data rolls in. Because that data has fallen shy of expectations, it has led the Citibank Economic Surprise Index (CESI) to once again move into negative territory and the Atlanta Fed’s GDPNow current quarter forecast now sat at 0.3% as of Friday.

On the economic docket this week, we have December Construction Spending, ISM’s February Non-Manufacturing Index reading, the latest consumer credit figures and the February reports on job creation and unemployment from ADP (ADP) and the Bureau of Labor Statistics. With Home Depot (HD) reporting relatively mild December weather, any pronounced shortfall in December Construction Spending will likely serve to confirm the economy is on a slowing vector. Much like we did above with ISM’s February Manufacturing Index we’ll be looking into the Non-Manufacturing data to determine demand and inflation dynamics as well as the tone of the services economy.

On the jobs front, while we will be watching the numbers created, including any aberration owing to the recent federal government shutdown, it will be the wage and hours worked data that we’ll be focusing on. Wage data will show signs of any inflationary pressures, while hours worked will indicate how much labor slack there is in the economy. The consumer is in a tighter spot financially speaking, which was reflected in recent retail sales and personal spending data. Recognizing the role consumer spending plays in the overall speed of the U.S. economy, we will be scrutinizing the upcoming consumer credit data rather closely.

In addition to the hard data, we’ll also get the Fed’s latest Beige Book, which should provide a feel for how the regional economies are faring thus far in 2019. Speaking of central bankers, next Wednesday will bring the results of the next European Central Bank meeting. Given the data depicted in the February IHS Markit reports we discussed above, the probability is high the ECB will join the Fed in a more dovish tone.

While the velocity of earnings reports does indeed drop dramatically next week, there will still be several reports worth digging into, including Ross Stores (ROST), Kohl’s (KSS), Target (TGT), BJ’s Wholesale (BJ), and Middle-class Squeeze Thematic Leader Costco Wholesale (COST) will also issue their latest quarterly results. Those reports combined with the ones this week, including solid results from TJX Companies (TJX) last week should offer a more complete look at consumer spending, and where that spending is occurring. Given the discussion several paragraphs above, TJX’s results last week, and the monthly sales reports from Costco, odds are quite good that Costco should serve up yet another report showcasing consumer wallet share gains.

Outside of apparel and home, reports from United Natural Foods (UNFI) and National Beverage (FIZZ) should corroborate the accelerating shift toward food and beverages that are part of our Cleaner Living investing theme. In that vein, I’ll be intrigued to see what Tematica Select List resident International Flavors & Fragrances (IFF) has to say about the demand for its line of organic and natural solutions.

The same can be said with Kroger (KR) as well as its efforts to fend off Thematic King Amazon (AMZN) and Walmart (WMT). Tucked inside of Kroger’s comments, we will be curious to see what the company says about digital grocery shopping and delivery. On Kroger’s last earnings conference call, Chairman and CEO Rodney McMullen shared the following, “We are aggressively investing to build digital platforms because they give our customers the ability to have anything, anytime, anywhere from Kroger, and because they’re a catalyst to grow our business and improve margins in the future.” Now to see what progress has been achieved over the last 90 or so days and what Kroger has to say about the late-Friday report that Amazon will launch its own chain of supermarkets.


Tematica Investing

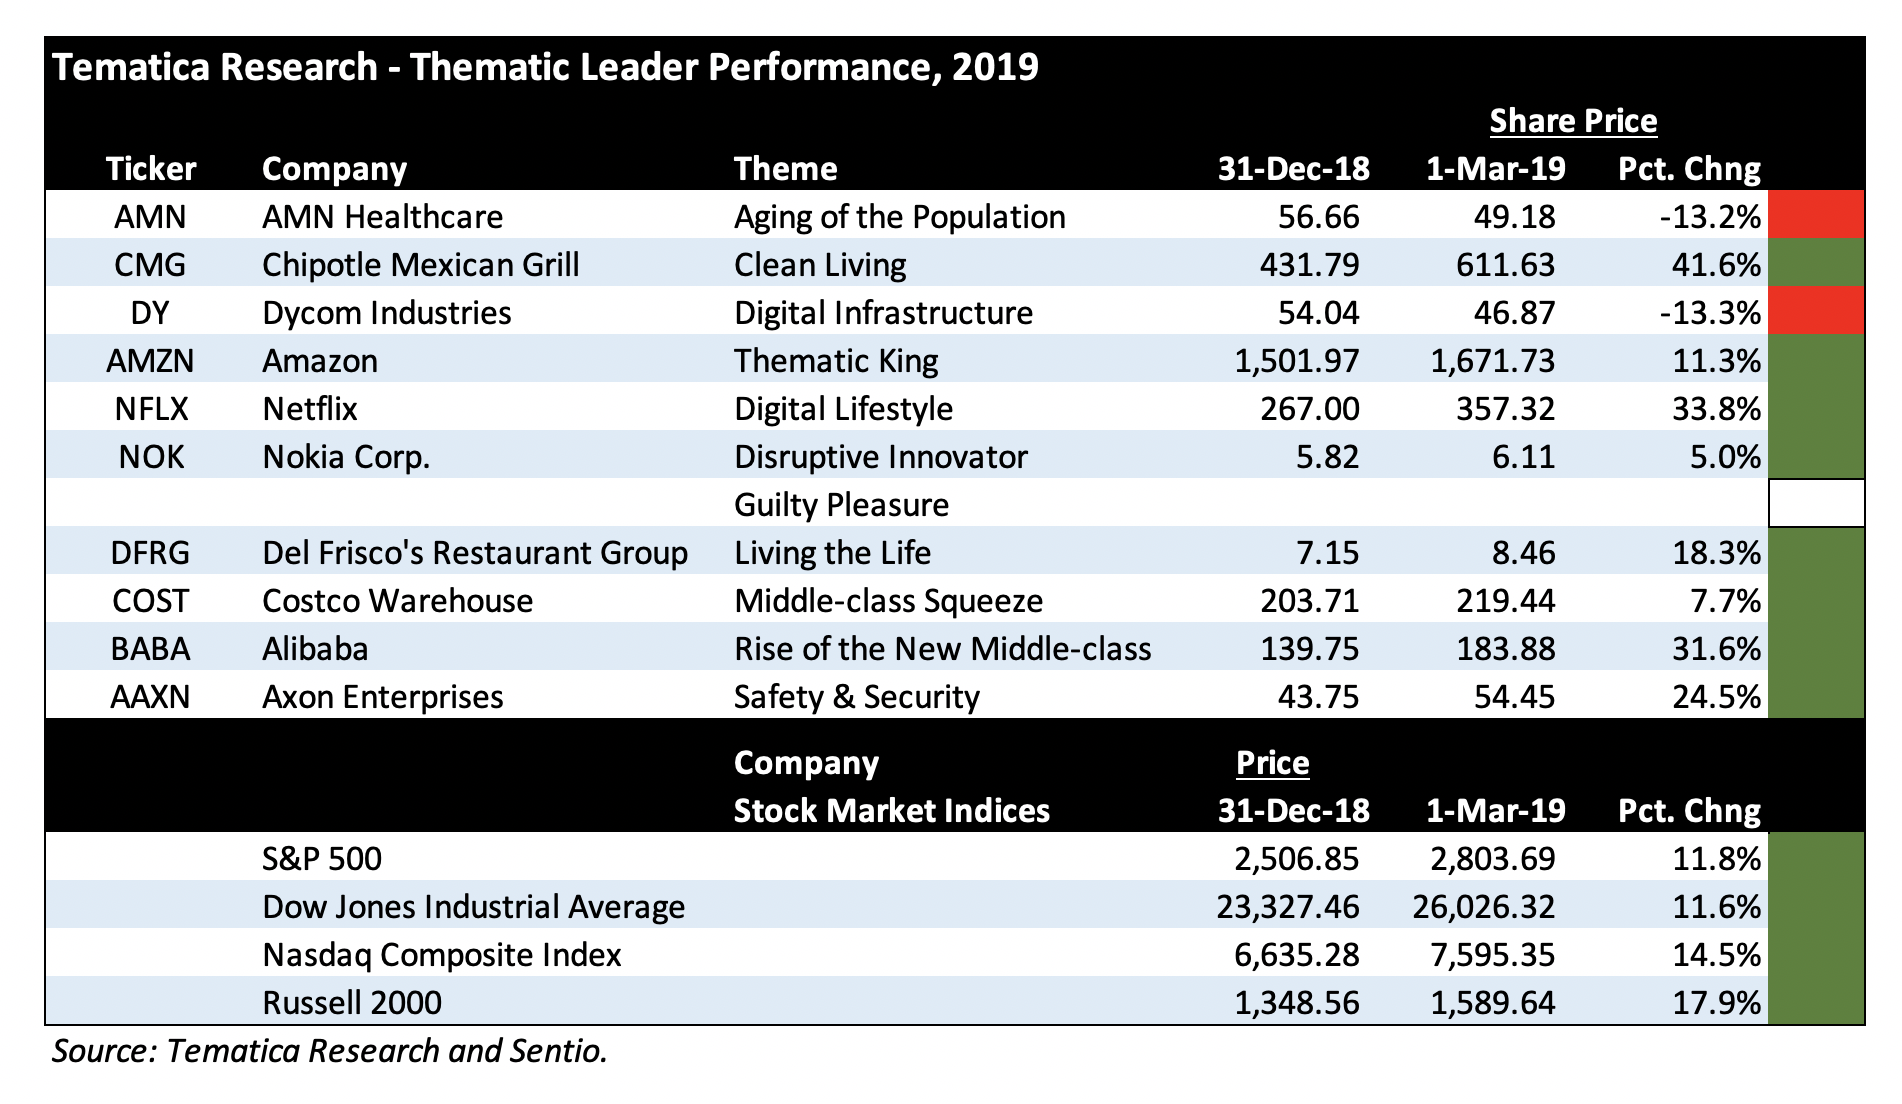
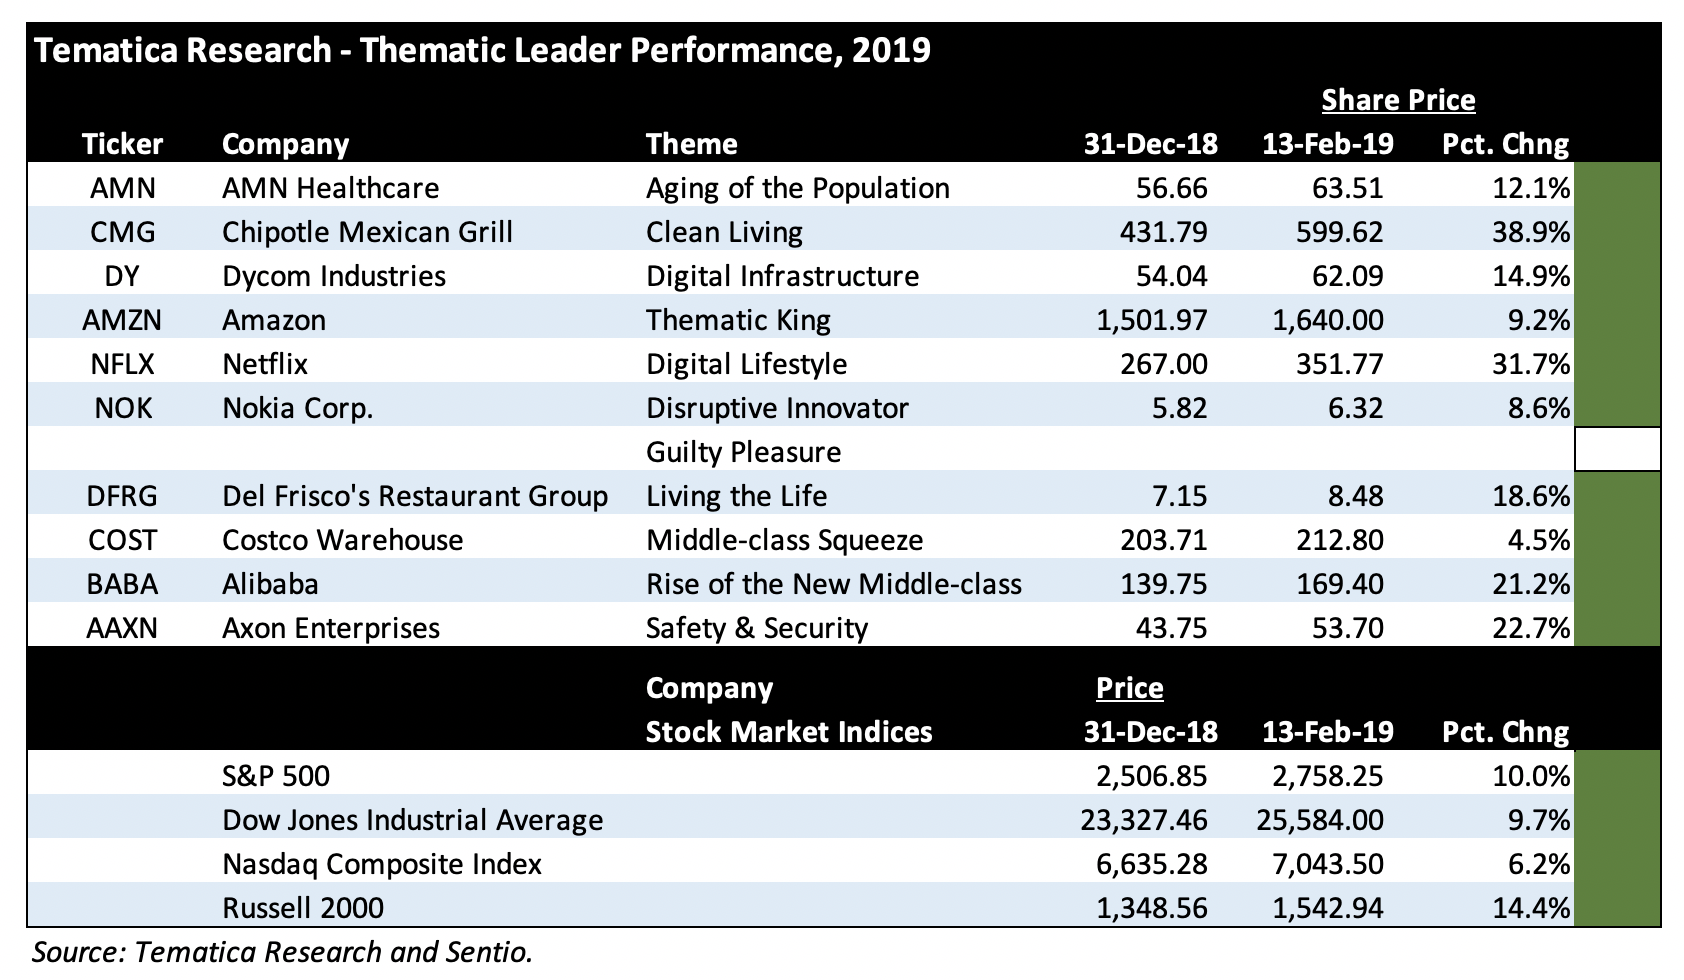
As you can see in the chart above, for the most part, our Thematic Leaders have been delivering solid performance. Shares of Costco Wholesale (COST) and Nokia (NOK) are notable laggards, but with Costco’s earnings report later this week which will also include its February same-store sales, I see the company’s business and the shares once again coming back into investor favor as it continues to win consumer wallet share. That was clearly evident in its December and January same-store sales reports. With Nokia, coming out of Mobile World Congress 2019 last week, we have confirmation that 5G is progressing, with more network launches coming and more devices coming as well in the coming quarters. We’ll continue to be patient with NOK shares.


Adding significantly to our position in Thematic Leader Dycom Industries

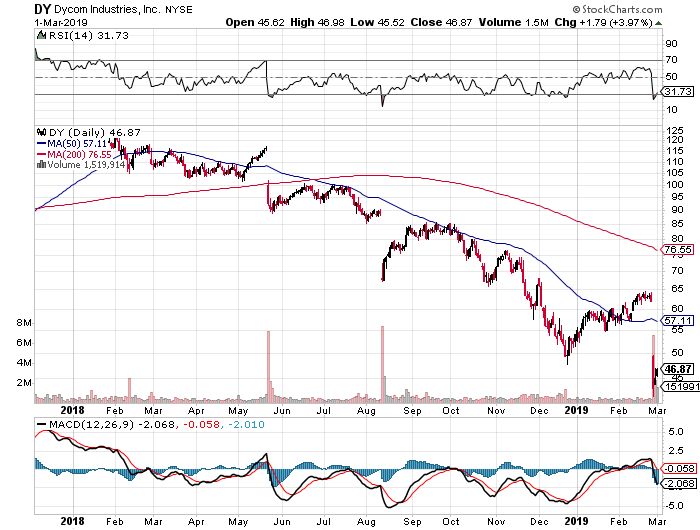
There are two positions on the leader board – Aging of the Population AMN Healthcare (AMN) and Digital Infrastructure Dycom Industries (DY) – that are in the red. The recent and sharp drop in Dycom shares follows the company’s disappointing quarterly report in which costs grew faster than 14.3% year over year increase in revenue, pressuring margins and the company’s bottom line. As we’ve come to expect this alongside the near-term continuation of those margin pressures, as you can see below, simply whacked DY shares last week, dropping them into oversold territory.


When we first discussed Dycom’s business, I pointed out the seasonal tendencies of its business, and that likely means some of the February winter weather brought some added disruptions as will the winter weather that is hitting parts of the country as you read this. Yet, we know that Dycom’s top customers – AT&T (T), Verizon (VZ), Comcast (CMCSA) and CenturyLink (CTL) are busy expanding the footprint of their connective networks. That’s especially true with the 5G buildout efforts at AT&T and Verizon, which on a combined basis accounted for 42% of Dycom’s January quarter revenue.

Above I shared that coming out of Mobile World Congress 2019, commercial 5G deployments are likely to be a 2020 event but as we know the networks, base stations, and backhaul capabilities will need to be installed ahead of those launches. To me, this strongly suggests that Dycom’s business will improve in the coming quarters, and as that happens, it’s bound to move down the cost curve as efficiencies and other aspects of higher utilization are had. For that reason, we are using last week’s 26% drop in DY shares to double our position size in DY shares on the Thematic Leader board. This will reduce our blended cost basis to roughly $64 from the prior $82. As we buy up the shares, I’m also resetting our price target on DY shares to $80, down from the prior $100, which offers significant upside from the current share price and our blended cost basis.

If you’re having second thoughts on this decision, think of it this way – doesn’t it seem rather strange that DY shares would fall by such a degree given the coming buildout that we know is going to occur over the coming quarters? If Dycom’s customers were some small, regional operators I would have some concerns, but that isn’t the case. These customers will build out those networks, and it means Dycom will be put to work in the coming quarters, generating revenue, profits, and cash flow along the way.

In last week’s Tematica Investing I dished on Warren Buffett’s latest letter to Berkshire Hathaway (BRK.A) shareholders. In thinking about Dycom, another Buffett-ism comes to mind – “Opportunities come infrequently. When it rains gold, put out the bucket, not the thimble.” Since this is a multi-quarter buildout for Dycom, we will need to be patient, but as we know for the famous encounter between the tortoise and the hare, slow and steady wins the race.

  • We are doubling down on Dycom (DY) shares on the Thematic Leader board and adjusting our price target to $80 from $100, which still offers significant upside from our new cost basis as the 5G and gigabit fiber buildout continues over the coming quarters.


As the pace of earnings slows, over the next few weeks I’ll not only be revisiting the recent 25% drop in Aging of the Population Thematic Leader AMN Healthcare to determine if we should make a similar move like the one we are doing with Dycom, but I’ll also be taking closer looks at wireless charging company Energous Corp. (WATT) and The Alkaline Water Company (WTER). Those two respectively fall under our Disruptive Innovators and Cleaner Living investing themes. Are they worthy of making it onto the Select List or bumping one of our Thematic Leaders? We’ll see…. And as I examine these two, I’m also pouring over some candidates to fill the Guilty Pleasure vacancy on the leader board.


WEEKLY ISSUE: Companies continue to serve up weaker guidance

WEEKLY ISSUE: Companies continue to serve up weaker guidance

Key points inside this issue

  • The outlook for earnings continues to wane even as the trade-related market melt-up continues.
  • Our price target on Amazon (AMZN) shares remains $2,250.
  • Our price target on Alphabet (GOOGL) shares remains$1,300.
  • Our price target on Costco Wholesale (COST) shares remains $250.
  • Our price target on Universal Display (OLED) shares remains $125.
  • Our price target on Nokia (NOK) shares remains $8.50


The outlook for earnings continues to wane even as the trade-related market melt-up continues

Domestic stocks continued to trend higher last week as the December-quarter issues that plagued them continued to be dialed back. Said another way, the expected concerns — the Fed, the economy, the government shutdown, geopolitical issues in the eurozone, and U.S.-China trade talks — haven’t been as bad as feared a few months ago.

In recent weeks, we have seen the Fed take a more dovish approach and last week’s data, which included benign inflation numbers and fresh concerns over the speed of the economy following the headline December Retail Sales Report and Friday’s manufacturing-led contraction in the January Industrial Production Index, reaffirm the central bank is likely to stand pat on interest rate hikes. We see both of those reports, however, feeding worries over increasing debt-laden consumers and a slowing U.S. economy. 

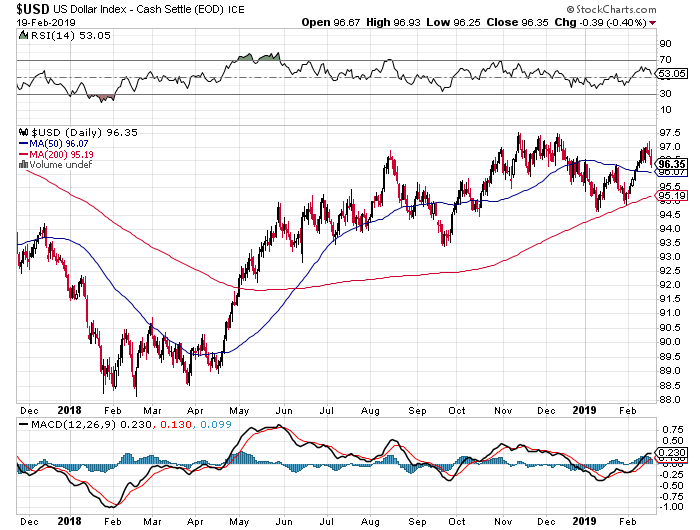
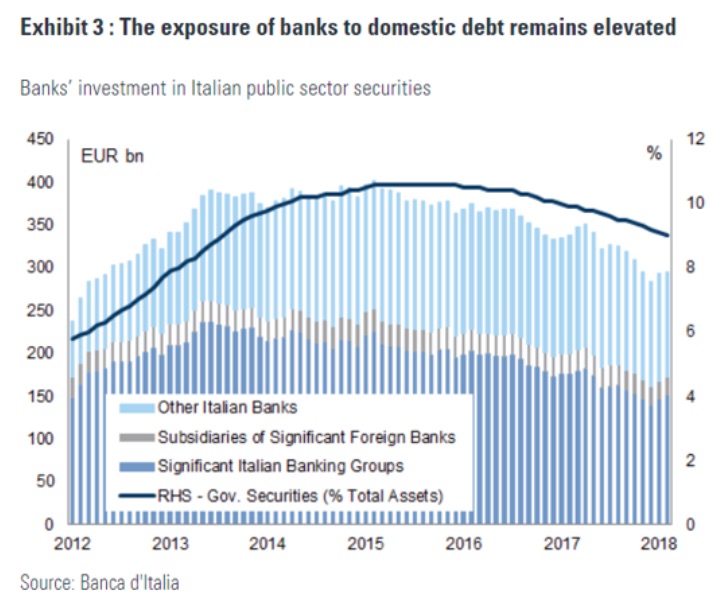
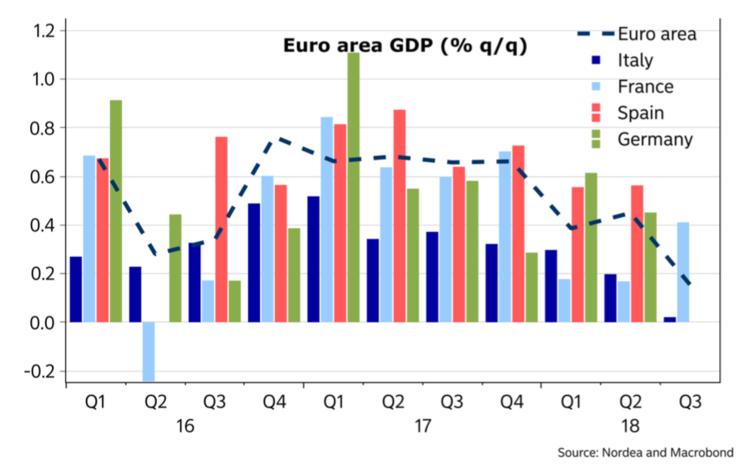
Granted, economic data from around the globe suggest the U.S. economy remains one of the more vibrant ones on a relative basis, which also helps explain both the melt-up in both the domestic stock market as well as the dollar. On Thursday we learned that economic growth in the eurozone was basically flat on a sequential basis in the December quarter, rising a meager 0.2%. Year-over-year growth stood at just 1.2% for the final quarter of 2018. This came after news that the eurozone economic powerhouse that is Germany had no growth itself in the fourth quarter after a contraction of 0.2% in the third quarter. Italy experienced its second consecutive quarter of economic contraction, putting it in a technical recession.


All of this put further downward pressure on the euro versus the U.S. dollar, which means dollar headwinds remain for multinational companies. And we still have another major headwind that is the lack of any Brexit deal. With three pro-EU Conservatives having resigned this morning from Prime Minister Theresa May’s party to join a new group in Parliament, there is no an even slimmer chance of Brexit deal being put in place ahead of next week.

So, what has been fueling the rebound in the stock market?

Among other factors, the deal to avoid another federal government shutdown, which was followed by the “national emergency” declaration that will potentially give President Trump access to roughly $8 billion to fund a border wall. We’ll see how this all plays out in the coming days, alongside the next step in U.S.-China trade talks that are being held this week in Washington. While “much work remains” on the working Memorandum of Understanding, trade discussions last week focused on several of the larger structural issues that we’ve been more concerned about — forced technology transfer, intellectual property rights, cyber theft, and currency.

Early this morning, it’s being reported that President Trump is softening on the March 1 phase in date for the next round of tariff increases, which is likely to give the market some additional trade optimism and see it move higher. We remain hopeful, but we expect there to be several additional steps to go that will set the stage for any final agreement that will likely be consummated at a meeting between Presidents Trump and Xi. And yes, the final details will matter and will determine if we get a “buy the rumor, sell the news” event.

Even as the trade war continues at least for now, we continue to see companies positioning themselves for the tailwinds associated with Living the Life and New Global Middle-class investing theme opportunities to be had in China. If you missed a recent Thematic Signal discussing how Hilton (HLT) is doing just that, you can find it here.

And then there are earnings

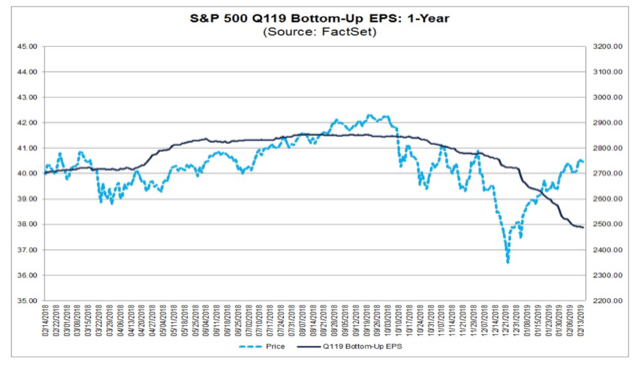
Over the last several weeks, we’ve been tracking and sharing the declining outlook for S&P 500 earnings for 2019. As we closed last week, roughly 80% of the S&P 500 companies had reported their quarterly earnings and issued outlooks. In aggregating the data, the new consensus calls for a 2.2% year-over-year decline in earnings for the current quarter, low single-digit earnings growth in the June and September quarters, and 9.1% growth in the December quarter. In full, the S&P 500 group of companies are now expected to grow their collective 2019 EPS by 5% to $169.53, which means that as those expectations have fallen over the last several months, the 2019 move in the market has made the stock market that much more expensive.

In my view, we are once again seeing a potentially optimistic perspective on earnings for the second half of the year. While a U.S.-China trade deal and infrastructure spending bill could very well lead to a better second half of 2019 from an earnings perspective, the unknown remains the vector and velocity of the rest of the global economy.  As discussed above, the US is looking like the best house on the economic block, but as I share below there are valid reasons to think that it too continues to slow.


Last week I touched on a Thematic Signal about the record level of auto loan delinquencies, and in the last few days, we’ve learned that student-loan delinquencies surged last year, hitting consecutive records of $166.3 billion in the September 2018 quarter and $166.4 billion in the December 2018 one. I’ve also noticed an uptick in credit-card delinquencies this past January as companies ranging from American Express (AXP) to JPMorgan (JPM) and other credit card issuers reported their monthly data. What I find really concerning is this record level of delinquencies is occurring even as the unemployment rate remains at multi-year lows, which suggests more consumers are seeing their disposable income pressured. While this isn’t a good sign for a consumer-led economy, it certainly confirms the tailwind associated with our Middle-class Squeeze investing theme.


Tematica Investing

 December Retail Sales shock some, confirm Costco and others

December Retail Sales have been published by the Commerce Department and to say the results were different than most were expecting is an understatement. And that’s even for those of us that were watching data of the kind I mentioned above.  Normally, holiday shopping tends to build as we close out the year, but according to the report, consumers pulled back in December as monthly retail sales fell 1.3% compared to November.

Yes, you read that right – they fell month over month, but as we know that is only one way to read the data. And while sequential comparisons are helpful, they do little to help us track year over year growth. From that perspective, retail sales in December 2018 rose 2.1% year over year with stronger gains registered at Clothing & Clothing Accessories Stores (+4.7%), Food Services & Drinking Places (+4.0%), Nonstore retailers (+3.7%) and Auto & other motor vehicles (+3.4%). That’s not to say there weren’t some sore spots in the report – there were, but there are also the ones that have been taking lumps for most of 2018. Sporting goods, hobby, musical instrument, & book stores fell 13% year over year in December, bringing the December quarter drop to 11% overall. Department Stores also took it on the chin in December as their retail sales fell 2.8% year over year. These declines are largely due to the accelerating shopping shift to digital from brick & mortar that are associated with our Digital Lifestyle investing theme.

Despite the headline weakness, I once again see the report as confirming for Thematic King Amazon (AMZN) and to a lesser extent Select List resident Alphabet (GOOGL) given its Google shopping engine. Not only is Amazon benefiting from the accelerating shift to digital commerce, but also from its own private label efforts, which span basic electronic accessories to furniture and apparel. It goes without saying that comparing the December Retail Sales report with Costco Wholesale’s (COST) monthly same-store sales reports shows Costco continues to win consumer wallet share.


As a reminder, Costco’s December same-store sales rose 7.5% in December (7.1% excluding gasoline prices and foreign exchange) and 6.6% in January (7.3%). And it remains on path opening new warehouse locations with 768 exiting January, up 3.0% year over year. That should continue to spur the company’s high margin membership fee income in the coming quarters. My suspicion is others are catching onto this given the 7% increase in COST shares thus far in 2019, the vast majority of which has come in the last week. We’ll continue to hold ‘em.

  • Our price target on Amazon (AMZN) shares remains $2,250.
  • Our price target on Alphabet (GOOGL) shares remains $1,300.
  • Our price target on Costco Wholesale (COST) shares remains $250.


Turning to this week’s data

This week’s shortened trading week brings several additional key pieces of economic data. And following the disappointing December Retail Sales report, these reports are bound to be closely scrutinized as the investment community looks to home in on the speed of the domestic economy. 

In addition to weekly mortgage applications, and oil and natural gas inventory data, tomorrow we’ll also get the December Durable Orders report and January Existing Home sales data. Given the drop-off in mortgage applications of late as well as weather issues, it’s hard to imagine a dramatic pick-up in the housing data since the end of 2018. Rounding out the economic data will be our first February look at the economy with the Philly Fed Index.

 Speaking of the Fed, today we’ll see the release of the Fed’s FOMC minutes from its January meeting. Considering the comments emanating from Fed heads lately as well as the lack of inflation in the January CPI and PPI data, there should be few surprises in terms of potential interest rate hikes in the near term. The looming question is the speed at which the Fed will normalize its balance sheet, which likely means that will be an area of focus as investors parse those minutes.


Here come Universal Display and Mobile World Congress 2019

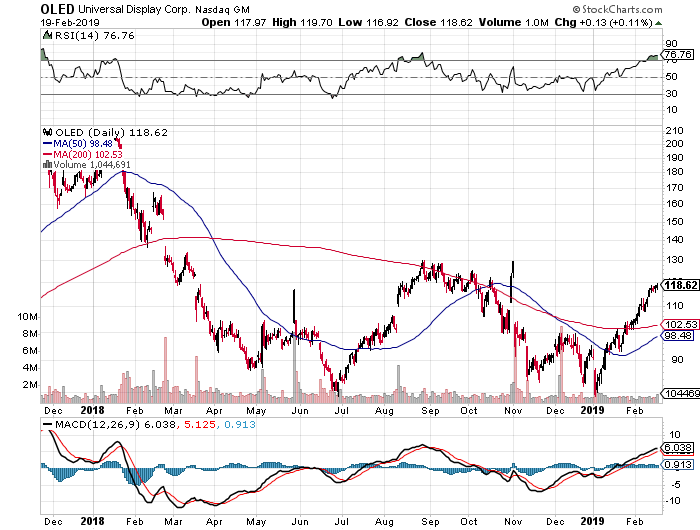
As long as we’re looking at calendars, after Thursday’s market close Select List resident Universal Display (OLED) will report its quarterly results. To say the shares have found some legs in 2019 would be a bit of an understatement given their resurgence over the last several weeks.


We know Digital Lifestyle Select List company Apple (AAPL) has shared its plans to convert all of its iPhone models to organic light emitting diode displays by 2020, and that keeps us in the long-term game with OLED shares. Given the current tone of the smartphone market, however, we could see Universal Display serve up softer than expected guidance.

We’ll continue to hold OLED shares for the duration and look for signs that other device companies, including other smartphone vendors but other devices as well, are making the shift to organic light emitting diodes next week during Mobile World Congress 2019 (Feb. 25-28). The event is a premier one mobile industry as it tends to showcase new devices and technologies, and as you might imagine means a number of announcements. This means it’s not only one to watch for organic light emitting diode adoptions, but we are also likely to see much news on 5G virtual reality and augmented reality, key aspects of our Disruptive Innovators investing theme, as well. And with 5G in mind, we could very well hear of more 5G network launches as well, which means keeping my Nokia (NOK) and Digital Infrastructure ears open as well as my Digital Lifestyle ones.

  • Our price target on Universal Display (OLED) shares remains $125.
  • Our price target on Nokia (NOK) shares remains $8.50.


Signs of Slowing Economy Continue to Mount

Signs of Slowing Economy Continue to Mount


The market is now back in a bullish mood that is driven primarily by the “not gonna happen” news flow hopes. Rate hike? Not gonna happen. Government shutdown repeat? Not gonna happen. China trade war escalation? Not gonna happen. The question is, just how long can the “not gonna happen” hopes keep pumping hot air into a market when we are staring down a likely earnings recession amidst a global economic slowdown?

  • Housing remains a miserable mess – just look on Zillow at the breadth of the price reductions.
  • The employment picture isn’t quite what the headlines would lead one to believe.
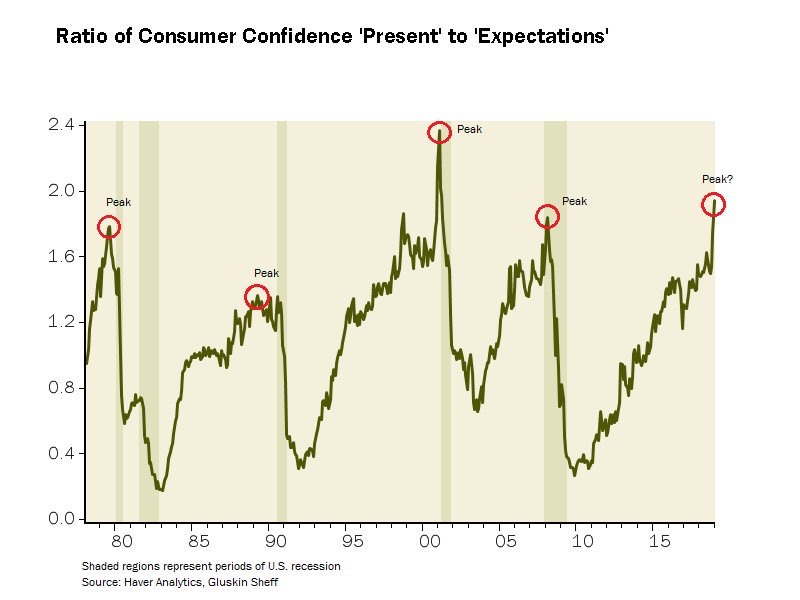
  • Consumer confidence looks to have peaked and is falling.
  • Consumer credit trends and retail sales are flashing warning signals.
  • Corporate earnings and loan demand are also flashing warning signs as are shipping rates.
  • Geopolitical risks are profuse and profound ranging from no-deal Brexit fallout to Italy’s ongoing battles in the EU to US-China trade relations to rising military tensions between the US and Russia to relations between Italy and France at lows not seen since WWII.
  • The level of bullish sentiment is no longer a contrarian positive with the AAII poll of individual investors putting the bull camp at 40% versus 32% last week and the highest level in the past three months. Bears are down to an 8-month low of 23% versus 50% back in December. Even the CNN Money Fear & Greed index is back in greed mode after hitting fear one month ago.

Housing Headwind

More than 12 years after the US housing market started an epic crash in 2007, an unprecedented number of homes are still underwater (meaning the outstanding mortgage on the home is at least 25% above the home’s current market value), according to a real-estate market report from ATTOM Data Solutions. This is clearly a consumer headwind that is part of our Middle-Class Squeeze investment theme. The states with the highest share of mortgages include Louisiana (21%), Mississippi (17%), Arkansas (16%) and Iowa (15%). Of the over 7,500 zip codes having a minimum of 2,500 properties examined in the report, 27 had more than half of all properties underwater including zip codes in cities such as Chicago, Cleveland, Trenton, Memphis, Saint Louis, Virginia Beach and Detroit. If you’re a real estate investor, you should be taking note and as is often said with stocks, you should be building your shopping list.


Job Picture Not So Rosy

This week we received the Job Openings and Labor Turnover Summary for December from the Bureau of Labor Statistics (BLS) which revealed a record high 7.335 million job openings. The unemployment rate has risen from the November low of 3.7% to 3.9% in December and 4.0% in January – possibly indicating that we are now on an uptrend. There are now 1.17 job openings for every job seeker, with December slightly below November’s all-time record high of 1.19 job openings.

We are also seeing a record high length of time to hire someone, which is derived by taking the number of job openings and dividing it by the number of hires. Prior to the financial crisis, this metric was always less than one month, but in August 2014 it broke above a month for the first time in recorded history and has been rising ever since then to a new high in December of 1.24 months. We see this as confirming that employers are having an increasingly difficult time finding the right talent for the position.

This would make one think that the consumer is doing great, but as always, digging below the surface reveals a different picture. At the start of February, the January Payroll report got a lot of attention as job growth utterly blew away estimates, coming in at 304,000 new jobs versus expectations for just 170,000. However, the other employment survey from the Bureau of Labor Statistics (BLS), the Household Survey, rather than providing confirming view of the labor market revealed a very different picture, click here to read about how the two differ in the data they track.

The Household Survey found that employment dropped 251,000 in January, the first such decline in five months, some of which can be attributed to the government shutdown. But employment for the prime working-age population declined 46,000 in January after an 11,000 drop in December and 48,000 in November – more of that Middle-Class Squeeze investment theme at work.

The last time we saw employment in this demographic decline for three consecutive months was in October 2009. The number of full-time jobs declined 76,000 while the number of people working part-time for economic reasons rose 10.5% to 5.145 million which is a 16-month high. The number who are working part-time because of “slack work business conditions” rose a whopping 19.4% to 3.45 million which is a 23-month high. For both metrics this was the biggest one-month change since September of 2001 – a month no one can forget – and before that February 1982, both times the economy was in a recession. The Household Survey also revealed that the largest category of hiring was for those with a high-school education or less, which may explain why average hourly earnings rose the smallest amount since October 2017 at just 0.1%.


Consumer Credit Warning Signs

The latest Senior Loan Office Survey found that demand for auto loans, credit card loans, GSE-eligible mortgage loans, qualified jumbo mortgage loans, non-qualified mortgage jumbo loans, non-qualified mortgage non-jumbo mortgage loans, government mortgage loans, and consumer loans ex-credit card and ex-auto all are in contraction mode. In a nutshell – folks are not interested in borrowing any more than they already have. That is not what we typically see during economic expansion. We are also seeing a record high 7 million Americans are 90-days or more behind on their auto loan payments – yet more Middle-Class Squeeze.


Consumer Confidence Falling

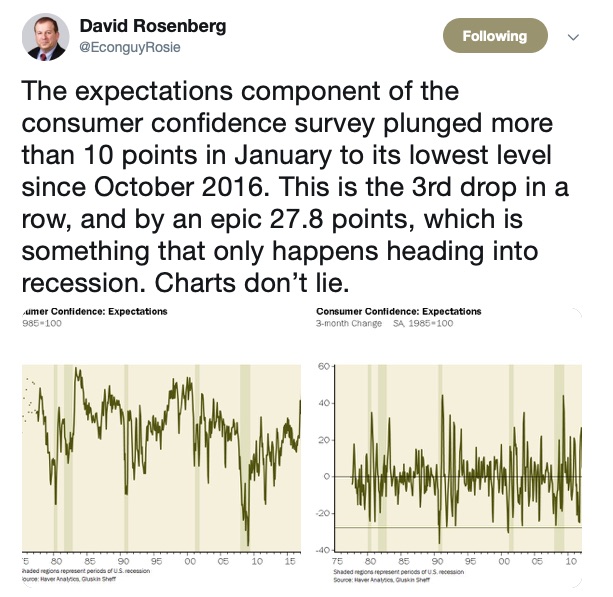
With the job market not quite as rosy as the headlines would suggest coupled with the trends in consumer credit, it wasn’t a big surprise to see the Conference Board’s Consumer Confidence index fall to an 18-month low in January, dropping to 120.2 from 126.6 in December versus expectations for 124.0. The January reading also marked the third consecutive decline after hitting an 18-year high of 137.8 in October. Gluskin Sheff’s David Rosenberg summed up the results quite succinctly in his tweet.

Retail Sales Take Biggest Hit Since 2009

US Retail sales saw the biggest one-month drop in December since September 2009 with even ecommerce sales suffering as retail sales fell -1.3% month-over-month and up just 2.1% year-over-year. Retail sales ex-gasoline stations fell -0.9% in December and even the typically strong non-store retailers, which includes mail-order and ecommerce as are part of our Digital Lifestyle investment theme, saw sales decline -3.9%. However online players such as Amazon (AMZN) – a Tematica Research all-star – and eBay (EBAY) still enjoyed strong sales gains through the holiday season.

That’s the sequential comparison. On a year over year basis, retail sales in December 2018 rose 2.1% year over year with stronger gains registered at Clothing & Clothing Accessories Stores (+4.7%), Food Services & Drinking Places (+4.0%), Nonstore retailers (+3.7%) and Auto & other motor vehicles (+3.4%). That’s not to say there weren’t some sore spots in the report – there were, but they are also the ones that have been taking lumps for most of 2018. Sporting goods, hobby, musical instrument, & bookstores fell 13% year over year in December, bringing the December quarter drop to 11% overall. Department Stores also took it on the chin in December as their retail sales fell 2.8% year over year.

While that’s a more favorable view, the reality is December Retail Sales came in weaker than expected. Between the government shutdown, falling equity prices, global trade wars and ballooning debt levels, folks opted to keep their wallets in their pockets this past holiday season. In keeping with our Middle-Class squeeze investing theme, consumers looked to stretch the dollars they had to spend, which helps explains Costco Wholesale’s (COST) eye-popping, by comparison, December 2018 same-store sales of 7.5% in December (7.1% excluding gasoline prices and foreign exchange). Those consumer wallet share gains, which likely continued into January with Costco’s same-store sales of 6.6% (7.3% excluding gasoline prices and foreign exchange), and its expanding warehouse footprint are why Costco is Tematica’s Middle-class Squeeze leader.


Corporate Earnings and Confidence Weakening

The earnings outlook for companies in the S&P 500 continues to deteriorate with expectations down to 1% year-over-year growth for 2019 versus 5% just a few months ago. The last Federal Reserve Beige Book found that 25% of the US is in contraction with the remaining 75% expanding at only a modest to moderate pace. The corporate outlook isn’t all that rosy either as venture capital investors are advising their start-ups to hold onto more cash. For example, Index Ventures is reportedly telling their entrepreneurs they need 18 to 24 months’ of coverage versus 9 to 12 months’ worth a year ago according to an article in the Financial Times.

It isn’t just the big guys that are struggling. Economic confidence for small companies declined during most of 2018 and in January reached its lowest level since President Trump was elected according to a monthly survey for the Wall Street Journal by Vistage Worldwide. The report noted that for the first time since the presidential election, small firms were more pessimistic about their own financial prospects than they were a year earlier, including plans for hiring and investment. In January 2018, 83% of the firms surveyed expected to grow revenues over the coming year versus 66% by January 2019. This decline was affirmed by the ISM non-manufacturing PMI report which found that the share with growth dropped from 94.4% last September to 50% today – the lowest since January 2016. The share contracting rose to 44.4%, the highest level since January 2016.


Corporate Loan Demand Echoing Consumer Weakness

Just as we saw demand for consumer credit declining, so has demand for corporate credit been on the wane. Demand for commercial and industrial loans from large and middle-market firms has been flat or in contraction in 10 of the past 13 quarters. For smaller firms, demand has been flat or in contraction in 9 of the past 13 quarters. Demand for commercial real estate loans for construction and land development has been in contraction since the first quarter of 2017.


No Love in the Eurozone

On Valentine’s Day we learned that economic growth in the eurozone was a meager 0.2% quarter over quarter in the fourth quarter of 2018 – so basically flat. Year-over-year growth stood at just 1.2% for the final quarter of 2018. This came after news that the eurozone economic powerhouse Germany had no growth itself in the fourth quarter after a contraction of -0.2% in the third quarter – narrowly missing a recession. Italy experienced its second consecutive quarter of economic contraction, putting it in a technical recession. All this put further downward pressure on the euro versus the US dollar.

Another major headwind in the Eurozone that has consequences far beyond the region is the lack of any Brexit deal. To put the situation in perspective, nations in the Eurozone have been trading with the United Kingdom for 30 years, resulting in highly integrated economies and corporations. Imagine being a grocery store manager in Edinburgh, Scotland and not knowing how your near-daily imports of fruits and vegetables from France are going to be affected or being a Swede working in London, who owns a home there and having no idea how your residency or work situation may be altered.

Without a long-term free trade agreement between the UK and the EU, new trade barriers will have to be introduced at borders and the prospect of different rules on standards and safety could make it harder and more expensive for companies to import and export. The cost of a no-deal Brexit will also affect consumers. The UK imports 30% of its food from within the EU. While companies can build up inventories in advance, there is a limit to what can be done given the shelf-life of some products and raw materials and limits to storage capacity. On top of that, all the additional storage and inventory represents additional business costs, diverting resources from investment in the company and its employees.

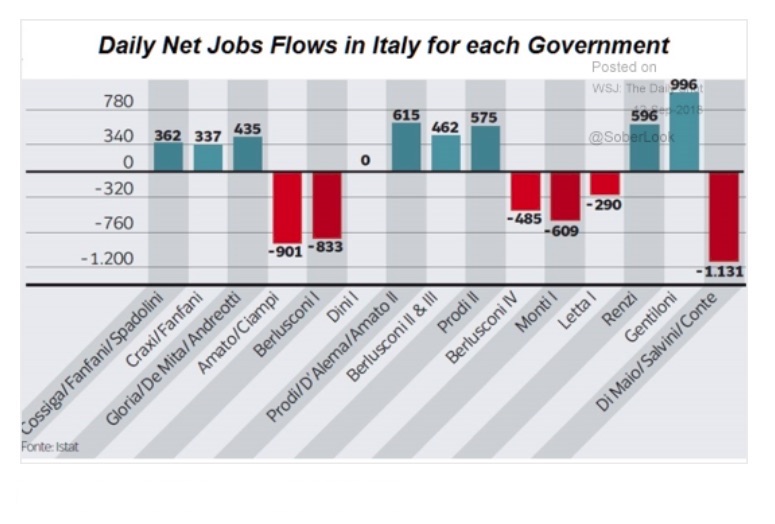
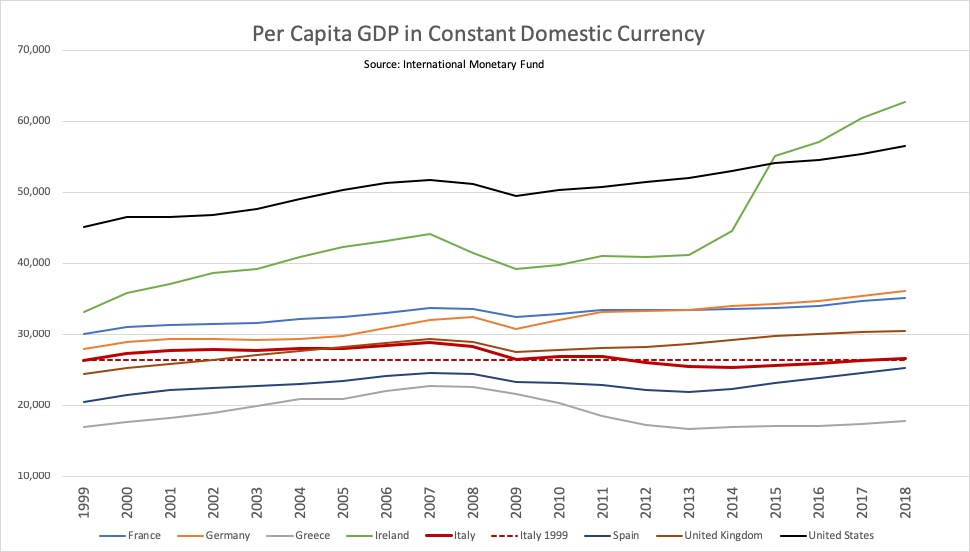
There is also no love lost these days between France and Italy, with relations between the two nations at levels not seen since the end of WWII. Italy’s relationship with the Eurozone, in general, has been challenging as its per capita GDP has grown all of 1% in the nearly two decades since it joined the unified currency while France has enjoyed 17% growth, Spain 23% and Germany 29%. For reference, the United States has seen per capita GDP grow 25% during this time.

Relations between the two traditionally close allies that are France and Italy have been degrading since mid-2018 when Italy’s Deputy Prime Minister Luigi Di Maio and Matteo Salvini of the League part starting firing pot-shots at Macron and France over immigration policies. Macron has occasionally fired back, for example, to criticize Salvini when he refused to allow a boatful of migrants rescued in the Mediterranean to step on Italian soil, forcing them to remain on the boat while it was docked. The group has since been moved out of Italy and Salvini has been sued by the court of Catania (where the ship was docked) for the kidnapping of minors. Good times.

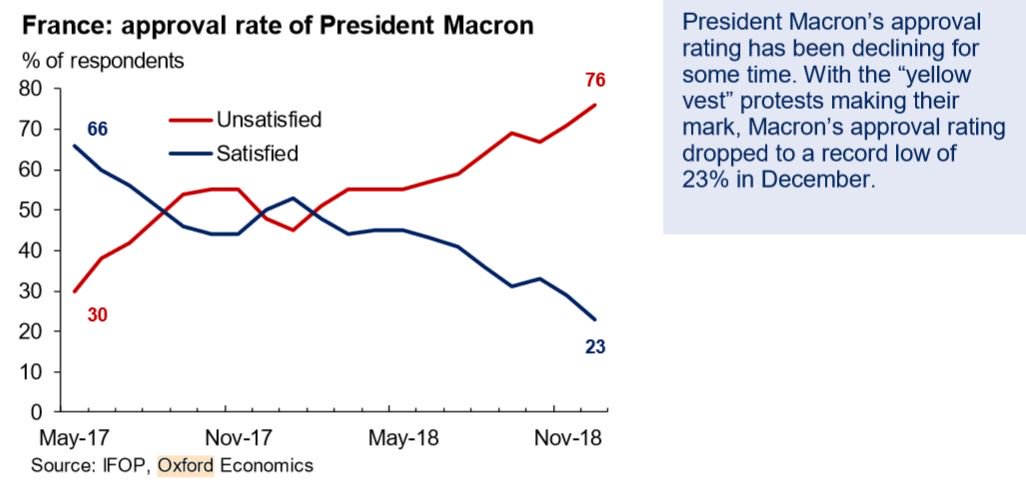
Earlier this month France recalled its ambassador to Italy, something it last did in 1945 after Italy’s Deputy Prime Minister Luigi Di Maio – who is also the head of the anti-establishment 5-Star Movement (Cinque Stelle) – met with members of France’s Gilet Jaune (Yellow Jacket) movement. These are the folks who have been protesting in France and amongst other acts of violence, have set fires in cities all across the nation including Paris. To say they have been vexing France’s President Macron would be a massive understatement.

This tension could not be coming at a worse time when the no-deal Brexit crisis looming.


Global Shipping Confirms Weaker Growth

The Baltic Dry Index (BDI), which tracks the cost of moving bulk commodities and is considered a leading indicator of global trade, is down more than 50% since the start of the year. Shipping brokers in Singapore and London have reported capsized vessels, the largest ships that move bulk commodities like iron ore, coal and aluminum, had been chartered in the spot market for as low as $8,200 a day last week. Break-even costs for carriers can be as high as $15,000 a day, and daily rates in the capesize market hovered above $20,000 last year. That’s a serious drop-off in demand, and the BDI tends to be a leading indicators investors and traders watch closely much the way we also watch rail traffic and truck tonnage data.


The Bottom Line

Signs of slowing continue to mount both domestically and internationally, alongside rising geopolitical risks and excessive bullishness in domestic equity markets. This is a good time for investors to put together a shopping list of those stocks that will enjoy long-term tailwinds despite global economic slowing and add them to your portfolio when they reach an attractive price point as we are likely to see a pullback in the markets soon.


Weekly Issue: Streaming Services and the Middle Class Squeeze

Weekly Issue: Streaming Services and the Middle Class Squeeze

Key points inside this issue

  • Stocks continue to melt higher on hopes, but details will matter in the end
  • Our price target on Middle-Class Squeeze company Costco Wholesale (COST) remains $250.
  • Netflix: Mark your calendars for Apple and Disney events
  • Taking a look at LendingClub (LC) shares as consumer debt climbs


Sorry, we’re a day late with your weekly issue. I’m just back from InsideETFs 2019, the industry event for the exchange-traded (ETF) industry. This isn’t the first time I’ve attended the event, and attendees continue to hear about the uptake of ETFs, as well as the growing number of differentiated strategies to be had. Some, in my opinion, are faddish in nature, looking to capture assets even though their strategies may not be ones that survive more than a few years. We’ve got a long issue this week, so I’ll suffice to say that such ETFs are not thematic investing, but rather trend investing and we’re already starting to see several of those older trend products being repositioned to something else.

As we close out this week, we’ll be halfway through the first quarter of 2019. Hard to believe, as we have yet to go through the swarm earnings reports from retailers, but it’s true. Given what appears to be the rollbacking of items that weighed on the stock market during the last few months of 2018, we’ve seen all the major stock market indices rebound hard, even though the global economy continues to slow. Once again, this has made the US the best house in the neighborhood, which has likely bid up assets and made the dollar a headwind to multinational companies in the process. As we are fonding of saying, the devil is in the details and that includes any would be progress on US-China trade and Congress with immigration reform. We remain cautiously optimistic, especially on the China trade front, but recognize that more time is likely to be needed until a Trump-sized “big deal” can be reached.

As we get set for the second half of the quarter, we here at Tematica will continue to not only watch the data and our Thematic Signals to assess what’s the next likely step for the market from here, but also the happenings in Washington on trade and infrastructure.


Tematica Investing

Odds are, the Thematic Leaders have seen some lift from the sharp rebound in the market thus far in 2019. As we can see in the chart above, several of them are going gangbusters, including Chipotle Mexican Grill (CMG), Netflix (NFLX), Alibaba (BABA) and Axon Enterprises (AXXN). This morning we’ll get the first Retail Sales report since before the federal government shutdown, and in my view, it will more than likely continue to show what it did during all of 2018 – digital shopping taking share and Middle-Class Squeeze leader Costco Warehouse (COST) continuing to win consumer wallet share.

On a reported basis, Costco’s January same-store sales rose 6.6% (7.3% excluding the impact of gasoline prices and foreign exchange). Exiting the month, Costco operated 768 warehouse locations vs. 746 this time last year, a 3% year over year, which reflects its stated path to open more locations in 2019, allowing for the steady growth of its high margin membership fee revenue stream. In my view, this lays the groundwork for a favorable earnings report from Costco on March 7, which is also when it will publish its February sales results.

  • Our price target on Middle-Class Squeeze company Costco Wholesale (COST) remains $250.


Netflix: Mark your calendars for Apple and Disney

While we have our calendars out and are marking them for that upcoming Costco date I mentioned early, let’s also circle March 25th, which is the rumored date of Apple’s next event. Per the Apple rumor mill, the company will not only showcase its new news subscription service (say that three times), but also unveil its video service as well. This video service falls into the category of one of the best, worst kept secrets, given the number of deals it has inked for original shows and movies. The news subscription service, which is expected to be called Apple News Magazines, comes after Apple acquired Texture, the would-be Netflix (NFLX) of magazines last year.

While we could see a new device or two, this event will be focused primarily on Apple’s Services business, which it is using to further its position inside our Digital Lifestyle investing theme.  Much like Proctor & Gamble’s (PG) Gillette razor blade business, I would not be surprised if Apple adopts a similar mindset with its devices being the razor that gets replaced periodically, while its far more profitable Services business is the one that people consume on a frequent basis.

Soon after Apple’s event, Disney will hold its annual Investor Day on April 11th at which it is expected to unveil its much discussed, but yet to be seen Disney streaming service dubbed Disney+. Given its robust library of films, content, and characters, Disney should not be underestimated on this front, and in my view much like Apple and its Services business, success with Disney+ could change the way Wall Street values DIS shares. Key items to watch will be the Disney+ price point, original content rollout, and subscriber growth.

Stepping back, if one were to argue that we are on the path to a crowd of streaming services between Netflix, Amazon (AMZN), Hulu, CBS, NBC, AT&T (T), and now Apple and Disney, I would have to agree. In many ways, we’re heading for cable-TV without the cable box, but on an ala carte basis. While we’ve argued that consumers will go to where there is great content, the more streaming services there are the more likely we see the proliferation of good or not so good content. The risk they run is that just like cable channels that need to be filled with content, so too will their streaming services. Also too, one unknown is how many services will a person subscribe to? Past a certain point, consumers will balk, especially if all they’ve succeeded in doing is replicating that high cable bill they sought to originally sought to escape.

Needless to say, I’ll be watching the unveiling and uptake of these new services from Apple and Disney with an eye for what it may mean for Digital Lifestyle company Netflix (NFLX). One interesting item to watch will be to see what is actually included in the Disney and Apple services at launch and over time. Both companies are rumored to be working on streaming gaming services as are Microsoft (MSFT) and Alphabet (GOOGL), which to date is something Netflix has resisted at least publicly. If Apple were to bundle a gaming, video and news service along with Apple Music into one digital content bundle, that would offer some consumer wallet leverage over other single, stand-alone services.


Taking a look at LendingClub shares

Earlier this week, Tematica’s Chief Macro Strategist Lenore Hawkins posted a Thematic Signal for our Middle-Class Squeeze investing theme following the news that a record 7 million Americans are 90 days or more behind on their auto loan payments. Lenore went on to show some additional data that consumer loans from banks are in contraction mode, which as we know is a sign the US economy is not going gangbusters.

What we are seeing is the consumer looking to get their financial house in order, most likely after ringing up credit card, auto loan and student debt over the last several quarters. A new report from LendingTree (TREE) points to total credit card debt having climbed to more than $1 trillion in under five years, with more people using personal loans to manage existing debt. This has led the amount owed on personal loans to double what it was five years ago and the number of outstanding loans to rise some 50% in the last three years. According to the report’s findings, managing existing debt was the most popular reason for a personal loan, representing 61% of all loan requests in 2018. Of that percentage, 39% of borrowers plan to use their loans to consolidate debt, while 22% planned to use it to refinance credit cards.

From a stock detective’s point of view, the question to ask is what company is poised to benefit from this aspect of our Middle-Class Squeeze investing theme?

One candidate is LendingClub (LC), which operates an online credit marketplace that connects borrowers and investors in the US. It went public a few years ago and was heralded as a disruptive business for consumers and businesses to obtain credit based on its digital product offering. That marketplace facilitates various types of loan products for consumers and small businesses, including unsecured personal loans, unsecured education and patient finance loans, auto refinance loans, and unsecured small business loans. The company also provides an opportunity to the investor to invest in a range of loans based on term and credit.

Last year 78% of its $575 million in revenue was derived from loan origination transaction fees derived from its platform’s role in accepting and deciding on applications on behalf of the company’s bank partners. More than 50 banks—ranging in total assets of less than $100 million to more than $100 billion—have taken advantage of LendingClub’s partnership program.

LendingClub’s second largest revenue stream is derived from investors fees, which include servicing fees for various services, including servicing and collection efforts and matching available loans with capital and management fees from investment funds and other managed accounts, gains on sales of whole loans, interest income earned and fair value gains/losses from loans held on the company’s balance sheet.

In the past LendingClub was tainted with uncertainty given several investigations, but in mid-December, it settled with the SEC and DOJ, with the SEC stating:

“The SEC’s Enforcement Division determined not to recommend charges against LendingClub Corporation, which promptly self-reported its executives’ misconduct following a review initiated by its board of directors, thoroughly remediated, and provided extraordinary cooperation with the agency’s investigation.”

The SEC’s comments are a positive affirmation of the company’s internal procedures and policies, which also helps reduce the potential negative impact from the still-remaining Federal Trade Commission complaint. The FTC’s complaint against LendingClub charged it has misled consumers and has been deducting hidden fees from loan proceeds issued to borrowers.

Those recent developments have improved the company’s risk profile at a time when its core business has been growing given Middle-Class Squeeze pains being felt by more consumers. According to data TransUnion, subprime personal loan balances have been climbing since 2014 and are forecast to increase 20% this year to a record $156.3 billion.

Here’s the thing, the year-end shopping season isn’t just for shopping,  it’s also the seasonally strongest time of year for subprime loan originations, which according to TransUnion rose to 5 million loans at the end of 2018. That sets up what is likely to be a favorable December quarter earnings report from LendingClub when it issues those results next week (Tuesday, Feb. 19). The thing is I continue to see far more upside to be had with Middle-Class Squeeze Thematic Leader Costco Wholesale, which is not only growing its very profitable membership fee income stream the company is also a dividend payer.


Is Everyone Looking the Wrong Way?

Is Everyone Looking the Wrong Way?


Over the past few months, the investing markets have considered Federal Reserve Chairman Powell enemy number one. Earlier this week the markets once again showed that America’s central bank drives sentiment more than any other factor, forget trade wars, forget earnings, forget political drama, it is the Fed and only the Fed that matters. That may sound somewhat simplistic to all the fundamental analysts and market technicians out there, but let’s face facts – it’s true.

Even the end of the 35-day long government shutdown barely generated a response from the markets.

What did generate interest was the rumor that the Fed may be considering ending its $50 billion-a-month drawdown of its balance sheet.

The afternoon of Wednesday, January 30th, after a much more dovish tone out of Powell, the stock market closed up for the first time after the past eight FOMC meetings – the longest post-FOMC losing streak on record. The prior meeting on December 19th was followed by a gut-wrenching 1,800-point crash in the Dow over the following four sessions. As we were nearing the end of 2018, it looked and smelled like the Fed went too far yet again, as it had done in 10 of the past 13 post-WWII hikes – so much for the narrative of the omniscient central banker. As Mark Twain wrote, “History doesn’t repeat itself, but it does rhyme.”

Investing is all about finding an inflection point, where the market is wrong – pricing an asset too high or too low, believing a policy to be beneficial when it isn’t or vice versa. Given the ubiquitous nature of the belief that the Fed is the central bank that really matters to the market, what if that supposition is wrong?

What if everyone is looking in the wrong direction with the wrong set of expectations? What if everyone ought to be looking in the direction of our New Global Middle Class investing theme? We will start to explore that idea in this week’s piece along with an assessment of the domestic and global economy.

As Chris Versace and I wrote in our book Cocktail Investing, there are three major participants in an economy: consumers, business and government. To understand what is happening in an economy one needs to understand the vector and the velocity associated with each one of these participants.


Households’ Outlook Dims

Our Middle-Class Squeeze investing theme was again front and center this week in the domestic economy. This week we got a rather dour report on how the Household sector of the economy is feeling about the future with the University of Michigan’s monthly index of Consumer Sentiment, which gauges American’s view on their own financial condition as well as the economy in general. In January U.S. Consumer Confidence dropped to 90.7 versus expectations for 96.8, hitting an 18-month low despite initial jobless claims dropping to a 49-year low, likely thanks to the double-whammy of the partial government shutdown and the recent volatility in the financial markets.

The decline was driven primarily by deteriorating expectations about the future, with that portion of the index declining 11% in January after falling 13% in December. On the other end of the spectrum, consumer’s assessment of current conditions is a mere 2% below the August peak which puts the spread between consumer’s outlook for the future and their present situation at nearly the largest since 1967. The only period in which the spread was greater was January through March of 2001 – the recession began in March 2001. Hat tip to David Rosenberg of Gluskin Sheff for the chart below.

We will be watching this metric particularly closely in February as well as the February Manufacturing Index given the recent drop in the 6-month view.

The rather glum outlook continues to be a headwind to the housing sector. House sales, excluding newly built homes, fell by 10% in December compared with the same month in 2017, according to the National Association of Realtors. Interestingly, this sharp fall off occurred despite the late 2018 rollover in mortgage rates, which as any a home buyer knows makes for a lower cost of total home ownership.


Slowing Corporate Sector

We are knee deep in the December 2018 quarter earnings season with around one-third of the S&P 500 companies having reported so far with an aggregate increase of 14.2% in earnings per share on an increase of 5.6% in revenue. While that sounds pretty good at first glance, what concerns us is that the beat ratio so far is the lowest since 2014, despite having the second most aggressive estimate cuts in the months going into this season since the depths of the financial crisis. On top of that, expectations for 2019 are being materially scaled back with expected EPS growth having fallen to just 1.6% year-over-year in the March quarter, driven in large part by weakening revenues for those companies with a lot of international sales exposure. As we’ve heard from a growing number of companies over the last few weeks, they are feeling the pinch of the trade war as well as the strong dollar.

One theme that keeps rearing its head is the impact of weakness in China, which is no small matter given that according to the US Census Bureau, America’s exports to China have doubled over the 10 years through 2017 to reach $130 billion a year. Companies ranging from Caterpillar (CAT) to Apple (AAPL), NVIDIA (NVDA) to Stanley Black & Decker (SWK) and 3M (MMM) have commented on the impact of a Chinese slowdown.

Caterpillar expects its Chinese markets to be flat in 2019. NVIDIA reported weaker Chinese demand for its computer chips and gaming consoles. H.B. Fuller Co (FUL) reported that weaker demand from China will reduce its profits by $20 million this year. PPG Industries (PPG) reported sales of its coatings for cars made in China fell 15% in the December quarter.

Despite these declines, however, luxury goods associated with our Living the Life investing theme continue to boom in China according to LVMH-Moet Hennessy Louis Vuitton (LVMHF). During its earnings conference call, the company shared that “growth in China has accelerated in Q4 compared to the previous quarters and the beginning of this year is the same.” That strength was corroborated by Ferrari (RACE) that reported its sales in China, Hong Kong and Taiwan rose nearly 13% year over year in the December quarter, and forecasted a pickup in its China business during the first half of 2019. Some of this may reflect the non-US nature of those companies, but the more pronounced driver is more than likely demographic in nature as captured by the rising middle class in China and the allure of aspirational goods, but also the rapid rise in wealthy and ultra-wealthy Chinese, a key cohort when it comes to the Living the Life tailwind.


Government

While the partial government shutdown has finally come to an end, at least temporarily, inside the beltway is increasingly looking like a kindergarten class that has missed its afternoon nap. The US federal deficit continues to be quite large compared to post WWII norms.

The sheer size of the federal deficit combined with the Federal Reserve program to reduce its balance sheet means that roughly $1.3 trillion is being pulled away from the private sector. The more money the government needs, which means increased Treasury bond supply, the less money is available to be spent in the private sector – this is referred to as the crowding out effect of large government deficits. The Fed’s actions along with the increase deficit spending are one of the factors behind the recent drop is equity prices as the money has to come from somewhere. Less money in the private sector means demand for private sector assets declines which impacts prices. What about China? Well, it is no longer a buyer of US debt and may well have become a net seller.


Global Economy

In 2017 the world’s leading economies accelerated in sync, boosting equity prices. In 2018 the U.S. economy surged on thanks in part to fiscal stimulus in the form of tax cuts and increased government spending while the rest of the world slowed. In 2019 the world looks to be once again syncing up to slow down. The IMF warned that “the global expansion is weakening and at a rate that is somewhat faster than expected”. The fund revised down its forecasts, particularly for advanced economies with the world’s economy forecast to grow by 3.6% in 2020. Although that is stronger than in some previous years, the IMF thinks “the risks to more significant downward corrections are rising”, in part because of tensions over trade and uncertainty about Brexit.

The Global Zentrum fur Europaische Wirtschaftsforschung (ZEW) Economic Sentiment Index echoes what we’ve seen from the Michigan Consumer Sentiment Index.

Italy has now had two consecutive quarters of contracting GDP, which means that technically Italians are breaking out the Barolo and sadly toasting to their latest recession. Germany, which has been the strongest economy in the Eurozone, saw its economy contract 0.2% in the third quarter of last year, its industrial production decline 1.9% in November, and retail sales crash 4.3% in December, sparking fears that the country is on the brink of a recession as well. Recent federal statistics have Germany’s economy growing by just 1.5% in 2018 versus 2.2% in 2017 with the IMF forecasting just 1.3% in 2019. According to data published by IHS Markit, France’s Composite Output Index that reflects its manufacturing and services economy remained in contraction mode at 47.9 in January, down from 48.7 in December. As a reminder, a reading below 50 indicates a contraction, while one above 50 indicates growth. Against that backdrop, it’s not shocking to read that European Central Bank President Mario Draghi say “The European Central Bank is ready to use all its policy tools to support Europe’s softening economy, including by restarting a recently shelved bond-buying program.” As for the U.K., consumer confidence with respect to the economic outlook fell to a 7-year low in January.


China Slows

China has the second largest economy in the world and will soon replace the US as the world’s largest retail market as it benefits from the tailwinds in our New Global Middle Class investing theme. What happens in China matters to the rest of the world. For example, China has become the largest importer of wood in the world and the largest exporter of things made from wood, ranging from furniture to flooring. While China’s economy will eclipse that of the US, growth doesn’t come in a straight line and we are seeing warning signs:

  • China’s economy has slowed 6.4% in the fourth quarter of 2018, the third consecutive deceleration. Growth slowed to 6.6% in 2018, the slowest growth since 1990 when sanctions were imposed following the Tiananmen Square massacre.
  • Manufacturing PMI in January stood at 49.5 and was 49.4 in December, showing 2 consecutive months of contraction.
  • Property sales, which had been a reliable source of growth which took advantage of borrowing opportunities have been slowing.
  • The growth in retail sales has fallen to its lowest level in more than 15 years.
  • Sales of cars fell last year for the first time in more than two decades.
  • Companies have started cutting back hiring and incomes are growing more slowly, weighing on consumer sentiment. The middle three quintiles of China’s population by income distribution saw earnings increase by only about 2% last year in real terms.
  • Defaults are on the rise. Corporate bond defaults reached 19 billion yuan in the first half of 2018 versus 14 billion in the same period of 2017. Smaller banks in rural areas, which would be the first to feel the pain, are seeing rising levels of bad loans.

As a result, China is letting up on its drive to deleverage its economy and Chinese investment into Europe and America fell by 73% in 2018. China has already pivoted towards more supportive economic policies. It has sped up spending on infrastructure, trimmed income taxes and relaxed some restraints on bank lending. China has a massive population that it needs to keep employed and was the world’s engine during the last financial crisis, providing a floor under demand as much of the rest of the world was crashing.


What If They Are Wrong?

The US today has the highest non-financial private sector debt to GDP ratio in history. Overall the global debt to GDP ratio is the highest we’ve ever seen. Most likely the Fed tightening cycle has come to an end and the next thing we are most likely to see is easing, but this time perhaps that cure is already used up?

We’ve already seen materially diminishing returns from Fed stimulus efforts in the past.

What if this time around the only central bank that truly matters is China’s?

What if China decides to alter its monetary policy, its peg to the dollar, to help its slowing economy thereby creating a cascade across the east as its neighbors scramble to respond?

What if the only bank in the world that can affect asset prices this time, that can actually create inflation is the one for the biggest consumer of raw materials in the world, the one in the East at the People’s Bank of China while everyone is looking the other way?

What if indeed…

How many investors are factoring that into their thinking? Is President Trump contemplating that as US-China trade talks continue? We’ll be watching so stay tuned.


As the Market Bounces Off Oversold Conditions, is this the Start of Another Bull Run?

As the Market Bounces Off Oversold Conditions, is this the Start of Another Bull Run?

Market Reversal

So far in 2019, we are seeing a reversal of the heavily oversold conditions from the end of 2018. Those stocks that were hit the hardest in 2018 are materially outperforming the broader market in 2019. For example, through the close on January 16, 62% of stocks in the Financial sector were above their 50-day moving average, the highest of any sector, versus 44% for the S&P 500 overall. To put that into perspective, Financials have not been the top performer for this metric in 273 trading days, the second-longest such streak since 2001 and only the fourth streak ever of more than 200 trading days. It isn’t just financials as the Energy sector, which was the worst performing sector in 2018, has the third highest percent of stocks above their 50-day in 2019.

While impressive looking, this shift doesn’t necessarily bode well for the Financial sector, nor for the broader market according to data compiled by Bespoke Investment Group.


Stock Performance After Streaks Ended


This recent outperformance by Financials in 2019 is particularly fascinating when I talk to my colleagues at various major financial institutions. Here are a few of the comments I’ve been hearing, paraphrased and without attribution for obvious reasons:

“This deal is way too small for you guys, but I wanted to let you know that our team is working on it.” –  (M&A consultant)

Send it over.We are so late in the cycle that we are looking at damn near anything.” –  (Partner at one of the largest global private equity firms)

“What can we do to better serve your company? We are making a major push this year into better serving companies of this size.” –  (Partner at one of biggest investment banks to a very surprised member of the Board of Directors of a recently IPO’d company whose market cap would have normally left it well below the bank’s radar. After some investigation, many other board members for companies of a similar size in the sector have been getting the same phone calls from this bank.)

The big financial institutions are having to work their way downstream to find things to work on – that’s a major peak cycle indicator and does not bode well for margins. It also doesn’t bode well for the small and medium-sized institutions that will likely need to become more price competitive to win deals in this new more competitive playing field.

We have also seen some wild moves in a few of our favorites such as Thematic Leader Netflix (NFLX), which reported its earnings after the close on January 17th. Netflix sits at the intersection of our Digital Lifestyle and Disruptive Innovators investing themes and has seen its share price fall over 40% from the July 2018 all-time highs to bottom out on December 24th. Since then, as of market’s close on January 17, shares gained nearly 50% – in around all of 100 trading hours! While about 10% of that can be attributed to the recent price increase that will amount to about $2 or so per month for subscribers, there are greater forces at work for a move of such magnitude. No one can argue that either direction was based on fundamentals, but rather a market that is experiencing major changes.

One of the most important leading indicators as we start the Q4 earnings seasons was the miss by FedEx (FDX) and the negative guidance the company provided for the upcoming quarters. FedEx’s competitor United Parcel Service (UPS) is part of our Digital Lifestyle investing theme – how are all those online and mobile purchases going to get to you? Both FedEx and UPS are critical leading indicator because they touch all aspects of the economy and transportation services, in general, have been posting some weak numbers lately in terms of both jobs and latest price data.

In what could be reflective of both our Middle Class Squeeze investing theme, Vail Resorts (MTN) also gave a negative pre-announcement, stating that its pre-holiday period saw much lower volumes than anticipated despite good weather conditions and more open trains. The sour end of the year in the investment markets and the weakness we’ve seen in markets around the world may have led many decided to forgo some fun in the snow. We’ll be keeping a close eye on consumer spending patterns, particularly by income level in the months to come.

Investor Sentiment Slips

According to the American Association of Individual Investors, bearish investor sentiment peaked at 50.3% on December 26, right after the market bottomed. Bullish sentiment over the past month rose from 20.9% to 38.5% but then stalled this week, falling back to 33.5% as the markets reached resistance levels. Bullish sentiment is now back below the historic average but still well above the December lows. Bearish sentiment, on the other hand, is on the rise, up to 36.3% from last week’s 29.4%. This is just further indication that much of what we’ve seen so far in 2019 is a recovery from the earlier oversold conditions.

As we look at the unusual pace at which the major indices lost ground in the latter part of 2018 and the sharp reversal in recent weeks, I can’t help but think of one of the many aspects of our Aging of the Population investment theme. A large portion of the most powerful demographic of asset owners is either in or shortly moving into retirement. Many already had their retirement materially postponed by the losses incurred during the financial crisis. They are now 10+ years older, which means they have less time to recover from any losses and have not forgotten the damage done in the last market correction. I suspect that we are likely to see more unusual market movements in the years to come than we have since the Boomer generation entered into the asset gathering phase of life back in the 60s and 70s. Today this group has a shorter investment horizon and cannot afford the kinds of losses they could 20+ years ago.

The Shutdown and the Fed

Aside from a rebound against the oversold conditions, another dynamic that has the market in a more optimistic mood, at least for the near term, is the narrative that the government shutdown is good news for interest rates as it will likely keep the Federal Reserve on hold. Given that estimates are this shutdown will cost the economy roughly 0.5% of GDP per month, it would be reasonable for the Fed to stay its hand.

Inflation certainly isn’t putting pressure on the Fed. US Producer Prices fell -0.2% last month versus expectations for a -0.1% decline. The bigger surprise came from core ex-food and ex-energy index which fell -0.1% versus expectations for an increase of +0.2%. Keep in mind that core PPI declines less than 15% of the time, so this is meaningful and gives Powell and the rest of the FOMC ample cover to hold off on any hikes at the next meeting.

US import prices fell -1% month-over-month in December after a -1.9% decline in November, putting the year-over-year trend at -0.6%. That’s the first negative year-over-year print since August 2014. Yet another sign that inflation is rolling over.


Economy Flashing Warning Signs

Despite all the hoopla earlier this month over the December’s job’s report, this month’s Job Openings and Labor Turnover Survey (JOLTS) report showed that for the first time since the end of 2017 and just the 6thtime in this business cycle, hirings, job openings and voluntary quits fell while layoffs increased in November.

By digging further into the details of the Household survey as well we see that people holding onto more than one job rose +117k in December, accounting for over 80% of the total employment gain. On top of that, the number of unincorporated self-employed rose +126k. These two are things we normally see when times are tough, not when the economy is firing on all cylinders. Not to be a Negative Nancy or Debbie Downer here, but the prime-working-age (25-54) employment shrunk -11k in December on top of 48k the month before. This was before things started to get really scary for many workers with the government shutdown. Imagine how many more are now looking for a second job to make ends meet while they wait for those inside the beltway to work this mess out.

We also got a materially weak New York Empire Manufacturing survey report this week that saw New Orders decline for the second consecutive month and a sharp drop in the 6-month expectation index. The New York Federal Reserve’s recession risk model is now placing odds of a recession by the end of 2019 at over 21%, having more than doubled since this time last year and having reached the highest level in 10 years. Powell and his team at the Fed have plenty of reasons to hold off on hikes. I wouldn’t be surprised if their next move is actually to cut.


NY Fed Recession Probability


Risks, what risks, we don’t see no stinking risks

US economy isn’t as strong as the headlines would make you think. The political dialogue going back and forth while on the one hand entertaining in a reality TV I-cannot-believe-he/she-just-said-that kind of way isn’t so funny when we look at the severity of problems that need to be addressed – excessive debt loads, a bankrupt social security program, a mess of a healthcare sector – just to name a few. The market today isn’t pricing much of this in, and based on the year to date move in the major market indices, particularly not the potential economic damage the government shutdown if the situation worsens.

If we look outside the US, the market’s indifference is impressive. UK Prime Minister Theresa May’s Brexit plan suffered a blistering defeat in Parliament, the largest such defeat on record for over 100 years, leaving the entire Brexit question more uncertain than ever and it is scheduled to occur just over two months away. In the two days post the Brexit vote back in 2016 the Dow lost 870 points and the CBOE Volatility Index (VIX) rose 49%. This time around the equity markets were utterly disinterested and the VIX actually fell 3.5% – go figure. A messy Brexit has the potential to have a material impact on global trade and yet we basically just got a yawn from the stock market.

Over in Europe flat is the new up with Germany’s GDP expected to come in every so slightly positive and this is a nation that accounts for around one-third of all output in the euro area – with China a major customer. Overall, Eurozone imports and exports fell -2% in November.

The other major exporter, Japan, just saw its machinery orders fall -18.3% in December after falling -17% in November. Japan already had a negative GDP quarter in Q3 and the latest data we’ve seen on income and spending aren’t giving us much to be positive about for the nation.

The Trade War continues with some lip service on either side occasionally giving the markets brief moments to cheer on some potential (rather than actual) signs of progress. The overall global slowing coupled with the trade wars is having an effect. China’s exports for December were far worse than expected, -4.4% from year-ago levels vs expectations for +2%. Last week Reuters reported that China has lowered its GDP target for 2019 to a range of 6% to 6.5%, which is well below the 6.6% reported output gain widely expected last year which itself is the weakest figure since 1990. Retail sales growth has fallen to a 15-year low as auto sales contracted 4.1% in 2018, the first annual decline in 28 years. With a massive level of leverage in its economy, banking assets of $39.1 trillion as of Sept. 30, and nearly half of the $80.7 trillion 2017 world GDP, (according to the World Bank) waning economic growth could be a very big problem and not just for China. We’ll be watching this as it develops given our Rise of the New Middle-class and Living the Life investing themes.

The bottom line is we’ve been seeing the markets bounce off seriously oversold conditions after a breathtakingly rapid descent. The fundamentals both domestically and internationally are not giving us reason to think that this bounce is the start of another major bull run. With all the uncertainty out there, despite the market’s recent “feel good” attitude, we expect to see rising volatility in the months to come as these problems are not going to be easily sorted out.


Debt Bombs Ticking Across the Globe

Debt Bombs Ticking Across the Globe


There are times when writing from the macro perspective can be challenging, particularly when macro takes a backseat as it is prone to do during parts of the business cycle. This year macro is back with a bang.

JPMorgan recently assessed the chance of a recession in 2019 has risen to 35%from just 16% in March based on macro data alone. The markets realize that the underlying dynamics have changed and are grappling with what to expect next:

  • As we mentioned last time, in 2017 only 1 of the 70 asset classes Deutsche Bank tracks closed in negative territory despite many being inversely correlated – clearly a market behaving oddly. As of mid-November, 90% were in the red for 2018 as the overexuberance of 2017 is forced to pay the piper.
  • In 2017 44 of the 47 country stocks in the global MSCI index closed up for the year. As of the December 11thclosing, only 3 are in the green.
  • The suppressed volatility in 2017 has led to hyper in 2018 as the S&P 500 has lost 3% or more in three market sessions this year with not one gain of 3% or more, a dynamic which last happened in 1936. The Dow Jones Industrial Average has experienced four days of 3%+ losses and no daily gains of that magnitude, a dynamic which last happened in 1897. (Hat tip to David Rosenberg of Gluskin Sheff)

Market dynamics are reflecting the increase in macro/political volatility across much of the world, but the headlines have yet to catch up with the primary drivers underlying the deep changes. In our previous Context & Perspectives piece, I discussed how we are seeing a profound decline in the level of liquidity at a time when debt levels are back to record highs. This week is a highlight reel of warning signs in the context those record levels of debt.
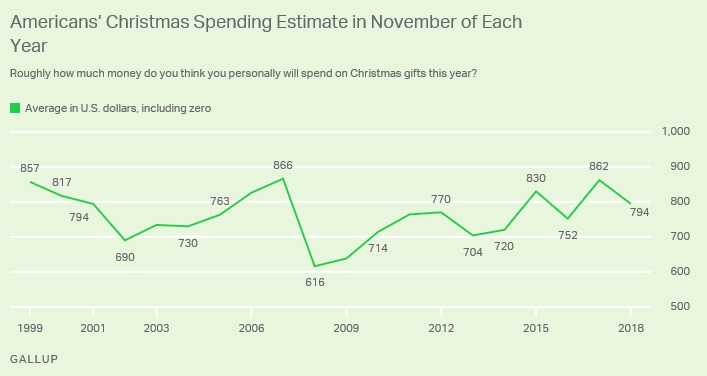
  • US employment
  • US Treasury balance sheet and yield curve inversion
  • Oval Office produces day time TV level drama
  • US China Trade War
  • UK Brexit Drama Spikes
  • Paris on Fire
  • Italy sees an opportunity


USA Employment Picture

Last Friday’s Nonfarm payrolls were significantly below expectations at +155k versus expectations closer to +200k on top of downward revisions of 12k to the prior two months. That’s not great, but amidst all the hype around this being a phenomenally strong economy, the workweek shrunk to a 14-month low of 34.4 hours from 34.5 in October. That translated effectively into 370k jobs lost, which means that the real picture for employment was a net loss of -215k (+155k new payroll -370k from shortened work week). The -0.2% decline in aggregate hours worked, the second decline in the past three months, means that unless there was a big jump in productivity, output, aka real economic activity, contracted for the month.

We also saw a decline in earnings with average weekly income falling -0.1% given the decline in the average workweek and an increase of hourly earnings of +0.2% versus +0.3% expected. This is the first decline in weekly earnings in 2018 and may call into question the expectations around Christmas shopping.

The recent University of Michigan Consumer Sentiment survey found that an increasing number of respondents are expecting unemployment to be higher in the next twelve months than lower and a recent Gallup poll found that Americans plan to spend less on holiday gifts today than they expected back in October and less than they expected to spend in 2017. The $91 decline in expected spending since October is, “one of the steeper mid-season declines, exceeded only by a $185 drop that occurred in 2008, as the Wall Street financial crisis was unfolding, and a $102 drop in 2009 during the 2007-2009 recession.” The environment is changing.

Putting it all together, last month saw a contraction in the workweek, in the index of aggregate hours worked and in average weekly earnings – not exactly a story of a robust economy despite the headline 3.1% year-over-year rise in average hourly earnings, the strongest read since 2009. Digging into the details can give a different picture.

Earlier this week the JOLTS (Job Openings and Labor Turnover Survey) saw the number of job openings increase in October to 7.08m from September’s 6.96m, but still below the August peak of 7.29m. The number of voluntary quits declined to a 4-month low. This was likely thanks to, per data from the Atlanta Fed Wage tracker, ‘job switchers’ and ‘job stayers’ enjoying the same wage gains for the first time in three years. This is an indicator of rising wage pressures which puts pressure on margins at a time when as the FT put it, “Cracks in the corporate debt market begin to show.”

October also saw a greater-than-expected increase in consumer credit to $25.4b versus the $15b driven largely by student debt and auto loans – debt, debt and more debt.

Over the past few weeks your Tematica Research team has called out some Thematic Signals here, here and here that illustrate between the impact our Aging of the Population and the Middle Class Squeeze investing themes, many American consumers continue to struggle.


US Treasury Balance Sheet and Yield Curve Inversions

This week’s CPI report was in line with expectations at 2.2% year-over-year and showed inflation that is high enough for the Federal Reserve to proceed with another rate hike this month, but the bond yield landscape is changing. On December 3rd, the 3-year Treasury note yield exceeded that of the 5-year for the first time since 2007, which is known as a yield curve inversion. As of December 12th, the 5-year yield sat below the 2-year. The spread between the 10-year and the 2-year is at a level not seen since 2007 and is close to inverting as well. The spread between the 10-year and the 3-month (which is closely watched as a recessionary signal) has plummeted from 136 basis points in February to just 44 and been cut in half in the past month alone. This has the Federal Reserve’s attention.


As a reluctantly avid Fed watcher, (I wish monetary policy wasn’t such a driving force in the global economy these days) I’d be remiss if I didn’t point out this fascinating tidbit. On June 27, 2017, when the VIX Volatility Index sat at 11, US Federal Reserve Chair Janet Yellen said,

“You know probably that would be going too far but I do think we’re much safer and I hope that it will not be in our lifetimes and I don’t believe it will be.”


On Tuesday December 11th, 2018 (532 days or 1.46 years later) when the VIX sat at 22, now former US Federal Reserve Chair Janet Yellen said on CNBC,

“I’m not sure we’re working on those things in the way we should, and then there remain holes, and then there’s regulatory pushback. So I do worry that we could have another financial crisis. ″

You can’t make this stuff up.

On top of raising rates to tighten financial conditions, the Federal Reserve tapering has reduced its balance sheet by 8.3% since its tapering program commenced 13 months ago – that’s a solid level of liquidity drain as we’ve discussed in our last Context & Perspective piece.

The futures market is now pricing in less than 20 basis points of rate hikes next year versus over 55 basis points just a few months ago.

Oval Office Drama

Just when you thought the acrimony inside the beltway could not possibly get worse, it did. On Tuesday December 11thPresident Trump and Vice President Pence met with House Minority Leader Nancy Pelosi and Senate Majority Leader Chuck Schumer in the Oval Office while the network TV cameras rolled to discuss the impending government shutdown.

If this is a preview of what we can expect in the next two years with a divided government, the markets are right to be concerned with Capitol Hill’s ability to take constructive action if/when the economy slides into a recession let alone deal with the immediacy of a potential government shutdown which would leave federal employees without a paycheck at Christmas.

At a time when corporate balance sheets are the weakest they’ve been since the financial crisis, the federal deficit is at a percent of GDP not seen outside of a war or a recession. Total public debt outstanding has risen by $1.7 trillion (or 6.6%) since the start of the year. The current debates in DC are not focused on reducing the deficit, but rather a battle over where to spend. This means we are likely to see a greater supply of Treasury bonds on the market in the coming year(s) to compete with the high level of corporate debt that will need to be refinanced as we discussed in our last piece.


This level of dysfunction is particularly concerning when we look around the world and see political volatility outside the US also reaching heights rarely seen. Keep in mind that during the prior financial crisis leadership in much of the world’s leading nations were much more stable. The bottom line here is the current market volatility doesn’t fully reflect the heightened political risks emerging.


US China Trade War

The trade war between the US and China has seen some major fireworks over the past few weeks from the arrest of China’s Huawei’s CFO Meng Wanzhou to Canada granting her bail to rumors that China plans to submit a proposal to reduce its 25% surcharge on US-made vehicles. One day it is acrimony, the next rumors of attrition. What we do know is that China’s economy is weakening, (China imports rose just 3% year-over-year versus expectations for 14%) and the trade wars are having an impact on both nations. Regardless of one’s political preferences on this topic, when the two largest economies in the world go head-to-head, it is going to have a negative impact on global growth in at least the near-to-medium term.

Tying this back to the debt issue, given China’s black box economy with data tightly controlled by its government, it is impossible to have accurate data on just how high the nation’s debt level has reached. Estimates are that China’s total debt has hit more than 300% of GDP(according to the Institute of International Finance), versus the “official’ level of 47%, and Chinese distressed assets have grown by over 25% in the 18 months according to data from PwC.

China’s economic growth has been heavily dependent on ever-rising levels of debt and is showing signs of stumbling. As the world’s second largest economy, when China struggles the world will feel it.

UK Brexit Drama Spikes

The UK was not to be outshined by this week’s Oval Office “disagreement” as its political strife spiked when Prime Minister Theresa May postponed the Parliamentary vote on the agreement she reached with the European Union on fears that it had a snowball’s chance in hell of passing. The EU leaders insist that there will be no fundamental changes made and the Prime Minister survived a vote of no confidence in her leadership the night of December 12thas euro-skeptic MPs attempted a coup against her to wrest control of the final 106 days of Brexit talks. She was forced to agree to not lead the Tories into the next election, which puts her at risk of becoming a lame duck like her German counterpart, Angela Merkel.

We are quickly moving towards the worst of all possible outcomes, at least in the near-to-medium term, with no deal between the European Union and the United Kingdom and the UK lacking any strong leadership as it sails into uncharted political territory. All this uncertainty it a major headwind to economic activity on both sides at a time when people in the UK and the EU are increasingly angry over the lack of improvement in household finances as it has also been struggling under the Middle Class Squeeze. Voters will be looking for more rather than less government spending if/when their respective economies weaken, which means even more debt in a world awash with it.

Paris on Fire

Over the past weekend Paris erupted into violent protests, the magnitude of which is under debate, but the result of which was a clear – a loss a political firepower for France’s President Macron as he agreed to roughly €10 billion in concessions, including a minimum wage hike and tax breaks for employers. Many in France have also been suffering from Middle Class Squeeze and are frustrated by their leaders’ ongoing inability to shift the economy into something that provides them with better opportunities. Their demands mean more government spending which means more debt.

France is now on track to have the biggest budget deficit in the EU next year and Macron’s credibility and political power have taken a serious blow. This is yet another dangerous blow to the European Union.


Italy Sees and Opportunity

While Paris was burning, Italy’s Matteo Salvini and Claudio Borghia were loving (and tweeting)  what this would likely mean for their budget talks with Brussels, who as you may recall had sent the Italian leadership back to the drawing board in Rome to hammer out a budget with a smaller deficit. To put their deficit in perspective, the rejected plan was for 2.4% of GDP versus the US on track this year for over 6.6%. The troubles in Paris may give Rome confidence to push back against Brussel’s demands as they meet on December 12th. Late on the night of Wednesday December 12thrumors started to fly that perhaps the Italians would reduce the planned deficit to 2% of GDP. Either way, Italy is facing a weak and weakening economy with nearly €200 billion of Italian bonds coming due next year that will need to be reissued in addition to its current deficit.

Fighting Brussels is one thing, but the debt markets are another thing entirely and they are not pleased with what they see as evidenced by the widening spread between the Italian and the German 10-year, which has reached the highest level since the worst of the eurozone crisis. Moody’s has downgraded Italy’s rating to Baa3 while S&P and Fitch held their ratings but downgraded the nation’s outlook. If Italy’s economy weakens further, and its economy already contracted by -0.1% in the third quarter versus the prior, it could lose its investment grade standing which would have a major impact on bond markets as Italy’s external debt was $2.5T at the end of 2017.

When it comes to the problems arising from Aging of the Population and the Middle Class SqueezeItaly is in even worse shape than the United States and its banks still hold an elevated level of domestic debt. The employment situation is worsening.

The banking sector is quite vulnerable.

Italy, like France and the UK, is facing voters who a frustrated with the lack of improvement in the household finances and the populist movements sweeping across them are looking for governments to spend their way into national prosperity. Neither Italy, France, Germany nor the UK have strong or stable political leadership and GDP growth is faltering. This is not good.

According to data from the International Monetary Fund’s October 2018 Edition of the World Economic and Financial Survey, since the inception of the unified currency, Italy has seen all of a 1% increase in its per capita GDP (as measured by chained domestic currency) while even beleaguered Greece has enjoyed a 5% increase. On the other end of the spectrum Ireland has seen its per capita GDP nearly double with an increase of 89%, Germany is in second place with a 29% improvement while the US and the UK both have seen a 25% improvement. Is it any wonder that voters in Italy are becomingly increasingly skeptical of the euro?


Putting it all together

In our last Context & Perspective piece I discussed how we are seeing a profound decline in the level of liquidity at a time when debt levels are back to record highs. In this week’s piece, I discuss the trends across major parts of the world that are likely to lead to even more debt. We look to be in the final innings of what the master investor Ray Dalio of Bridgewater Associates refers to as the debt super-cycle. These cycles tend to run 50-75 years and we are today at the far end of that range with excessive leverage across much of the world, highly concentrated lending portfolios and a mismatch between assets and liabilities and/or liabilities and asset cash generation potential.
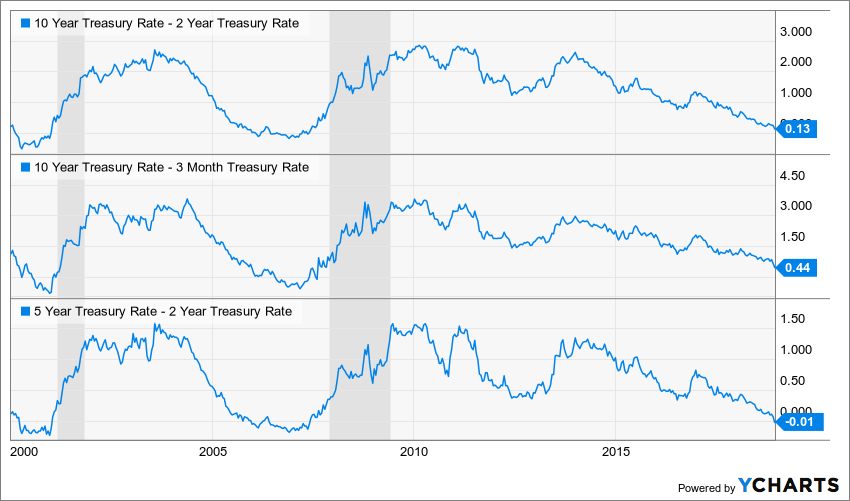
We’ll be talking about this more in the coming months but before then, I highly recommend Mr. Dalio’s free book on how to navigate a debt crisis, which you can get a copy of here. The impact of all this debt on the economies of the world will have a profound impact on tomorrow’s investable markets.