More Signs of a Slowing Economy
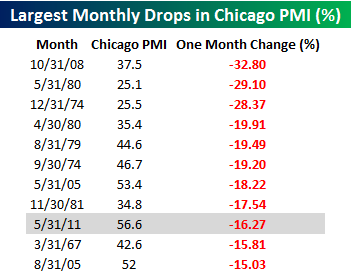
The Chicago PMI released today showed May had the ninth largest percentage decline in the index going back to 1967. In terms of points, this month’s drop ranks as the fourth largest. This table highlights all monthly declines in the Chicago PMI of 15% or more. 
So what does this mean for the markets? The markets historically haven’t been terribly correlated with news of this nature.
The chart below shows the performance of the S&P one year after each of these reports came out.
| Date | S&P | S&P Year later | % Change |
| 10/31/2008 | 968.75 | 1,036.19 | 6.96% |
| 5/31/1980 | 111.24 | 132.59 | 19.19% |
| 12/31/1974 | 68.56 | 90.19 | 31.55% |
| 4/30/1980 | 106.29 | 132.81 | 24.95% |
| 8/31/1979 | 109.32 | 122.38 | 11.95% |
| 9/30/1974 | 63.54 | 83.87 | 32.00% |
| 5/31/2005 | 1,191.50 | 1,270.09 | 6.60% |
| 11/30/1981 | 126.35 | 138.53 | 9.64% |
| 3/31/1967 | 90.20 | 90.20 | 0.00% |
| 8/31/2005 | 1,220.33 | 1,303.82 | 6.84% |
With the exception of 1967, the S&P500 generated a decent return one year later.
