Key points inside this issue:
- The Duke University/CFO Global Business Outlook survey surprises the market
- Costco stumbles, but it is far from down and out
- Thematic confirmation had in the November Retail Sales Report
- Digging into Friday’s other economic reports
- What to watch this week
- Holiday Housekeeping
The Duke University/CFO Global Business Outlook survey surprises the market
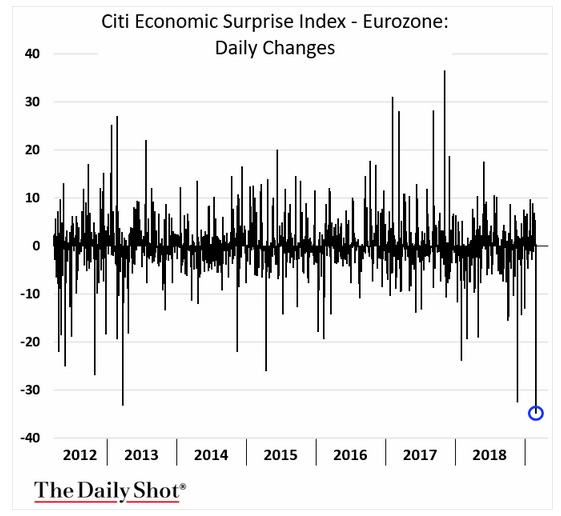
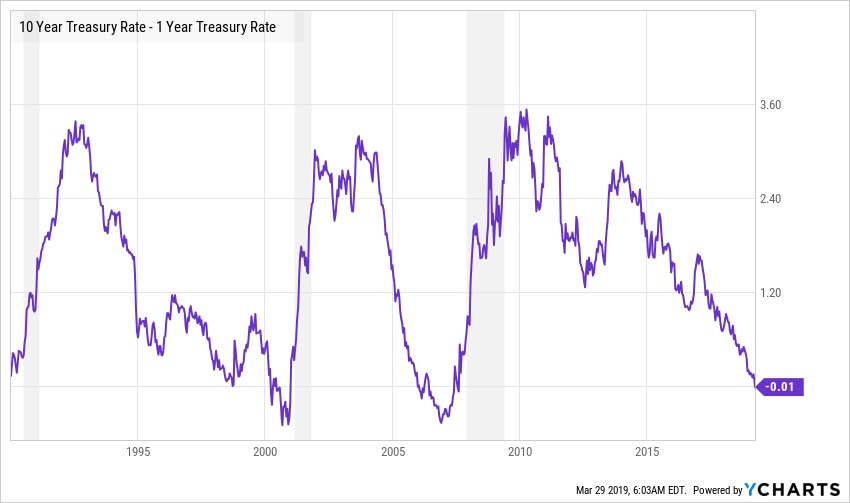
What looked to be shaping up as a positive week for the stock market turned on its head Friday following renewed concerns over the pace of the global economy. As we’ve talked about recently, the vector and velocity of the latest economic reports suggest a slowing economy and that is fueling questions over the top and bottom-line growth prospects for 2019.
Tossing some logs on the that fire late last week was the new survey findings from the Duke University/CFO Global Business Outlook survey that showed almost half (48.6%) of US chief financial officers believe the United States will be in recession by the end of next year while 82% of CFOs surveyed believe that a recession will begin by the end of 2020. That’s quite different than the Wall Street consensus, which per The Wall Street Journal’s Economic Forecasting Survey sees the speed of the economy slowing from 3.5% in the September 2018 quarter to 2.5% in the current one to 2.4% in the first half of 2019 followed by 2.2% in the back half of the year.
This revelation has added to the list of concerns that I’ve been discussing of late and adds to the growing worries over EPS growth prospects in 2019.
Costco stumbles, but it is far from out
Last Thursday night, Costco Wholesale (COST), our Middle-Class Squeeze Thematic Leader, reported an EPS beat by $0.05 per share for the quarter, but revenue came in a tad short at up 10.3% year over year, or $34.3 billion vs. the expected $34.66 billion. Same-store sales for the quarter rose 8.8% (+7.5% ex-gasoline and currency), which is well above anything we’ve seen for the September-November period per Friday’s November Retail Sales report save for digital shopping (Non-store retailers) and gas station sales – more on that shortly.
Despite the positive EPS, COST shares fell 8.6% on Friday.
The issue with Costco was the margin profile as reported operating income was essentially flat year over year. When combined with the top line increase vs. the year-ago quarter it means the company’s operating margin hit 2.7% vs. 3.0% in the year-ago quarter, and 3.2% this past August quarter. Part of the issue was the jump up in pre-opening expenses for new warehouse locations which rose by 6% quarter over quarter. The real culprit was the step up in merchandising costs, which climbed 10.8% year over year for the November quarter vs. 5.4% year over year in the September quarter. Clearly, Costco is seeing the impact of not only higher prices but also the impact of tariffs associated with the U.S.-China trade war.
Despite that, the core basics at the company – foot traffic, renewal rates, and membership growth – continue to fire on all cylinders. That to me makes Costco one of the best-positioned retailers, and the fact that its e-commerce business continues to blossom is positive as well. In all of 2019, Costco looks to open 20-23 net new warehouses, which equates to an increase of 2.5%-3.0% year over year. This will likely drive pre-opening expenses higher in the coming months, but given the favorable metrics associated with each new location over the medium to longer-term, we’ll take it, especially if the economy slows more than expected. Odds are that will drive more consumers to Costco than not.
- Our long-term price target on Costco Wholesale (COST) shares remains $250.
Thematic confirmation in the November Retail Sales Report
Looking over Friday’s November Retail Sales Report, core Retail Sales rose 4.0% year over year with strong performance as expected for Non-store Retailers (+10.8% year over year), Gasoline Stations (+8.2%) and Food Service & Drinking Places (+5.6%). To me, those first and third categories ring positive for our Digital Lifestyle and Living the Life investing themes. That means I see those as positive signs for our thematic and holiday shopping positioned companies, which includes the aforementioned Costco, but also Amazon (AMZN), United Parcel Service (UPS), McCormick & Co. (MKC), International Flavors & Fragrances (IFF) and Del Frisco’s Restaurant Group (DFRG).
Back to the November Retail Sales report, while the sequential overall retail comparisons came in either as expected or slightly better depending on the forecast one is looking at, what’s likely to catch the market’s attention is the sequential drop in year over year retail sales growth that was had in November. Again, year over year November retail sales growth rose 4.0%, which was down compared to the October year over year increase of 4.5%.
Given the growing amount of data that points to a slowing domestic economy, one that is driven meaningfully by the consumer, odds are market watchers will not love what they saw in those year over year comparisons. Add to it that a recent Gallup poll found that Americans plan to spend less on holiday gifts today than they expected back in October and less than they expected to spend in 2017. The $91 decline in expected spending since October is “one of the steeper mid-season declines, exceeded only by a $185 drop that occurred in 2008, as the Wall Street financial crisis was unfolding, and a $102 drop in 2009 during the 2007-2009 recession.”
Clearly, those latest data points weighed on the overall stock market last week, but those weren’t the only ones.
Digging into Friday’s other economic reports
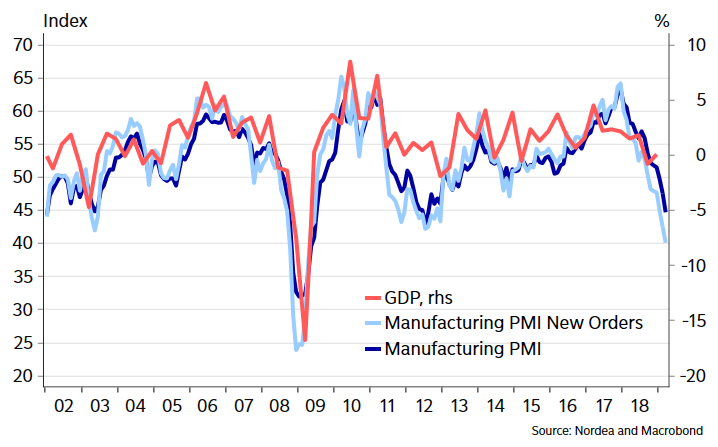
The November Retail Sales report wasn’t the only set of key data that weighed on the market last Friday. The November Industrial Production Report showed a flat manufacturing economy following the modest dip in October. On the December Flash PMI reports, the U.S. hit a 19-month low for the month with softer new order growth, while “Lower oil-related costs contributed to the slowest rate of input price inflation since the start of the year.” Turning to the eurozone, its Composite Output PMI hit 51.3, down from 52.7 in November, and reached a four-year low. The Flash Manufacturing PMI data for Japan was better, as it rose to 52.4 for December up from 52.2 in November, but that is hardly what we would call a robust figure given the expansion/contraction line at the 50.0 level. While new orders activity improved in Japan, new export orders fell, signaling a change of direction, which supports the notion of a slowing global economy.
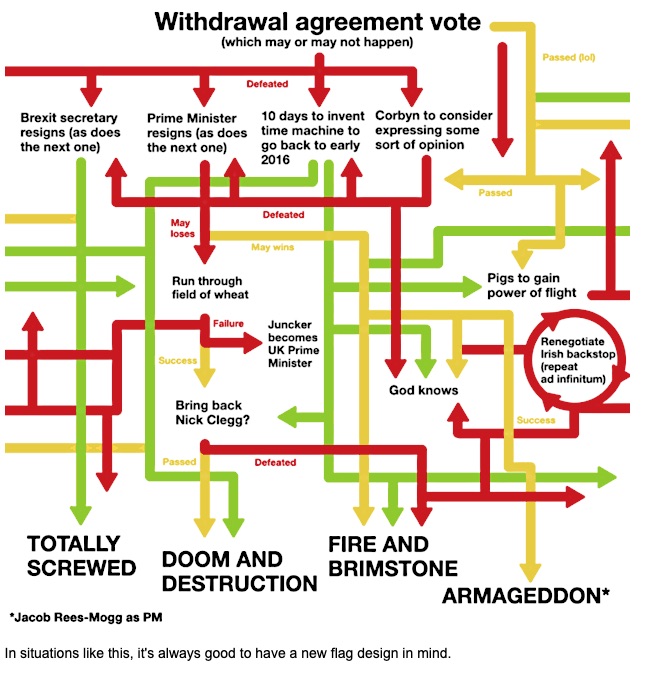
This data along with the back and forth on U.S.-China trade, Brexit developments, Italy budget concerns, protests in France, and the potential government shutdown have all raised investor uncertainty levels. We see this in the current “Extreme Fear” (9) reading on the CNN Business Fear & Greed Index, which is little changed over the last few weeks. We’ve seen this play out in the stock market as the number of stocks hitting new highs pales in comparison to hitting 52-week lows. As one likely suspects, we saw this play out in small cap stocks, which per the Russell 2000 last week, were once again the hardest hit of the major stock categories. Quarter to date, small cap stocks are down just under 17% quarter to date.
We saw a number of these concerns brewing as we exited September and entered the September- quarter earnings season. We have been careful in making additions to the Select List given what I’ve viewed as an environment that has been more skewed to risk than reward. Odds are that will continue to be the case between now and the end of the year, which means we will continue to be overly selective when it comes to deploying capital. For that reason, last week we added the ProShares Short S&P 500 ETF (SH) shares to our holdings to add some downside protection.
What to Watch This Week
Following last week’s rash of economic data, don’t ask me how or why but the Atlanta Fed saw fit to boost its GDP Now forecast for the current quarter to 3.0% from 2.4% last week. As subscribers know, I prefer the far more solid track record at the NY Fed and its Nowcast report, which now calls for the current quarter to be +2.4%, down from +2.44% last week. That’s in line with The Wall Street Journal’s Economic Forecasting Survey, but again that Duke poll is likely to be in the forefront of investor minds this week as more data is had. This includes several pieces of housing data — the November Housing Starts & Building Permits as well as November Existing Home Sales and the October NAHB Housing Market Index — as well as the November Durable Orders Report and November Personal Income & Spending data.
As I mentioned above, the number of economic numbers suggesting the global economy continues to slow are growing, which likely gives the Fed far more room to issue dovish comments after next week’s all but done December rate hike. In recent weeks as the Fed has once again signaled it will more than likely remain data dependent in 2019, we’ve seen a change in the futures market, which is now pricing in less than 20 basis points of rate hikes next year versus over 55 basis points just a few months ago. But we have to consider the reason behind this slower pace of rate hikes, which is the suggestion by recent data that the economy is far from overheating, which also adds to the core question we suspect investors and the market are asking: how fast/strong will EPS growth be in 2019?
As we prepare for Fed Chair Powell’s remarks, it’s not lost on me that we could very well see a “buy the rumor, sell the news” event following the FOMC meeting next week.
Heading down the final stretch of 2018, I’ll be looking at well-positioned companies relative to our investment themes that have been hard hit by the quarter to date move in the market. As of Friday’s market close, the S&P 500 was down X% quarter to date, while the tech-heavy Nasdaq Composite Index and the small-cap heavy Russell 2000 were down 14% and nearly 17%, respectively, on that basis. One of the criteria that I’ll be focusing on as I weed through this growing list of contenders is favorable EPS growth year over year relative to the S&P 500. And, yes, when I say that I do mean to “real” EPS growth due to rising profit margins and expanding dollar profits instead of those lifted largely by buyback activities.
With that in mind, I’ll be paying close attention to a number of key earnings reports coming at us next week. These include Nike (NKE), Carmax (KMX), ConAgra (CAG), General Mills (GIS), Micron (MU), FedEx (FDX) and Darden Restaurants (DRI). Inside these reports and company commentaries, I’ll be looking for data points that to confirm our investment themes, the question of inflation vs. deflation and where it may be, and a last-minute update from FedEx on digital commerce for this holiday shopping season that we are all in the thick of. Also, among those reports is Del Frisco’s competitor – The Capital Grill, which is owned by Darden. I’ll be paying extra close attention to that report and what it means for our DFRG shares.
Holiday Housekeeping!
And that brings us to our Housekeeping note, which is this – given the way the Christmas and New Year’s holidays fall this year, barring any unforeseen issues that will require our attention and immediate action, we here at Tematica will be in “get ready for 2019” mode. That means we’ll be using the quiet holiday time to review the Thematic Leaders as well as positions on the Select List to ensure we are well prepared for the coming months ahead.
As such, we’re likely to be back the week of January 7th, although I can’t rule out the urge to share some thoughts with you sooner. For example, if the Fed says something that rolls the stock market’s eyes later this week, I’ll be sure to weigh in and share my thoughts. The same goes for the Darden earnings report I mentioned above and what it may mean for our DFRG shares.
We will have a new podcast episode or two before then, and we will be sharing a number of Thematic Signals over the coming weeks – if only those confirming signs for our investment themes would take a break. I’m only kidding, but of course, I love how recognizable and relatable the themes are in and around our daily lives.
To you and your loved ones, Merry Christmas, Happy Holidays, and Happy New Year! See you 2019!!

