The Magic 8-Ball Market

The Magic 8-Ball Market

Last week ended with equity markets taking another dive that accelerated into Friday’s close as the trade war with China intensified heading into its eighteenth month with China announcing that it will impose retaliatory tariffs on US goods. The S&P 500 closed down 2.5% for the third time this month. After the close President Trump launched a twitter storm to announce additional retaliatory tariffs in response to China’s. So that’s going well.

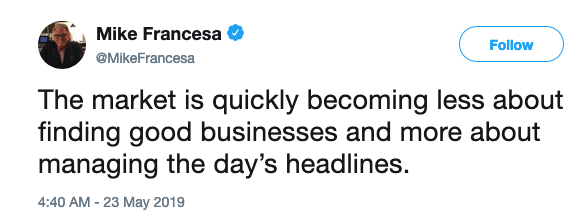
Investors face challenging times as the major market movers have simply been words (tweets) coming from politicians and bureaucrats, the prediction of which is akin to assessing the next missive from a Magic 8-Ball.

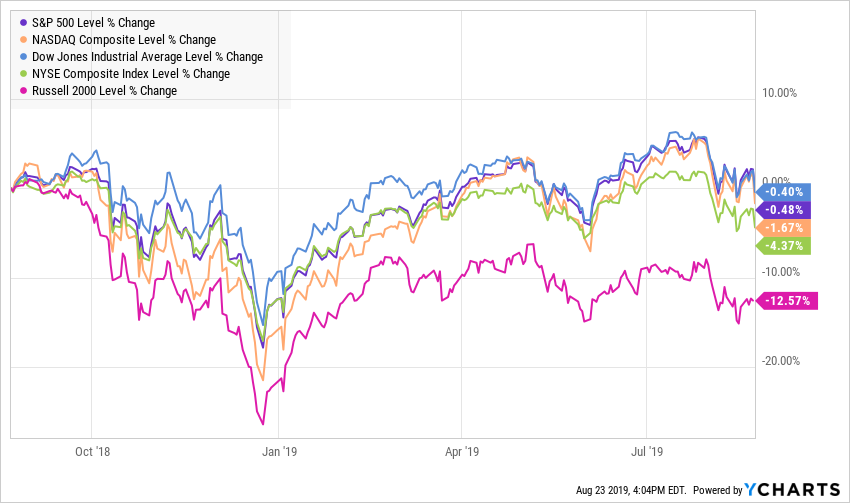
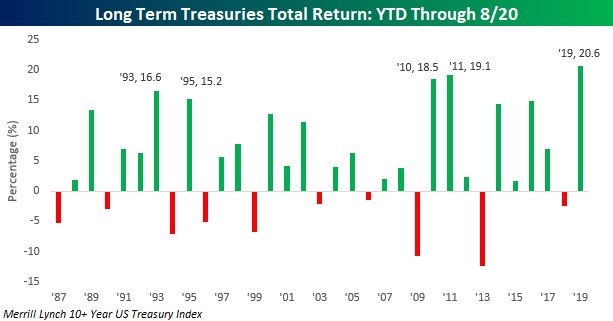
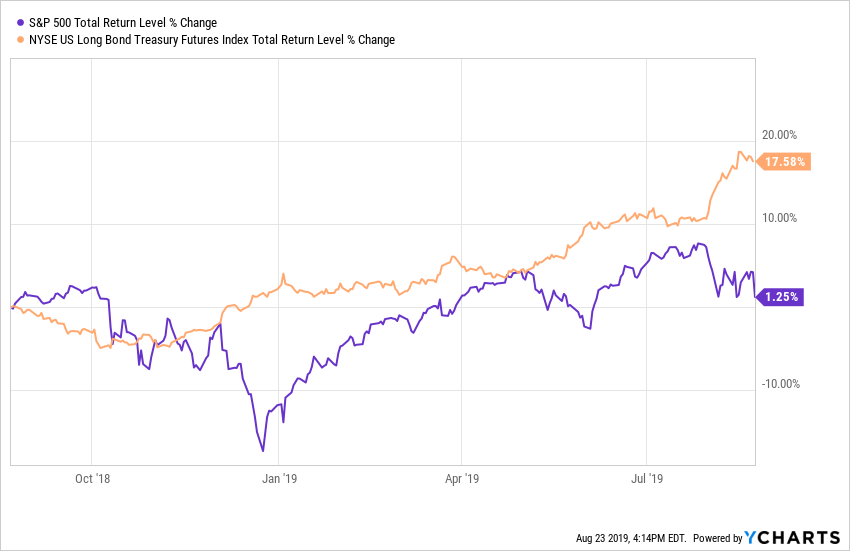
While many continue to talk about the ongoing bull market, the major US equity market indices have seen four consecutive weekly declines and are all in the red over the past year with the small cap Russell 2000 down well over 10%, sitting solidly in correction territory. On the other hand, this year has seen the strongest performance out of long-maturity Treasuries since at least 1987.
Source: Bespoke Investment Group

How many bull markets see the total return for the long bond outpace the S&P 500 by over 16%.
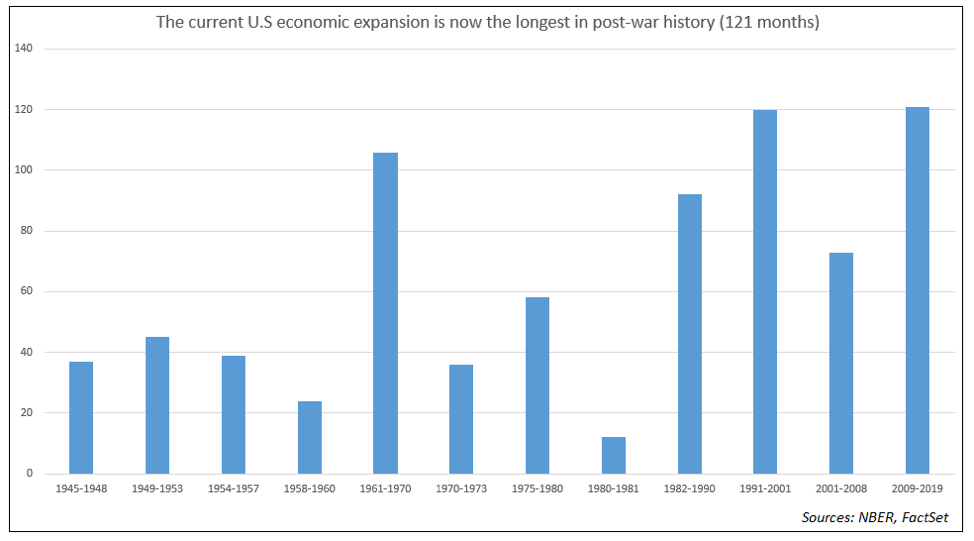
This comes at a time when the domestic economy is in it 121st month, the longest is post-war history, which means that many have not lived through a recession as an adult.

Yield Curve

As the adage goes, expansions don’t die of old age, but their footing becomes less sure over time and we are seeing signs of rockier terrain. One sign comes from the yield curve which has been flattening steadily since October 2018 with the spread between the 10-year and the 3-month falling from over 100 basis points to -39. The most widely watched part of the curve, between the 10-year and 2-year, has inverted four times in the past few weeks.
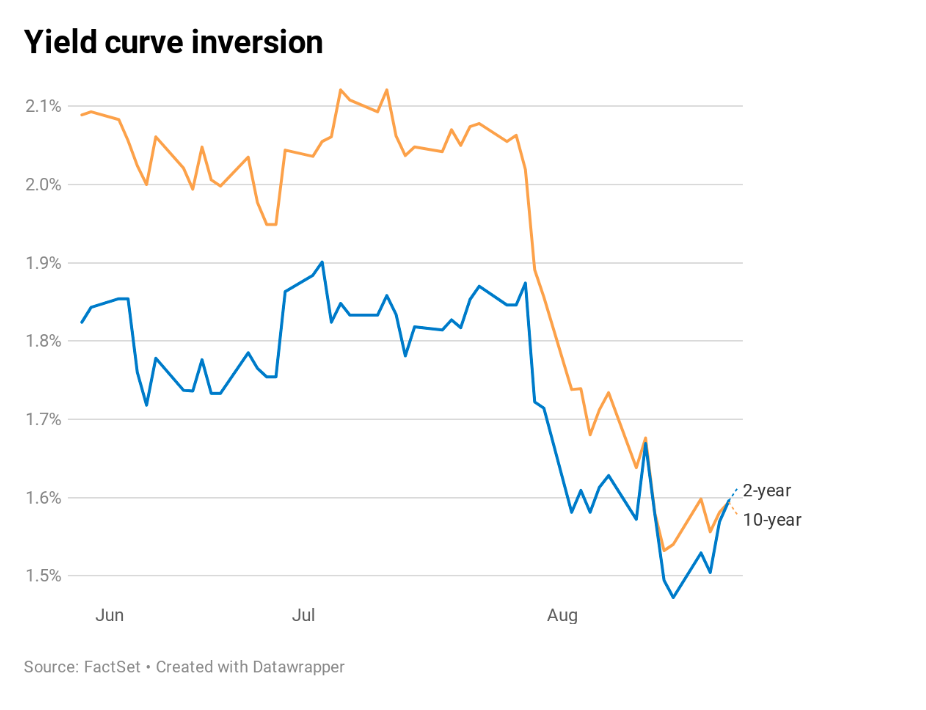

This 2-10 inversion is most closely watched as over the past 50 years it has preceded all seven recessions. Credit Suisse has found that on average a recession hit 22 months after the 2-10 inversion occurred.

The third of August’s four inversions came as Kansas City Federal Reserve President Esther George and Philadelphia Fed President Patrick Harker stated in a CNBC interview that they don’t see the case for additional interest rate cuts following the cut in July. Mr. Market was not looking to hear that.

This past week we also received the meeting minutes from the prior Fed meeting with led to July’s 25 basis point cut which gave the impression of a Fed far less inclined to cut than the market was expecting with most Fed participants seeing July’s cut as part of a recalibration but not part of a pre-set course for future cuts. Keep in mind that central bank rate cuts are a relative game and ECB officials have been signaling a high likelihood of significant accommodative measures at the September meeting, saying the ECB “will announce a package of stimulus measures at its next policy meeting in September that should overshoot investors’ expectations.”

Manufacturing

Another source of bumps on the economic road comes from the manufacturing sector, both domestic and international. A recent IHS Markit report found that the US manufacturing sector is in contraction for the first time in nearly a decade as the index fell from 50.4 in July to a 119-month low of 49.9 in August – readings below 50 indicate contraction.

According to the Institute for Supply Management, US manufacturing activity has slowed to a nearly three-year low in July. By August New Orders (a key leading indicator) had dropped by the most in 10 years with export sales falling to the lowest level since August 2009.

New business growth has slowed to its weakest rate in a decade, particularly across the service sector. Survey respondents mentioned headwinds from weak corporate spending based on slower growth expectations both domestically and internationally – likely caused by the ongoing trade war that got much, much worse this past week.

In a note to clients on August 11th, Goldman Sachs stated that fears of the US-China trade war leading to a recession are increasing and that the firm no longer expects a trade deal between the two before the 2020 US election. The firm also lowered its GDP forecast for the US in the fourth quarter by 20 basis points to 1.8%.

Global manufacturing has also been slowing, with just two of the G7 nations, Canada and France, currently showing expansion in the sector. In July, China’s industrial output growth slowed to the weakest level in 17 years.
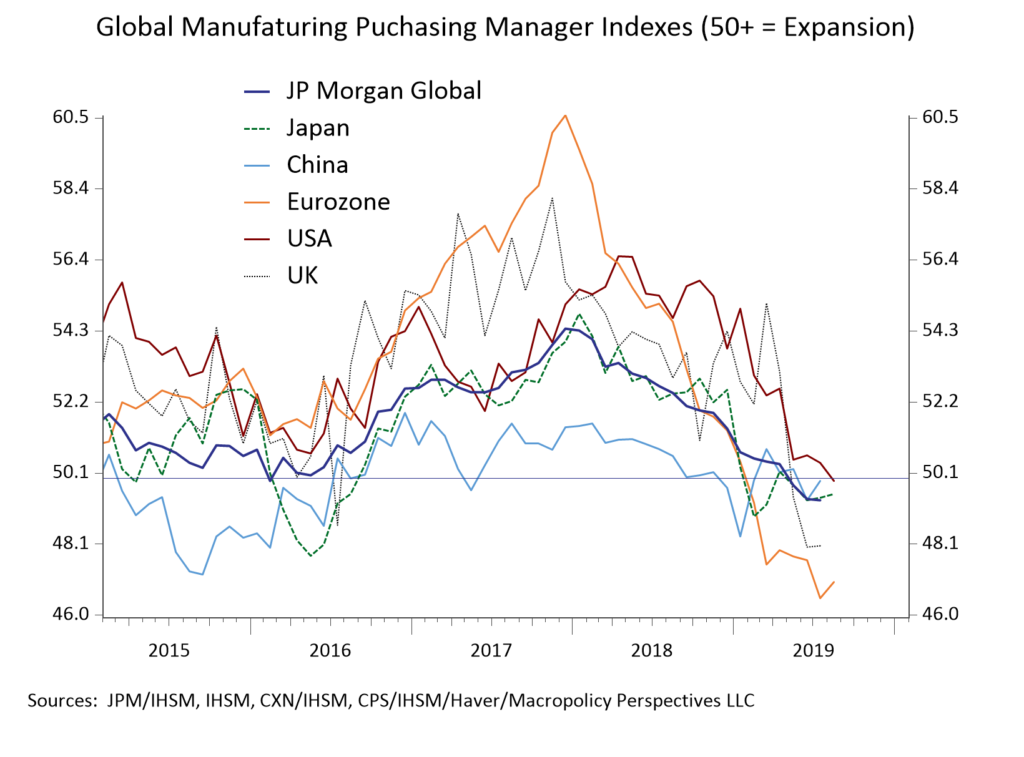
Germany is seeing the most pronounced contraction with its manufacturing PMI dropping from 63.3 in December 2017 to 43.6 this month. German car production has fallen to the levels last seen during the financial crisis.
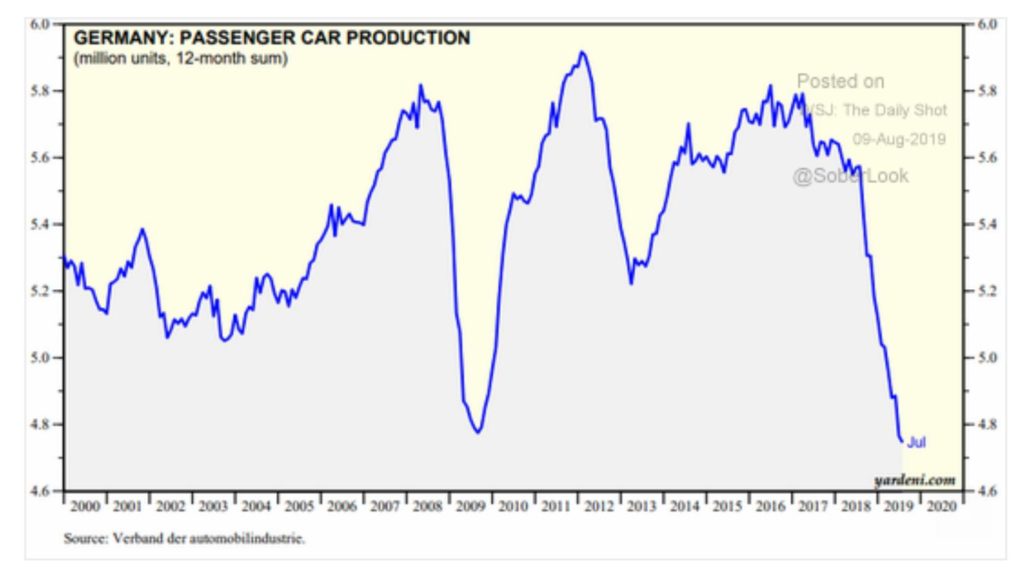
Overall, we see no sign of stabilization in global manufacturing as global trade volumes look to be rolling over, leaving the economy heavily dependent on growth in the Consumer and the Service sectors. Keep in mind that the last time global trade volumes rolled over like this was back in 2008.

The Consumer

The consumer is yet another source of bumps on the economic road. Ms. Pomboy’s tweet is perfect.
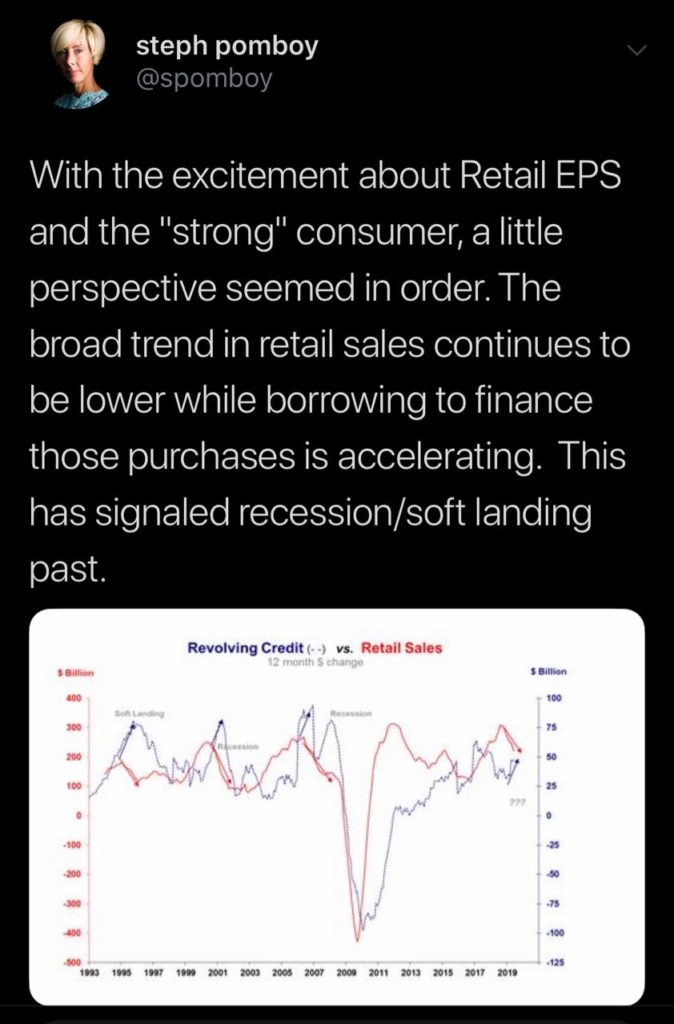
As for that debt, Citigroup recently reported that its credit-card delinquency rate had risen to 2.91% in July from 2.56% in June versus its three-month average of just 1.54%. With all the positive stock moves we’ve seen in retail, keep in mind that the story for many has been more about earnings than actual growth.

For example, Nordstrom (JWN) shares rose 21% after it delivered stronger-than-expected earnings, but that was off of weaker than expected revenue of $3.87 billion versus expectations for $3.93 billion. Nordstrom also slashed net sales guidance for the fiscal year as well as earnings guidance. Management forecast net sales for the year to decrease by about 2%. It previously estimated sales would be flat to 2% down. It also slightly lowered guidance on earnings per share to a range of $3.25 to $3.50, compared with the prior guidance of between $3.25 to $3.65. Did I mention shares rose 21%?

US Consumer sentiment fell to 92.1 in August, the lowest reading for 2019, versus expectations for 97 and down from 98.4 in July. If sentiment continues to degrade, how long will the consumer continue to load up credit cards in order to spend?

Debt

It isn’t just the consumer that is taking on more debt – yet more economic bumps. The federal government deficit rose by $183 billion to $867 billion during just the first 10 months of this fiscal year as spending grew at more than twice the rate of tax collections. The Congressional Budget Office expects the annual budget deficit to be more than 1 TRILLION dollars a year starting in 2022. Total public debt, which includes federal, state and local has reached a record 121% of GDP in 2019, up from 69% in 2000 and 43% in 1980.
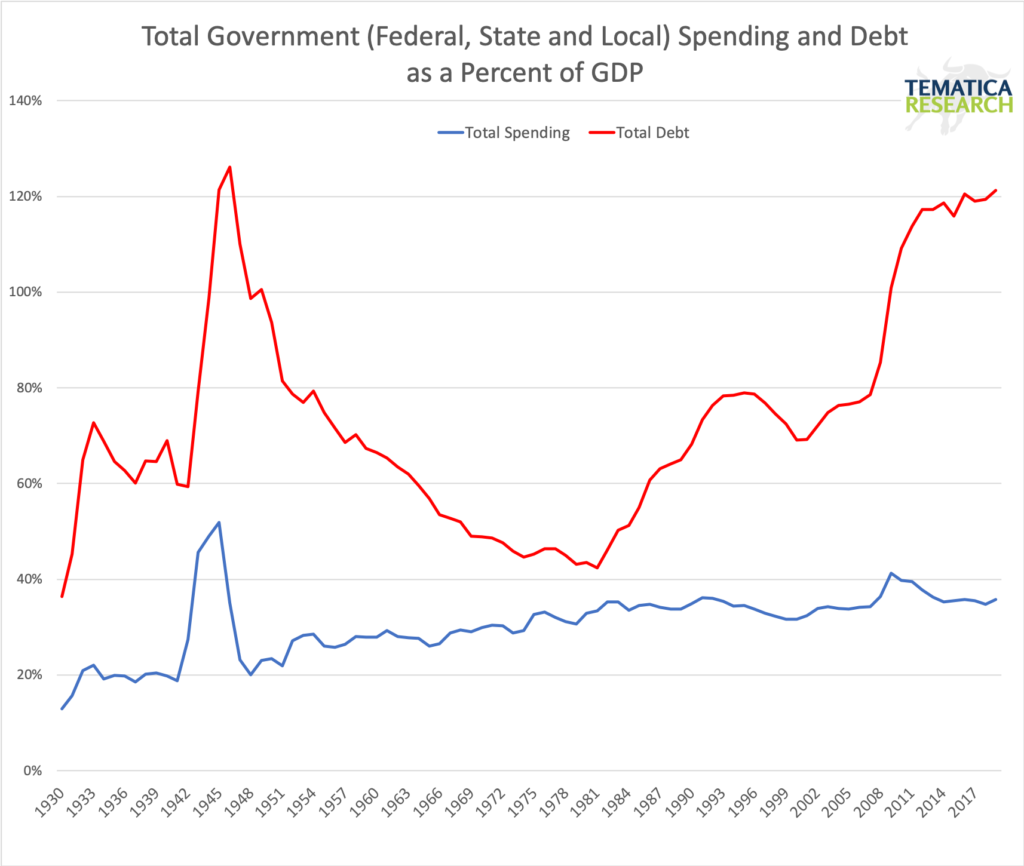
Keep in mind that debt is pulling resources out of the private sector and at such high levels, fiscal stimulus becomes more challenging in times of economic weakness. The only time debt to GDP has been higher was after WWII, but back then we had relatively young population and a rapidly growing labor force compared to today.

I’ve mentioned before that I am concerned with the strengthening dollar. Dollar denominated on balance sheet debt is over $12 trillion with roughly an additional $14 trillion in off-balance sheet dollar denominated debt – that’s a huge short USD position. The recent resolution of the debt ceiling issue means that the US Treasury now needs to rapidly rebuild its cash position as I had been funding the government through its reserves. This means that we will see a drain on global liquidity from the issue of over $200 billion in Treasury bills.

I’ve also written many times in the past concerning the dangers that lie in the enormous levels of corporate debt with negative yielding corporate debt rising from just $20 billion in January to pass the $1 trillion mark recently – more bumps on the road.

Bottom Line

As I said at the start of this piece, this expansion is the longest in post-war history which doesn’t itself mean a recession is imminent, but it does mean that the economy is likely to be more vulnerable. Looking next at the economic indicators we see quite a few that also imply a recession is increasingly likely.

The President’s twitter storm in response to China’s tariffs and the continually rising geopolitical uncertainties that create a strong headwind to any expansions in the private sector only increase risks further. Perhaps by the time you read this piece some part of the rapid escalation of the trade war will have been reversed, as foreign policy has become increasingly volatile day-to-day, but either way, the view from here is getting ugly.

Seeing Through the Smoke of the Trade War

Seeing Through the Smoke of the Trade War

I’d like to open this week’s piece with a bit of Twitter wisdom – as much as an oxymoron as that sounds.

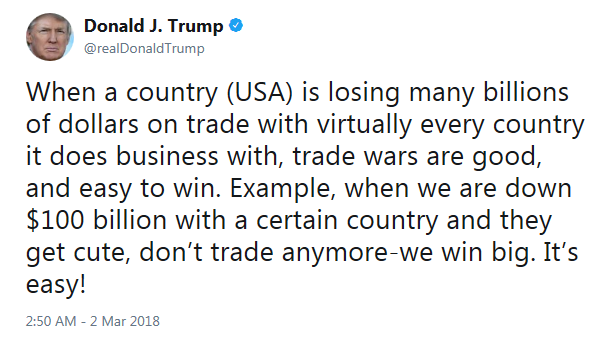
The impact of Federal Reserve Chairman Powell’s sweet whispers to the market that the 2018 rate hikes are on hold for 2019 is wearing off as politics and trade tensions dominate the markets. I’m going to go out on a limb here and suggest that prescriptions for Xanax and the like have been on the rise inside the beltway in recent weeks. Those headlines investors are trying to navigate around are dominated by talk of the trade war with China, which has evolved from last year’s Presidential tweet.

Fourteen months later, the May 23rd, 2019 comment from Ministry of Commerce spokesperson Gao Feng in Mandarin, (according to a CNBC translation) casts a different tone.

“If the U.S. would like to keep on negotiating it should, with sincerity, adjust its wrong actions. Only then can talks continue.”

So that’s going well. China appears to very much be digging in its heels and preparing for a prolonged battle. We are hearing talk of a ‘cold war’ on the tech sector and the New York Times wrote, “Mnuchin Presses Companies For Trade War Contingency Plans.”

With all that, it is no wonder that the CBOE S&P 500 Volatility Index (VIX) has moved above both its 50-day and 200-day moving average.

May has not been kind to the major US indices.

^SPX Chart

^SPX data by YCharts

Many market bellwethers that had previously been investor darlings are in or shortly will be in correction territory.

GOOGL Chart

GOOGL data by YCharts

But the US economy is strong right? As we’ve mentioned in prior pieces here and here, not so much. This week the Financial Times reported that non-performing loans at the 10 largest commercial US banks rose 20% in the first quarter. That was in a quarter in which GDP came in above 3% and above expectations. What happens in a weak quarter? Those banks aren’t being helped by falling interest rates either, which crush their margins. The yield on the 10-year Treasury note has fallen below the mid-point on the Fed’s target range for the overnight funds rate. A flat-to-inverted yield curve just screams economic party-on.

As we look at growth in the second quarter, remember that the first quarter build-up in inventories was a function of the trade war. Businesses were stocking up before tariffs and in response to all the uncertainty. This buildup was a pull forward in demand for stockpiling which serves as a headwind to growth in later quarters.

We are also seeing reports of trade war related supply chain disruptions, which means declining productivity. Remember that the growth of an economy is a function of the growth of the labor pool (all but tapped out) and growth in productivity. The Atlanta Fed’s GDPNow estimate reflects this with second quarter growth down to 1.3% from 1.6% on May 14th. Following the week’s slump in April core-capital goods orders the New York Fed’s Nowcast reading for the current quarter fell to 1.4% from 1.8% last week.

While the headlines are dominated by the trade wars or the latest drama in DC, what most aren’t watching is the most important factor in the global economy today – the rising dollar.

The US Dollar Index (ICE:DX) has been in a steady uptrend for over a year.

The broader Federal Reserve Trade Weighted US Dollar Index has broken above is December 2016 high and may be on its way to new all-time highs – if it breaks above 129.85, we are in unchartered territory.

Why does the dollar matter so much? About 80% of global trade relies on the US Dollar. Last year the Fed’s rate hikes drove up the price (AKA interest rate) of the dollar for other countries. As the US looks to reduce its trade deficit with many of its trading partners, that means less dollars available outside of the US. When the US imports, goods and services come into the country and dollars leave. A shrinking trade deficit creates a double whammy on the dollar of rising interest rate effects (higher price) and a reduction in supply.

The rising dollar obviously hurts the sales of US companies internationally, (think on this in light of that 20% rise in non-performing loans at US banks) but it is also major headwind to emerging markets, particularly given the massive amount of US dollar denominated debt in emerging economies. As quantitative easing pushed the dollar down, emerging economies gorged on US dollar denominated debt. That seemingly free lunch is now getting expensive, and if the dollar breaks into unchartered territory, that free lunch could turn into spewed chunks.

In addition to the problems with existing dollar denominated debt, the rising dollar increases the scarcity of capital in emerging markets. As the dollar increases relative to another nation’s currency, domestic asset values decline which means banks are less willing to lend. Investment declines and there goes the growth in emerging economies.

With respect to China and the dollar, as the US imposes tariffs on China, the roughly 8% decline in the renminbi versus the US Dollar has helped to offset the impact. This week the renmimbi dropped to nearly a six-month low, falling briefly below 7. To put that move in context, from the mid-1990s to July 2005, China had pegged its currency to 8.28 to the dollar. It only dropped below 7 in 2008 before the nation halted all movement as the financial crisis rolled across the globe. Trading resumed in 2010 officially within a managed band of a basket of currencies, but in practice primarily against the dollar. The big question now is will China let the renminbi stay below the 7 mark.

As global trade slows amidst trade wars, rising populism and dollar scarcity, exports in April in Asia showed the strain.

  • Indonesia -13.1%
  • Singapore NODX -10%
  • Taiwan -3.3%
  • China -2.7%
  • Thailand -2.6%
  • Japan -2.4%
  • South Korea -2%
  • Vietnam 7.5% (woot woot)

Looking at South Korea, semiconductors account for 1/5th of the nation’s exports and we’ve seen global semiconductor sales decline the fastest since 2009. With the ubiquitous nature of these chips, this says a lot above overall global growth. And that’s before the growing ban placed on China telecom company Huawei, which reportedly consumes $20 billion of semiconductors each year, is factored into the equation.

Worldwide Semiconductor Sales Chart

Worldwide Semiconductor Sales data by YCharts

It isn’t just the emerging economies that are struggling with a rising dollar. The Brexit embattled UK, (who just lost its current Prime Minister Theresa May) has seen its currency weaken significantly against the dollar, losing around 25% over the past 5 years – effectively a 25% tax on US imports from currency alone.

Pound Sterling to US Dollar Exchange Rate Chart

Pound Sterling to US Dollar Exchange Rate data by YCharts

The euro hasn’t fared well either. While above the 2017 lows, it has lost nearly 20% versus the dollar in the past 5 years – effectively a 20% tax on US imports from currency alone.

Euro to US Dollar Exchange Rate Chart

Euro to US Dollar Exchange Rate data by YCharts

If all that isn’t enough to get your attention, then just wait until later this summer when we have another debt ceiling drama to which we can look forward. With how well the left and right are getting along these days on Capitol Hill, I’m sure this will be smooth sailing. With volatility still relatively low (but rising) perhaps putting on a little bit of protection on one’s portfolio would be in order?

And on that note, have a great holiday weekend!

WEEKLY ISSUE: What September May Bring

WEEKLY ISSUE: What September May Bring

Alright, alright, alright! Welcome back from the last bit of summer vacation, and it’s back to business for companies and stocks. We’ve moved from sleepy August to September, historically one of the most volatile months for stocks. Over the last few weeks, we’ve chin-wagged quite a bit over the items that could disrupt the market, but as happens from time to time, something appears out of thin air that is an unexpected disruptor. Last week that was the damage done by Hurricane Harvey, and now we have not just one but potentially two more hurricanes to contend with – Irma and Jose. Also adding to the news mix was the return of North Korea, following its nuclear test over the holiday weekend.


WE KNOW ONE THING SEPTEMBER WILL BRING . . . DRAMA

Normally after the Labor Day weekend, we see trading volume return to normal and the “B-team” that was covering trading desks replaced by the A-team. As they return, those players pore over data and happenings over the last few weeks that they’ve been away. This helps explain why September tends to be one of the more volatile months for stocks.

Another reason for the September volatility spikes is that in the coming days we’re going to see a return of investor conferences, and companies presenting at these events will give their first update since reporting 2Q 2017 earnings back in July. These updates will shape the tone of the second half of the year, and as we’ve shared previously, expectations call for meaningful EPS growth compared to the first half. In the coming days, we’ll start to see if those forecasts are as aggressive as we think they are given the speed of the economy.

We already know that Harvey and Irma will be and near-term economic shock to the system, likely resulting in a meaningful hit to GDP in the current quarter. In the coming days and weeks, we expect to hear retailers, restaurants, insurers, and others that have been impacted by Harvey reset expectations, and that is likely to weigh on the market near-term.  Eventually, we’ll see a snap back as rebuilding occurs in the coming months, but that will benefit a different set of companies than those affected. With that in mind, yesterday, we posted our thoughts on what the fallout could mean from the Harvey-Irma combination and shared a who’s who of stocks that are likely beneficiaries. With Jose being added to the mix, things could be even brighter for that list of companies we’re scoping out.

Cocktail Investing: Hurricane Harvey and its Impact on the Markets and EconomyAs we wait to see the incremental impact to be had from both Irma and Jose, let’s remember something we called out on last week’s Harvey focused podcast – the rebuilding effort, including federal relief, could trigger a sooner than expected debt ceiling coverage. Now we’re getting wind that the Republican Freedom Caucus is opposed to attaching a funding request for Hurricane Harvey aid to a debt limit increase and on the news that President Trump ended the Deferred Action for Childhood Arrivals (DACA) program. There has been no shortage of DC drama these last several weeks, and as we noted a few weeks ago, and with the debt ceiling discussion and tax reform taking center stage that DC drama is likely to extend its current run in the center ring.

We see this a one drama replacing another, with the one replaced being the Fed’s expected September balance sheet unwinding. In our view, following the near-term economic impact by Harvey and potentially the other hurricanes odds are the Fed will hold off with its balance sheet unwinding for a few more months. Even Federal Reserve Governor Lael Brainard argued this week the economic effects of Hurricane Harvey “raise uncertainties about the economic outlook for the remainder of the year” and argued for “a wait-and-see approach” before raising rates again. We’ve already seen another push out in rate hike expectations, and as balance sheet unwinding slips closer to the end of the year we’ll likely see yet another push out for the next Fed rate hike as well.

Putting these pieces together – hurricanes and the GDP impact, ongoing DC drama, and companies poised to reset guidance – it’s no surprise we’ve seen the Volatility Index perk up yesterday. Again, as the A-team on Wall Street has returned to their saddles. Most likely this means a thorough going over with an extra eye on risk management, as the herd looks to lock in profits.

We’ll be doing the same – revisiting thematic data points that reside in our own Thematic Signals and elsewhere – to do a review of positions on the Tematica Select List. As you saw with our recent exit of Dycom (DY) shares, we’re not ones to fall in love with the positions, but as you saw yesterday when we added to Costco (COST) shares when we see a mismatch between fundamentals and stock price performance, we’ll take action.


Thematic Data points this week — Apple & Universal Display

We have no companies reporting earnings this week, but we will be looking at thematic data points found in results from Safety & Security company American Outdoor Brands (AOBC), Cashless Consumption contender VeriFone (PAY) and Affordable Luxury company Restoration Hardware (RH). Next Tuesday, September 12th, Apple (AAPL) is set to take the wraps off its next iPhone iteration and this means we’ll finally get the official word on Apple’s use of organic light emitting diode displays. As we recently cautioned, there tends to be much build up ahead of these Apple events, and there is a history in the post-Steve Jobs era of them underwhelming. If that happens, we could see shares of Disruptive Technology position Universal Display (OLED) come under some pressure. Given the accelerating adoption of the technology across a variety of applications beyond smartphones, we would view any pullback as an opportunity.

  • At current levels, subscribers should “Hold” Universal Display (OLED) shares rather than commit fresh capital.
  • Our price target remains $135, but given expanding market applications for its products and licensing business, we’re inclined to be owners of the shares for the medium to longer term.


Be sure to check the website as well as your email for updates and other alerts as we share more thematic insights and actions during the week.