Boosting Price Target on UPS Shares Amid eCommerce Surge

Boosting Price Target on UPS Shares Amid eCommerce Surge

Key Points from this Post:

  • We are boosting our price target on United Parcel Service (UPS) shares to $130 from $122. Our new price target is a tad below the high end of the price target range that clocks in at $132, and offers an additional 7.6% upside from current levels.
  • As additional holiday sales shopping forecasts are published, we’ll be double and triple checking our UPS price target for additional upside.
  • Our price target on Amazon (AMZN) shares remains $1,150.
  • Our price target on Alphabet (GOOGL) shares remains $1,050


We have long said that United Parcel Service shares are the second derivative to the accelerating shift toward digital shopping. Whether you order from our own Amazon (AMZN), Nike (NKE), Wal-Mart (WMT), William Sonoma (WSM) or another retailer, odds are UPS will be one of the delivery solutions.

As we enter 4Q 2107 this week, we’re seeing rather upbeat forecasts for the soon to be upon us holiday shopping season. We’d note that most of these forecasts focus on the period between November and December/January, more commonly known as the Christmas shopping and return season that culminates in post-holiday sales that have retailers looking to make room for the eventual spring shopping season. With Halloween sales expected to reach $9.1 billion this year up 8.3% year over year per the National Retail Federation, we suspect there will be plenty of costumes, candy, and other items for this “holiday” that are purchased online.

Now let’s review the 2017 holiday shopping forecasts that have been published thus far:

Deloitte: Deloitte expects retail holiday sales to rise as much as 4.5% between November and January of this year, vs. last year’s rise of 3.6%, to top $1 trillion. In line with our thinking, Deloitte sees e-commerce sales accelerating this year, growing 18%-21% this year compared to 14.3% last year, to account for 11% of 2017 retail holiday sales.

eMarketer is forecasting total 2017 holiday season spending of $923.15 billion, representing 18.4% of U.S. retail sales for the year, 0.1% decline from last year. Parsing the data from a different angle, that amounts to nearly 20% of all 2017 retail sales. Digging into this forecast, we find eMarketer is calling for US retail e-commerce sales to jump 16.6% during the 2017 holiday season, driven by increases in mobile commerce and the intensifying online battle between large retailers and digital marketplaces. By comparison, the firm sees total retail sales growing at a moderate 3.1%, as retailers continue to experience heavy discounting during the core holiday shopping months of November and December.

As we saw above, a differing perspective can lead to greater insight. In this case, eMarketer’s data puts e-commerce’s share of this year’s holiday spending at 11.5% with the two months of November and December accounting for nearly 24% of full-year e-commerce sales.

AlixPartners: Global business-advisory firm, AlixPartners, forecasts 2017 US retail sales during the November-through-January period to grow 3.5%-4.4% vs. 2016 holiday-season sales. Interestingly enough, the firm arrives at its forecast using some mathematical interpolation – over the past seven years, year-to-date sales through the back-to-school season have accounted for 66.1% to 66.4% of retail sales annually, with holiday sales accounting for 16.9% to 17.0%.

NetElixir: Based on nine years of aggregate data from mid-sized and large online retailers, NetElixir forecasts this year’s holiday e-commerce sales will see a 10% year-over-year growth rate. NetElixir also predicts Amazon’s share of holiday e-commerce sales will reach 34%, up from the 30% last year.

These are just some of the holiday shopping forecasts that we expect to get, including the barometer that most tend to focus on – the 2017 holiday shopping forecast from the National Retail Federation. What all of the above forecasts have in common is the acceleration of e-commerce sales and the pronounced impact that will have in the November-December/January period.

In looking at revenue forecasts for UPS’s December quarter, current consensus expectations call for a 5.8% year over year increase vs. $16.9 billion in the September quarter. We suspect this forecast could be conservative, and the same holds true for EPS expectations, which likely means there is upside to be had vs. the $6.01 per share in consensus expectations for 2017. Over the 2014-2016 period, UPS shares peaked during the holiday shopping season between 19.3-23.5x earnings, or an average P/E ratio of 21.3x. Applying that average multiple to potential 2017 EPS between $6.01-$6.15 derives a price target between $127-$131.

As consumers continue to shift disposable spending dollars to online and mobile platforms, we continue to see Amazon, as well as Alphabet (GOOGL), benefiting as consumers embrace this shift and Cash-Strapped Consumers look to stretch the spending dollars they do have this upcoming holiday shopping season.

  • We are boosting our price target on United Parcel Service (UPS) shares to $130 from $122, an additional 7.6% upside from current levels.
  • Our price target on Amazon (AMZN) shares remains $1,150.
  • Our price target on Alphabet (GOOGL) shares remains $1,050
Retail Sales Data for the Month of May Confirms Several Thematic Investment Themes

Retail Sales Data for the Month of May Confirms Several Thematic Investment Themes

This morning we received the May Retail Sales Report, which missed headline expectations (-0.3% month over month vs. the +0.1% consensus) as well as adjusted figures that exclude autos sales for the month (-0.3% month over month vs. +0.2% consensus). Despite the usual holiday promotional activity, retail sales in May were the weakest in 16 months due in part to lower gasoline prices, which had their biggest drop in over a year. In our view, the report confirms the challenging environment for brick & mortar retailers, despite those lower gas prices, while also affirms our decision not to participate in the space with the Tematica Select List as there were some bright spots below that headline miss.

Almost across the board, all retail categories were either essentially flat or down in May compared to April. The exception? Nonstore retail sales, clothing, and furniture — and nonstore obviously mostly comprised of online retailers since the Sears catalog isn’t in the mailbox too often these days. Comparing May 2017 retail sales to year-ago levels offers a different picture – nearly all categories were up with a couple of exceptions, the most notable being department stores. Again, more confirmation to the “why” behind recent news from mainstays of U.S. mall retailers like Macy’s (M), Michael Kors (KORS), Gymboree Corp. (GYMB) and Sears (SHLD).

Some interesting callouts from the report include that year over year, nonstore retail sales rose 10.2% percent, which brings the trailing 3-month year over year comparison for the category to 11.4%. This data simply confirms the continued shift toward digital commerce that is part of our Connected Society investing theme and is a big positive for our positions in Amazon (AMZN), Alphabet (GOOGL) and United Parcel Service (UPS).

We only see this shift to digital accelerating even more as we head into Back to School shopping season in the coming weeks and before too long the year-end holiday shopping season. While it is way early for a guesstimate on year-end holiday spending, eMarketer has published its view on Back to School spending this year and calls for it to grow 4 percent year over year to $857.2 billion. If that forecast holds, it will mean Back to School spending will account for roughly 17 percent of eMarketer’s 2017 retail sales forecast for all of 2017.

Not ones to be satiated with just the headlines, digging into the report we find more confirmation for our Connected Society investing theme – eMarketer sees e-commerce related Back to School shopping growing far faster, increasing 14.8% to $74.03 billion in 2017. As we like to say, perspective and context are essential, and in this case, should that e-commerce forecast hold it would mean Back to School e-commerce sales would account for 8.6% of total retail sales (online and offline) for the period, up from 7.8% last year.


The Connected Society Won’t Be the Only Theme In Play for Back to School Shopping

Given the last several monthly retail sales reports, as well as the increasing debt load carried by consumers, we strongly suspect our Cash-strapped Consumer theme will also be at play this Back to School shopping season, just like it was last year. In its 2016 findings, the National Retail Federation found that “48% of surveyed parents said they were influenced by coupons, up five percentage points from the prior year, while others said they planned to take advantage of in-store promotions and advertising inserts, and 53% said they would head to discount stores to finish prepping for the new school year.”

With consumer credit card debt topping $1 trillion, consumers are likely to once again use coupons, shop sales and hunt for deals, and that bodes very well for the shift to digital shopping. With Amazon increasingly becoming the go-to destination for accessories, books and video, computers and electronics, office equipment, sporting goods and increasingly apparel, we see it continuing to gain wallet share over the coming months.


Food with Integrity Theme Seen in Retail Sales Report As Well

Getting back to the May Retail Sales report, another positive was the 2.2% year on year increase in grocery stores compared to data published by the National Restaurant Association that paints a rather difficult environment for restaurant companies. The latest BlackBox snapshot report, which is based on weekly sales data from over 27,000 restaurant units, and 155 brands) found May was another disappointing month for chain restaurants across the board. Per the report, May same-store sales were down -1.1% and traffic dropped by 3.0% in May. With that in mind, we’d mention that last night Cheesecake Factory (CAKE) lowered its Q2 same restaurant comp guidance to down approximately -1%. This is a reduction from prior guidance of between 1% and 2%.

Stepping back and putting these datasets together, we continue to feel very good about our position in Food with Integrity company Amplify Snacks (BETR), as well as spice maker McCormicks & Co (MKS) as more people are eating at home, shopping either at grocery stores or online via Amazon Fresh and other grocery services. Paired with the shifting consumer preference for “better for you” snacks and food paves the way for Amplify as it broadens its product offering and expands its reach past the United States. As we shared in yesterday’s weekly update, United Natural Foods (UNFI) should also be enjoying this wave, but the company recently lowered its revenue guidance, so we’re putting UNFI under the microscope as we speak and we could very well be shifting our capital soon.


Washington’s Attack on Online Advertising Revenues Disguised as Tax Reform

Washington’s Attack on Online Advertising Revenues Disguised as Tax Reform

When we look at the creative destruction associated with our Connected Society investing theme, on the positive side we see new technologies transforming how people communicate, transact, shop and consume content. That change in how people consume TV, movies, music, books, and newspapers has led to a sea change in where companies are spending their advertising dollars given the consumer’s growing preference for mobile consumption on smartphones, tablets and even laptops over fixed location consumption in the home. This has spurred cord cutters and arguably is one of the reasons why AT&T (T) is looking to merge with Time Warner (TWX).

Data from eMarketer puts digital media advertising at $129.2 billion in 2021, up from $83 billion this year with big gains from over the air radio as well as TV advertising. As a result, eMarketer sees, “TV’s share of total spend will decline from 35.2% in 2017 to 30.8% by 2021.”

That shift in advertising dollars to digital and mobile platforms away from radio, print and increasingly TV has created a windfall for companies like Facebook (FB) and Alphabet (GOOGL) as companies re-allocate their advertising dollars. With our Connected Society investing theme expanding from smartphones and tablets into other markets like the Connected Car and Connected Home, odds are companies will look to advertising related business models to help keep service costs down. We’ve seen this already at Content is King contenders Pandora (P) as well as Spotify, both of which use advertising to allow free, but limited streaming music to listeners. Outside the digital lifestyle, other companies have embraced this practice such as movie theater companies like Regal Cinema Group (RGC) that use pre-movie advertising on the big screen to help defray costs.

As we point out, however, in Cocktail Investing, investors need to keep tabs on developments in Washington for they can potentially be disruptive to business models and that could lead to revisions to both revenue and earnings expectations. Case in point, current Ways and Means Committee Chairman Kevin Brady recently acknowledged that there “may be a need” to look at some of the revenue raisers to complete his 2017 tax reform proposal. One item was revisiting the idea to convert advertising from being a fully deductible business expense – as it has been for over a century – to just half deductible, with the rest being amortized over the course of a decade.

The sounds you just heard was jaws dropping at the thought that this might happen and what it could mean to revenue and earnings expectations for Facebook, Alphabet, Twitter (TWTR), Snap (SNAP), Disney (DIS), CBS (CBS), The New York Times (NYT) and all the other companies for which advertising is a key part of their business model.

Other jaws dropping were those had by economists remembering the 2014 IHS study that showed the country’s $297 billion in advertising spending generated $5.5 trillion in sales, or 16% of the nation’s total economic activity, and created 20 million jobs, roughly 14% of total US employment at the time. Those same economists are likely doing some quick math as to what the added headwind would be to an economy that grew less than 1 percent in 1Q 2017 and how it would impact future job creation should an advertising tax be initiated. It’s hard to imagine such an initiative going over well with a president that is looking to streamline and simplify the tax code, especially when one of his key campaign promises was to lower tax rates.

As we talked on the last several Cocktail Investing Podcasts, there are several headwinds that will restrain the speed of the domestic economy – the demographic shift and subsequent change in spending associated with our Aging of the Population investing theme and the wide skill set disparity noted in the monthly JOLTs report that bodes well for our Tooling & Retooling investment theme are just two examples. Our view is incremental taxes like those that could be placed on advertising would be a net contributor to the downside of our Economic Acceleration/Deceleration investing theme.

That’s how we see it, but investors in some of the high-flying stocks that have driven the Nasdaq Composite Index more than 17 percent higher year to date should ponder what this could mean to not only the market, but the shares of Facebook, Alphabet, and others. In our experience, one of the quickest ways to torpedo a stock price is big earnings revisions to the downside. With the S&P 500 trading at more than 18x expected 2017 earnings, a skittish market faced with a summer slowdown and pushed out presidential policies could be looking for an excuse to move lower and taking the wind out of this aspect of the technology sails could be it.

US Over the Top Video Users Approach Saturation Point

US Over the Top Video Users Approach Saturation Point

Streaming video continues to grow as does consumer spending on streaming video services. That trend has led Hulu to drop its free streaming service in favor of a subscription business model. Increasingly Hulu is looking more and more like Content is King company Netflix. How long until there is so much proprietary content that we’ll be thinking once again of Springsteen’s early 1990s song, “57 Channels and Nothin On”

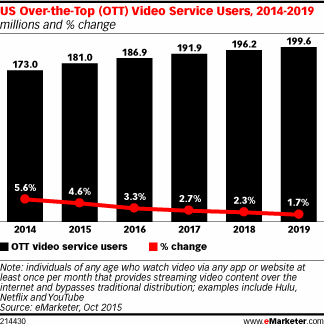
According to eMarketer’s first-ever forecast of over-the-top (OTT) video viewership, OTT video services are nearing saturation. This year, 186.9 million people in the US will watch video via an app or website that provides streaming content over the internet and bypasses traditional distribution.

Nearly nine in 10 digital view viewers in the US already watch video content this way.

Overall, more US TV viewers are watching television shows and movies via subscription-based streaming services. A survey from Hub Research found that the respondents who chose streaming services were nearly double those who picked TV network sites or apps, and they were more than double those who picked free aggregators, such as Crackle or free content from Hulu.

Source: Hulu Drops Free Streaming Service as OTT Viewership Grows – eMarketer