Weekly Issue: Economic reality is catching up with the stock market

Weekly Issue: Economic reality is catching up with the stock market


Coming into this week I said it would likely be another volatile one, and as much as I would like to say I was wrong, I wasn’t. Over the last five days, the individual price charts of the major stock market indices resembled a roller coaster ride, finishing lower week over week. This trajectory continued what we’ve seen over the last few weeks, which has all the major market indices in the red for the last month and that has erased most of their year to date gains.

Stepping back, yes, the market is trading day to day as expected but while there are pockets of strength we are seeing a growing number of companies miss top-line expectations. Coupled with guidance that in some cases may be conservative, but in other reflects a syncing up with the economic and other data of the last few months, investors have become increasingly nervous. This is evidenced in the wide swing over the last month at the CNN Fear & Greed Index, which now sits at Extreme Fear (6) down from Greed (65) several weeks ago. Looking at the AAII Investor Sentiment Survey this week, bullish sentiment fell to 28% from 34%, the fourth weakest reading for bullish sentiment this year. Bearish sentiment rose from 35% to 41%, the highest reading since the last week of June.

What this tells us is pessimism over the near-term direction of the stock market is at its highest level in months, which in turn is likely giving way to what we call a “shoot first and ask questions later” mentality. As almost any seasoned investor will say, that is one of the biggest mistakes one can make as it tends to let emotion, not logic and fact, rule the day.

What times like this call for is stepping back, collecting data shared in earnings releases and corresponding conference calls and presentations, to update our investing mosaic. We’ve had several Thematic Leaders and residents on the Tematica Investing Select List, including Chipotle Mexican Grill (CMG), Amazon (AMZN), Altria (MO),  Alphabet/Google, and Nokia (NOK) report this week as well as a dozens of others, such as AT&T (T), Verizon (VZ), Lockheed Martin (LMT), McDonald’s (MCD), iRobot (IRBT), and Hilton (HLT) report this week. That’s why I’ll be spending the weekend pouring over earnings releases and conference call transcripts, using our thematic lens to update our investing mosaic as needed. It also means furnishing you with a number of updates very early next week.

As I revisit our investing mosaic, the questions being asked will include ones like “Are we seeing any slowdown in the shift to digital commerce, the cloud, streaming content, the move to foods that are better for you?” and so on. Odds are the answers to those and similar questions will be no, which means we will continue to sit on the sidelines as earnings expectations for the market are adjusted likely leading the risk to reward dynamics in share prices to become more favorable. As calmer waters emerge in the coming weeks, we will use one of our time-tested strategies and scale into our Thematic Leader positions as well as those in the Select List where it makes sense.


What to Watch Next Week

As we trade the end of October and Halloween for the start of November next week, we have another barn burner one ahead for September quarter earnings as more than 1,000 companies will report their results and update their outlooks. We also have a full plate of economic data coming at us, some of which will influence the second edition of the September quarter’s GDP reading while others will start to put some shape around the GDP reading for the current quarter. To set the table for that data following the initial September quarter GDP print of 3.5%, the New York Fed’s Nowcast model is looking for 2.4% while The Wall Street Journal’s Economic Forecast Survey of more than 60 economists is calling for 2.9%. Thus far we have yet to see any forecast from the Atlanta Fed’s Nowcast model for the December quarter, however, odds are it will once again start out overly bullish and find its way closer to the economic reality of the quarter. We like to kid the Atlanta Fed, but it did start out modeling September quarter GDP of 4.7%. Of course, we would have loved to have seen that, but we’re in the business of letting the economic data talk to us. The fact the Citibank Economic Surprise Index (CESI) has been negative for several months, meaning the data is coming in below expectations, was a clue the Atlanta Fed would have to refine its outlook.

So, what do we have on tap from an economic data perspective?

Monday will bring the September Personal Income and Spending report, one that will we will be watching closely to see if consumers continued to spend above wage gains. Tuesday has the October Consumer Confidence reading for October, and the recent stock market gyrations could take some wind out of the September confidence gains. As we gear into the holiday shopping season, we’ll be closely watching the Expectations component for signs of any softening. Also, on Tuesday, we have Apple’s (AAPL) latest event at which it is widely expected to unveil its latest iPad and Mac models. The ADP Employment Report for October, as well as the 3Q 2018 Employment Cost Index report, will be had on Wednesday, and we expect them to receive more than a passing scrutiny given the growing scarcity of workers with needed skillsets and wage gains.

Thursday we will get the October auto and truck sales and we’ll be looking to see if those sales continue to resemble what we’ve seen in the housing market of late – fewer unit sales, but ones with higher price tags. Also, in focus, that day will be the October ISM Manufacturing Index, where we will be eyeing its order and backlog data as well as employment metrics. Rounding out Thursday, we’ll get the September Construction Spending Report. The first Friday of the new month usually means it’s time for the employment report, and yes, we will indeed be getting the October Employment report one week from today. While we expect many to be focused on the speed of job creation, we’ll be digging into the qualitative factors of the jobs created and who is taking them as well as focusing on the degree of wage gains.

Turning to next week’s earnings calendar, it is simply chock full of reports and once again Thursday will be the day with the heaviest flow – just under 400 companies on that day alone.  Just like this week, among the sea of reports to be had, there will be several, including Facebook (FB) and Apple that will capture investor attention given the impact they could have on the market. As we move through the week, we’ll be adding to our investment mosaic along the way.

Enjoy the weekend, stock up on all those tricks and treats and get some rest for the week ahead. I’ll be back with more early next week.

 

WEEKLY ISSUE: Confirming Data Points for Apple and Universal Display

WEEKLY ISSUE: Confirming Data Points for Apple and Universal Display

Key points inside this issue:

  • The Business Roundtable and recent data suggest trade worries are growing.
  • Our price target on Costco Wholesale (COST) shares remains $250.
  • Our price target on Apple (AAPL) and Universal Display (OLED) shares remain $225 and $150, respectively.
  • Changes afoot at S&P, but they still lag our thematic investing approach


While investors and the stock market have largely shaken off concerns of a trade war thus far, this week the stakes moved higher. The U.S. initiated the second leg of its tariffs on China, slapping on $200 billion of tariffs on Chinese imports of food ingredients, auto parts, art, chemicals, paper products, apparel, refrigerators, air conditioners, toys, furniture, handbags, and electronics.

China responded, not only by canceling expected trade talks, but by also implementing tariffs of its own to the tune of $60 billion on U.S. exports to China. Those tariffs include medium-sized aircraft, metals, tires, golf clubs, crude oil and liquified natural gas (LNG). Factoring in those latest steps, there are tariffs on nearly half of all U.S. imports from China and over 50% of U.S. export to China.

Should President Trump take the next stated step and put tariffs on an additional $267 billion of products, it would basically cover all U.S. imports from China. In terms of timing, let’s remember that we have the U.S. mid-term elections coming up before too long — and one risk we see here at Tematica is China holding off trade talks until after those elections.

On Monday, the latest Business Roundtable survey found that two-thirds of chief executives believed recent tariffs and future trade tension would have a negative impact on their capital investment decisions over the next six months. Roughly one-third expected no impact on their business, while only 2% forecast a positive effect.

That news echoed the recent September Flash U.S. PMI reading from IHS Markit, which included the following commentary:

“The escalation of trade wars, and the accompanying rise in prices, contributed to a darkening of the outlook, with business expectations for the year ahead dropping sharply during the month. While business activity may rebound after the storms, the drop in optimism suggests the longer term outlook has deteriorated, at least in the sense that growth may have peaked.”

Also found in the IHS Markit report:

“Manufacturers widely noted that trade tariffs had led to higher prices for metals and encouraged the forward purchasing of materials… Future expectations meanwhile fell to the lowest so far in 2018, and the second-lowest in over two years, as optimism deteriorated in both the manufacturing and service sectors.”

As if those growing worries weren’t enough, there has been a continued rise in oil prices as OPEC ruled out any immediate increase in production, the latest round of political intrigue inside the Washington Beltway, the growing spending struggle for the coming Italian government budget and Brexit.

Any of these on their own could lead to a reversal in the CNN Money Fear & Greed Index, which has been hanging out in “Greed” territory for the better part of the last month. Taken together, though, it could lead companies to be conservative in terms of guidance in the soon-to-arrive September quarter earnings season, despite the benefits of tax reform on their businesses and on consumer wallets. In other words, these mounting headwinds could weigh on stocks and lead investors to question growth expectations for the fourth quarter.

What’s more, even though S&P 500 EPS expectations still call for 22% EPS growth in 2018 vs. 2017, we’ve started to see some downward revisions in projections for the September and December quarters, which have softened 2018 EPS estimates to $162.01, down from $162.60 several weeks ago. Not a huge drop, but when looking at the current stock market valuation of 18x expected 2018 EPS, remember those expectations hinge on the S&P 500 group of companies growing their EPS more than 21% year over year in the second half of 2018.


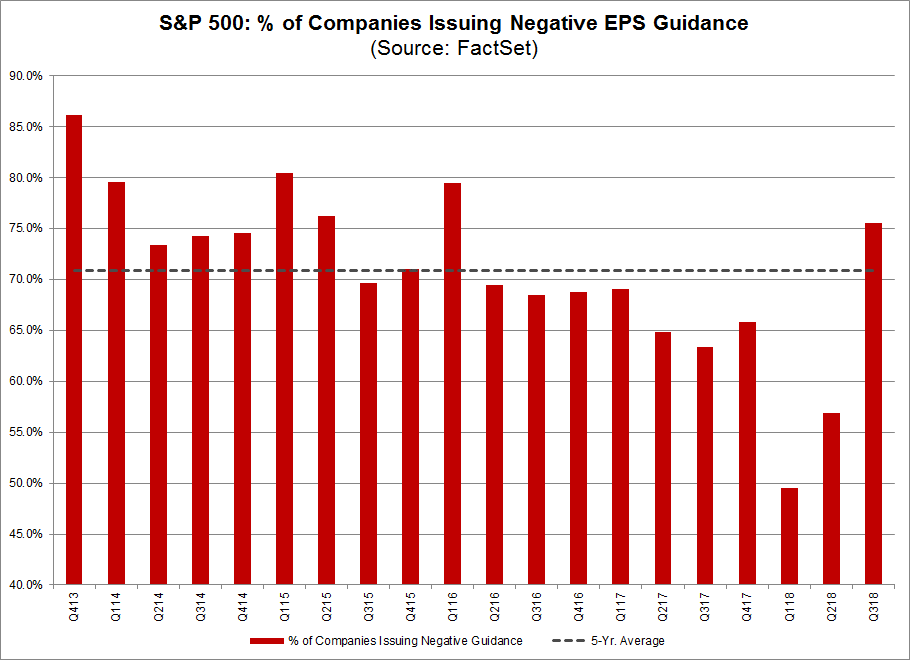
Any and all of the above factors could weigh on corporate guidance or just rattle investor’s nerves and likely means a bumpy ride over the ensuing weeks as trade and political headlines heat up. As it stands right now, according to data tabulated from FactSet, heading into September quarter earnings, 74 of 98 companies in the S&P 500 that issued guidance, issued negative guidance marking the highest percentage (76%) since 1Q 2016 and compares to the five year average of 71%.

Not alarmingly high, but still higher than the norm, which means I’ll be paying even closer than usual attention to what is said over the coming weeks ahead of the “official” start to September quarter earnings that is Alcoa’s (AA) results on Oct. 17 and what it means for both the Thematic Leaders and the other positions on the Select List.


Today is Fed Day

This afternoon the Fed’s FOMC will break from its September meeting, and it is widely expected to boost interest rates. No surprise there, but given what we’ve seen on the trade front and in hard economic data of late, my attention will be on what is said during the post-meeting press conference and what’s contained in the Fed’s updated economic forecast. The big risk I see in the coming months on the Fed front is should the escalating tariff situation lead to a pick-up in inflation, the Fed could feel it is behind the interest rate hike curve leading to not only a more hawkish tone but a quicker pace of rate hikes than is currently expected.

We here at Tematica have talked quite a bit over consumer debt levels and the recent climb in both oil and gas prices is likely putting some extra squeeze on consumers, especially those that fall into our Middle-Class Squeeze investing theme. Any pick up in Fed rate hikes means higher interest costs for consumers, taking a bigger bite out of disposable income, which means a step up in their effort to stretch spending dollars. Despite its recent sell-off, I continue to see Costco Wholesale (COST) as extremely well positioned to grab more share of those cash-strapped wallets, particularly as it continues to open new warehouse locations.

  • Our price target on Costco Wholesale (COST) shares remains $250.


Favorable Apple and Universal Display News

Outside of those positions, we’d note some favorable news for our Apple (AAPL) shares in the last 24 hours. First, the iPhone XS Max OLED display has reclaimed the “Best Smartphone Display” crown for Apple, which in our view augurs well for other smartphone vendors adopting the technology. This is also a good thing for our Universal Display (OLED) shares as organic light emitting diode displays are present in two-thirds of the new iPhone offerings. In addition to Apple and other smartphone vendors adopting the technology, we are also seeing more TV models adoption it as well. We are also starting to see ultra high-end cars include the technology, which means we are at the beginning of a long adoption road into the automotive lighting market. We see this confirming Universal’s view that demand for the technology and its chemicals bottomed during the June quarter. As a reminder, that view includes 2018 revenue guidance of $280 million-$310 million vs. the $99.7 million recorded in the first half of the year.

Second, Apple has partnered with Salesforce (CRM) as part of the latest step in Apple’s move to leverage the iPhone and iPad in the enterprise market. Other partners for this strategy include IBM (IBM), Cisco Systems (CSCO), Accenture (ACN) CDW Corp. (CDW) and Deloitte. I see this as Apple continuing to chip away at the enterprise market, one that it historically has had limited exposure.

  • Our price target on Apple (AAPL) and Universal Display (OLED) shares remain $225 and $150, respectively.


Changes afoot at S&P, but they still lag our thematic investing approach

Before we close out this week’s issue, I wanted to address something big that is happening in markets that I suspect most individuals have not focused on. This week, S&P will roll out the largest revision to its Global Industry Classification Standard (GICS) since 1999. Before we dismiss it as yet another piece of Wall Street lingo, it’s important to know that GICS is widely used by portfolio managers and investors to classify companies across 11 sectors. With the inclusion of a new category – Communication Services – it means big changes that can alter an investor’s holdings in a mutual fund or ETF that tracks one of several indices. That shifting of trillions of dollars makes it a pretty big deal on a number of fronts, but it also confirms the shortcomings associated with sector-based investing that we here at Tematica have been calling out for quite some time.

The new GICS category, Communications Services, will replace the Telecom Sector category and include companies that are seen as providing platforms for communication. It will also include companies in the Consumer Discretionary Sector that have been classified in the Media and Internet & Direct Marketing Retail subindustries and some companies from the Information Technology sector. According to S&P, 16 Consumer Discretionary stocks (22% of the sector) will be reclassified as Communications Services as will 7 Information Technology stocks (20% of that sector) as will AT&T (T), Verizon (VZ) and CenturyLink (CTL). Other companies that are folded in include Apple (AAPL), Google (GOOGL), Disney (DIS), Twitter (TWTR), Snap (SNAP), Netflix (NFLX), Comcast (CMCSA), and DISH Network (DISH) among others.

After these maneuverings are complete, it’s estimated Communication services will be the largest category in the S&P 500 at around 10% of the index leaving weightings for the other 11 sectors in a very different place compared to their history. In other words, some 50 companies are moving into this category and out of others. That will have meaningful implications for mutual funds and ETFs that track these various index components and could lead to some extra volatility as investors and management companies make their adjustments. For example, the Technology Select Sector SPDR ETF (XLK), which tracks the S&P Technology Select Sector Index, contained 10 companies among its 74 holdings that are being rechristened as part of Communications Services. It so happens that XLK is one of the two largest sector funds by assets under management – the other one is the Consumer Discretionary Select Sector SPDR Fund (XLY), which had exposure to 16 companies that are moving into Communications Services.

So what are these moves really trying to accomplish?

The simple answer is they taking an out-of-date classification system of 11 sectors – and are attempting to make them more relevant to changes and developments that have occurred over the last 20 years. For example:

  • Was Apple a smartphone company 20 years ago? No.
  • Did Netflix exist 20 years ago? No.
  • Did Amazon have Amazon Prime Video let alone Amazon Prime 20 year ago? No.
  • Was Facebook around back then? Nope. Should it have been in Consumer Discretionary, to begin with alongside McDonald’s (MCD) and Ralph Lauren (RL)? Certainly not.
  • Did Verizon even consider owning Yahoo or AOL in 1999? Probably not.


What we’ve seen with these companies and others has been a morphing of their business models as the various economic, technological, psychographic, demographic and other landscapes around them have changed. It’s what they should be doing, and is the basis for our thematic investment approach — the strong companies will adapt to these evolving tailwinds, while others will sadly fall by the wayside.

These changes, however, expose the shortcomings of sector-based investing. Simply viewing the market through a sector lens fails to capture the real world tailwinds and catalysts that are driving structural changes inside industries, forcing companies to adapt. That’s far better captured in thematic investing, which focuses on those changing landscapes and the tailwinds as well as headwinds that arise and are driving not just sales but operating profit inside of companies.

For example, under the new schema, Microsoft (MSFT) will be in the Communications Services category, but the vast majority of its sales and profits are derived from Office. While Disney owns ESPN and is embarking on its own streaming services, both are far from generating the lion’s share of sales and profits. This likely means their movement into Communications Services is cosmetic in nature and could be premature. This echoes recent concern over the recent changes in the S&P 500 and S&P 100 indices, which have been criticized as S&P trying to make them more relevant than actually reflecting their stated investment strategy. For the S&P 500 that is being a market-capitalization-weighted index of the 500 largest U.S. publicly traded companies by market value.

As much as we could find fault with the changes, we can’t help it if those institutions, at their core, stick to their outdated thinking. As I have said before about other companies, change is difficult and takes time. And to be fair, for what they do, S&P is good at it, which is why we use them to calculate the NJCU New Jersey 50 Index as part of my work New Jersey City University.

Is this reclassification to update GICS and corresponding indices a step in the right direction?

It is, but it is more like a half step or even a quarter step. There is far more work to be done to make GICS as relevant as it needs to be, not just in today’s world, but the one we are moving into. For that, I’ll continue to stick with our thematic lens-based approach.


Recasting Our Rise and Fall of the Middle Class and Cash-Strapped Consumer Themes

Recasting Our Rise and Fall of the Middle Class and Cash-Strapped Consumer Themes


KEY POINTS FROM THIS POST

  • As we recast our Rise & Fall of the Middle Class into two themes – the New Middle Class and the Middle-Class Squeeze, which also folds in our Cash-Strapped Consumer theme, we are calling out Costco Wholesale (COST) shares as a top Middle-Class Squeeze pick, reiterating our Buy rating on the shares, and bumping our price target from $210 to $220.

At the end of yesterday’s Tematica Investing issue, I mentioned how at Tematica we are in the process of reviewing the investing themes that we have in place to make sure they are still relevant and relatable. As part of that exercise and when appropriate, we’ll also rename a theme.  Our goal through this process is to streamline and simplify the full list of 17 themes.

Of course, first up is our Rise & Fall of the Middle-Class theme that we are splitting into two different themes — which I know doesn’t sound like an overall simplification, but trust me, it will make sense. As the current name suggests, there are two aspects of this theme — the “Rise” and the “Fall” part. It can be confusing to some, so we’re splitting it into two themes. The “Rise” portion will be “The New Global Middle Class” and will reflect the rapidly expanding middle-class markets particularly in Asia and South America. On the other hand, the “Fall” portion will be recast as “The Middle Class Squeeze” to reflect the shrinking middle class in the United States and the realities that it poses to our consumer-driven economy.

As we make that split, it’s not lost on us here at Tematica that there is bound to be some overlap between The Middle-Class Squeeze and our Cash-Strapped Consumer investing theme given that one of the more powerful drivers of both is disposable income pressure and a loss of purchasing power. As such, as we cleave apart The Middle-Class Squeeze we’re also incorporating Cash-Strapped Consumer into it. It’s repositionings like this that we’ll be making over coming weeks, and while I hate to spoil a surprise as we say good bye to one or two themes, we’ll be saying hello to new one or two as well.


Why America’s Middle Class are Feeling the Squeeze

As both I and Tematica’s Chief Macro Strategist, Lenore Hawkins, have been sharing in our writings as well as our collective media hits, we’re seeing increasing signs of inflation in the systems from both hard and soft data points and that recently prompted the Fed to boost its interest rate forecast to four hikes this year, up from three with additional rate hikes in 2019. That’s what’s in the front windshield of the investing car, while inside we are getting more data that points to an increasingly stretched consumer that is seeing his or her disposable income under pressure.

According to LendingTree’s May 2018 Consumer Debt Outlook, Americans owe more than 26% percent of their disposable personal income on consumer debt, up from 22% in 2010. And just so we are clear, LendingTree is defining consumer debt to include non-mortgage debts such as credit cards, personal loans, auto loans, and student loans. These outstanding balances of consumer credit, per LendingTree, have been growing at a steady rate of 5% to 6% annually over the last two years, and this has it to forecast total consumer debt to exceed $4 trillion by the end of 2018.

Part of the reason consumers have been turning to debt is the lack of wage growth. Even as tax reform related expectations have been running high for putting more money in consumer pockets data from the Bureau of Labor Statistics revealed compensation for civilian workers rose 2.4% year over year in the March quarter. By comparison, gas prices have risen more than 24% over the last 12 months, and the average home price in the US was up more than 11% in April 2018 vs. April 2017. So, while wages have moved up that move has paled in comparison to other costs faced by consumers.

Then there’s the data from Charles Schwab’s (SCHW) 2018 Modern Wealth Index that finds three in five Americans are living paycheck to paycheck. According to other data, consumers more than three months behind on their bills or considered otherwise in distress were behind on nearly $12 billion in credit card debt as of the beginning of the year — an 11.5 percent increase during Q4 alone.

And it’s not just the credit card debt — mortgage problem debt is up as well, 5.2% to $56.7 billion.

As that debt grows, it’s going to become even more expensive to service. On its recent quarterly earnings conference call, Lending Club’s (LC) CFO Tom Casey shared that “Borrowers are starting to see the increased cost of credit as most credit card debt is indexed to prime, which has moved up 75 basis points from a year ago…We have observed a number of lenders increase rates to borrowers…We know that consumers are feeling the increase in rates.”

And that’s before the Fed rate hikes that are to come.

The bottom line is it likely means more debt and higher interest payments that lead to less disposable income for consumers to spend.


More US consumers getting squeezed

All of this points to an already stretched consumer base that has increasingly turned to debt given that real wage growth has been tepid at best over the past decade. And this doesn’t even touch on the degree to which the American consumer is under-saved or has little in the way of an emergency fund to cover those unforeseen expenses. Per Northwestern Mutual’s 2018 Planning & Progress Study, which surveyed 2,003 adults:

  • 78% of Americans say they’re ‘extremely’ or ‘somewhat’ concerned about not having enough money for retirement. Another 66 percent believe that they’ll outlive their retirement savings.
  • 21% of Americans have nothing at all saved for the future, and another 10 percent have less than $5,000 saved or invested for their golden years.

Adding credence to this figures, Bankrate’s latest financial security index survey, showed that 34% of American households experienced a major unexpected expense over the past year. But, only 39% of survey respondents said they would be able to cover a $1,000 setback using their savings. Other findings from Bankrate, based on data from the Federal Reserve, showed that those Americans between the ages of 55 and 64 that have retirement savings only have a median of $120,000 socked away. A similar 2016 GOBankingRates survey found that 69 percent of Americans had less than $1,000 in total savings and 34 percent had no savings at all.

Nearly 51 million households don’t earn enough to afford a monthly budget that includes housing, food, childcare, healthcare, transportation and a cell phone, according to a study by the United Way ALICE Project. That’s 43% of households in the United States.

As the New Middle Class in the emerging economies like China, India and parts of South America continue to expand, it will drive competitive world-wide pressures for food, water, energy and other scarce resources that will drive prices higher given prospects for global supply-demand imbalances.


Middle-Class Squeeze pain brings opportunity with Costco and others

What this tells us is that there is a meaningful population of Americans that are in debt and are not prepared for their financial future. In our experience, pain points make for good investment opportunities. In the case of the Middle-Class Squeeze investment theme, it means consumers trading down when and where possible or looking to stretch the disposable dollars they do have.

It’s no coincidence that we’re seeing a growing move toward private label brands, not only at the grocery store for packaged foods and beverages but by the likes of Amazon (AMZN) as well. We’re also seeing casual dining and fine dining restaurant categories give way to fast casual, and as one might expect the data continues to show more Americans eating at home than eating out.

From my perspective, the best-positioned company for the Middle-Class Squeeze investing theme is Costco Wholesale (COST). By its very nature, the company’s warehouse business model aims to give consumers more for their dollar as Costco continues to improve and expand its offering both in-store and online. To me, one of the smartest moves the company made was focusing not only on perishable food but on organic and natural products as well. That combination keeps customers coming back on a more frequent basis.

Let’s remember too, the secret sauce baked into Costco’s business model – membership fees, which are high-margin in nature, and are responsible for a significant portion of the company’s income. As I’ve shared before, that is a key differentiator compared to other brick & mortar retailers. And Costco looks to further expand that footprint as it opens some 17 more warehouse locations in the coming months.

I’ll continue to monitor Costco’s monthly sales reports, which have clearly shown it taking consumer wallet share, and juxtaposing them against the monthly Retail Sales report to confirm those wallet share gains.

  • As we recast our Rise & Fall of the Middle Class into two themes – the New Middle Class and the Middle-Class Squeeze, we are calling out Costco Wholesale (COST) shares as a top Middle-Class Squeeze pick, reiterating our Buy rating on the shares, and bumping our price target from $210 to $220.


Examples of companies riding the Middle-Class Squeeze Tailwind

  • Walmart (WMT)
  • Amazon (AMZN)
  • McDonald’s (MCD)
  • Dollar Tree (DLTR)
  • TJX Companies (TJX)
  • Ross Stores (ROST)
  • Kohl’s (KSS)

Examples of companies facing the Middle-Class Squeeze Headwind

  • Dillard’s (DDS)
  • JC Penney (JCP)
  • Macy’s (M)
  • Target (TGT)
  • Gap (GPS)
  • Red Robin (RRGB)

Again, those are short lists of EXAMPLES, not a full list of the companies benefitting or getting hit.

Over the next several weeks, I’ll be revisiting our investment themes, both the ones being tweaked as well as the ones, like Safety & Security, that are fine as is.

WEEKLY ISSUE: Trade and Tariffs, the Words of the Week

WEEKLY ISSUE: Trade and Tariffs, the Words of the Week


KEY POINTS FROM THIS WEEK’S ISSUE:

  • We are issuing a Sell on the shares of MGM Resorts (MGM) and removing them from the Tematica Investing Select List.
  • While the markets are reacting mainly in a “shoot first and ask questions later” nature, given the widening nature of the recent tariffs there are several safe havens that patient investors must consider.
  • We are recasting several of our Investment Themes to better reflect the changing winds.


Investor Reaction to All the Tariff Talk

Over the last two days, the domestic stock market has sold off some 16.7 points for the S&P 500, roughly 0.6%. That’s far less than the talking heads would suggest as they focus on the Dow Jones Industrial Average that has fallen more than 390 points since Friday’s close, roughly 1.6%. Those moves pushed the Dow into negative territory for 2018 and dragged the returns for the other major market indices lower. Those retreats in the major market indices are due to escalating tariff announcements, which are raising uncertainty in the markets and prompting investors to shoot first and ask questions later. We’ve seen this before, but we grant you the causing agent behind it this time is rather different.

What makes the current environment more challenging is not only the escalating and widening nature of the tariffs on more countries than just China, but also the impact they will have on supply chain part of the equation. So, the “pain” will be felt not just on the end product, but rather where a company sources its parts and components. That means the implications are wider spread than “just” steel and aluminum. One example is NXP Semiconductor (NXPI), whose chips are used in a variety of smartphone and other applications – the shares are down some 3.7% over the last two days.

With trade and tariffs being the words of the day, if not the week, we have seen investors bid up small-cap stocks, especially ones that are domestically focused. While the other major domestic stock market indices have fallen over the last few days, as we noted above, the small-cap, domestic-heavy Russell 2000 is actually up since last Friday’s close, rising roughly 8.5 points or 0.5% as of last night’s market close. Tracing that index back, as trade and tariff talk has grown over the last several weeks, it’s quietly become the best performing market index.


A Run-Down of the Select List Amid These Changing Trade Winds

On the Tematica Investing Select List, we have more than a few companies whose business models are heavily focused on the domestic market and should see some benefit from the added tailwinds the international trade and tariff talk is providing. These include:

  • Costco Wholesale (COST)
  • Dycom Industries (DY)
  • Habit Restaurants (HABT)
  • Farmland Partners (FPI)
  • LSI Industries (LYTS)
  • Paccar (PCAR)
  • United Parcel Services (UPS)

We’ve also seen our shares of McCormick & Co. (MKC) rise as the tariff back-and-forth has picked up. We attribute this to the inelastic nature of the McCormick’s products — people need to eat no matter what — and the company’s rising dividend policy, which helps make it a safe-haven port in a storm.

Based on the latest global economic data, it once again appears that the US is becoming the best market in the market. Based on the findings of the May NFIB Small Business Optimism Index, that looks to continue. Per the NFIB, that index increased in May to the second highest level in the NFIB survey’s 45-year history. Inside the report, the percentage of business owners reporting capital outlays rose to 62%, with 47% spending on new equipment, 24% acquiring vehicles, and 16% improving expanded facilities. Moreover, 30% plan capital outlays in the next few months, which also bodes well for our Rockwell Automation (ROK) shares.

Last night’s May reading for the American Trucking Association’s Truck Tonnage Index also supports this view. That May reading increased slightly from the previous month, but on a year over year basis, it was up 7.8%. A more robust figure for North American freight volumes was had with the May data for the Cass Freight Index, which reported an 11.9% year over year increase in shipments for the month. Given the report’s comment that “demand is exceeding capacity in most modes of transportation,” I’ll continue to keep shares of heavy and medium duty truck manufacturer Paccar (PCAR) on the select list.

The ones to watch

With all of that said, we do have several positions that we are closely monitoring amid the escalating trade and tariff landscape, including

  • Apple (AAPL),
  • Applied Materials (AMAT)
  • AXT Inc. (AXTI)
  • MGM Resorts (MGM)
  • Nokia (NOK)
  • Universal Display (OLED)

With Apple we have the growing services business and the eventual 5G upgrade cycle as well as the company’s capital return program that will help buoy the shares in the near-term. Reports that it will be spared from the tariffs are also helping. With Applied, China is looking to grow its in-country semi-cap capacity, which means semi- cap companies could see their businesses as a bargaining chip in the short-term. Longer- term, if China wants to grow that capacity it means an eventual pick up in business is likely in the cards. Other drivers such as 5G, Internet of Things, AR, VR, and more will spur incremental demand for chips as well. It’s pretty much a timing issue in our minds, and Applied’s increased dividend and buyback program will help shield the shares from the worst of it.

Both AXT and Nokia serve US-based companies, but also foreign ones, including ones in China given the global nature of smartphone component building blocks as well as mobile infrastructure equipment. Over the last few weeks, the case for 5G continues to strengthen, but if these tariffs go into effect and last, they could lead to a short-term disruption in their business models. Last week, Nokia announced a multi-year business services deal with Wipro (WIT) and alongside Nokia, Verizon (VZ) announced several 5G milestones with Verizon remaining committed to launching residential 5G in four markets during the back half of 2018. That follows the prior week’s news of a successful 5G test for Nokia with T-Mobile USA (TMUS) that paves the way for the commercial deployment of that network.

In those cases, I’ll continue to monitor the trade and tariff developments, and take action when are where necessary.


Pulling the plug on MGM shares

With MGM, however, I’m concerned about the potential impact to be had not only in Macau but also on China tourism to the US, which could hamper activity on the Las Vegas strip. While we’re down modestly in this Guilty Pleasure company, as the saying goes, better safe than sorry and that has us cutting MGM shares from the Select List.

  • We are issuing a Sell on the shares of MGM Resorts (MGM) and removing them from the Tematica Investing Select List


Sticking with the thematic program

On a somewhat positive note, as the market pulls back we will likely see well-positioned companies at better prices. Yes, we’ll have to navigate the tariffs and understand if and how a company may be impacted, but to us, it’s all part of identifying the right companies, with the right drivers at the right prices for the medium to long-term. That’s served us well thus far, and we’ll continue to follow the guiding light, our North Star, that is our thematic lens. It’s that lens that has led to returns like the following in the active Tematica Investing Select List.

  • Alphabet (GOOGL): 60%
  • Amazon (AMZN): 133%
  • Costco Wholesale (COST) : 30%
  • ETFMG Prime Cyber Security ETF (HACK): 34%
  • USA Technologies (USAT): 62%

Over the last several weeks, we’ve added several new positions – Farmland Partners (FPI), Dycom Industries (DY), Habit Restaurant (HABT) and AXT Inc. (AXTI) to the active select list as well as Universal Display (OLED) shares. As of last night’s, market close the first three are up nicely, but our OLED shares are once again under pressure amid rumor and speculation over the mix of upcoming iPhone models that will use organic light emitting diode displays. When I added the shares back to the Select List, it hinged not on the 2018 models but the ones for 2019. Let’s be patient and prepare to use incremental weakness to our long-term advantage.


Recasting Several of our investment themes

Inside Tematica, not only are we constantly examining data points as they relate to our investment themes we are also reviewing the investing themes that we have in place to make sure they are still relevant and relatable. As part of that exercise and when appropriate, we’ll also rename a theme.

Over the next several weeks, I’ll be sharing these repositions and renamings with you, and then providing a cheat sheet that will sum up all the changes. As I run through these I’ll also be calling out the best-positioned company as well as supplying some examples of the ones benefitting from the theme’s tailwinds and ones marching headlong into the headwinds.

First up, will be a recasting of our Rise & Fall of the Middle-Class theme.  As the current name suggests, there are two aspects of this theme — the “Rise” and the “Fall” part. It can be confusing to some, so we’re splitting it into two themes.  The “Rise” portion will be “The New Global Middle Class” and will reflect the rapidly expanding middle class markets particularly in Asia and South America. On the other hand, the “Fall” portion will be recast as “The Middle Class Squeeze” to reflect the shrinking middle class in the United States and the realities that poses to our consumer-driven economy.

We’ll have a detailed report to you in the coming days on the recasting of these two themes, how it impacts the current Select List as well as other companies we see as well-positioned given the tailwinds of each theme.


WEEKLY ISSUE: A Guilty Pleasure or a Habit? In this case it’s the same

WEEKLY ISSUE: A Guilty Pleasure or a Habit? In this case it’s the same


KEY POINTS FROM THIS ALERT:

  • We are adding shares of Habit Restaurant (HABT) to the Tematica Investing Select List as part of our Guilty Pleasure investing theme with an $11.50 price target.
  • We are boosting our price target on USA Technologies (USAT) shares to $12 from $11 following robust margin performance in the March quarter and strong prospects for more realized synergies with its Cantaloupe acquisition and new Ingenico relationship.
  • After reporting March quarter earnings that saw its net asset value per share continue to climb, we continue to rate GSV Capital (GSVC) shares a Buy with an $11 price target.


After formally adding shares of Disruptive Technology company AXT Inc. (AXTI) back to the Tematica Investing fold earlier this week, we’ve got a jam-packed issue this week that includes a new recommendation that brings an active position in our Guilty Pleasure investing theme onto the Tematica Investing Select List. Let’s get to it…

Adding Habit Restaurant shares to the Tematica Investing Select List

People need to eat. That’s a pretty recognizable fact. Some may eat more than others, some may eat less; some may eat meat, others may not. But at the end of the day, we need food.

As investors, we recognize this and that means considering where and what consumers eat, and also identifying companies that are poised to benefit from other opportunities. One such opportunity is geographic expansion, and with restaurants it often means expanding across the United States.

Typically, expansion is driven by new store openings, which in turn drive sales. Tracing back its expansion over the last several years, Chipotle Mexican Grill (CMG) had to build up to 2,363 locations. Even with that number of locations, per Chipotle’s recently filed 10-K, the company still expects to “open between 130 and 150 new restaurants in 2018.” At that pace, it would take quite a while before Chipotle has as many locations as McDonald’s (MCD) (more than 14,000) or Starbucks (SBUX) (just under 14,000) in the U.S. exiting last year.

A little over a year ago, Restaurant Brands (QSR), the company behind Tim Hortons and Burger King, acquired Popeye’s in part for food-related synergies but also the opportunity to grow Popeye’s through geographic expansion. In 2016, Popeye’s had some 2,600 locations compared to more than 7,500 Burger Kings in the U.S. For those wondering, that’s greater than the 2,251 locations Jack in the Box (JACK) had in 2017.

And that brings us to a quick service with a California char-grill twist restaurant that is Habit Restaurant (HABT). With just 209 Habit Burger Grill fast casual locations in 11 states spread between the two coasts, Habit has ample room to expand its concept serving flame char-grilled burgers and sandwiches, fries, salads and shakes. And if you’re wondering how good Habit is, I took the liberty of trying its products and sampling its friendly service at one of the few East coast locations — it’s work, someone had to do it. I can certainly understand why this Guilty Pleasure company was named “best tasting burger in America” in July 2014.

In 2017, the company recorded revenue of $331.7 million from which it generated EPS of $0.16. For this year, consensus expectations have it serving up revenue near $393 million, up around 18% year over year, but EPS of $0.05 — a sharp drop from 2017.

What we’re seeing is Habit hitting an inflection point as it engages a national advertising agency, opens 30 new locations this year and contends with higher wage costs (up 6%-7% vs. 2017), as well as test markets breakfast. Inflection point stocks can be tricky largely because even as things go right there can be mishaps along the way. With the company expected to open the greatest number of new locations during the March quarter, I put the shares on the back burner in early March when they were near $10 with a note to follow up after the company reported the March quarter.

Last week, Habit issued its quarterly results with year over year revenue growth near 17%, but still out of reach compared to consensus expectations, and it also missed on the bottom line. Following that report, HABT shares fell x%, bottoming our near $8.20 before settling at $8.60.

What led to the shortfall?

During the March quarter, Habit opened 11 new company-owned locations – more than the expected 7-10 for the quarter — more than one-third of its targeted new openings for 2018. Another factor was rising costs in the form of inputs (beef and chicken in the protein complex and French fries) as well as higher labor costs, particularly in California, during its peak promotional activity.

Now for the positive developments. First, to offset those higher costs the company is implementing a 3.9% menu price hike at the end of May. Second, its expansion plans – with another 20 or so company restaurants this year and 6-8 franchised locations  —remain on track with but at a slower open rate compared to the March quarter.

This expansion should help improve the company’s geographic footprint further as it follows the three new east coast locations openings (Maryland, New Jersey) opened during the March quarter. During the earnings call, the company shared that roughly 20% of its company-operated growth will be on the east coast and about 50% will be drive through locations. On another note, the company is testing a breakfast menu, which in our view is a long-term positive given that per NPD Group findings, breakfast is the fastest growing meal with 80% of that growing being had a quick service restaurants.

Now here’s the thing – no matter what metric you look at for the shares OTHER than P/E they are cheap.  The shares are currently trading at 8.0x on an enterprise value to 2018 earnings before interest, taxes, depreciation and amortization (EBITDA) basis, which is more than 40% discount to the peer group that includes Jack in the Box (JACK), Wendy’s (WEN) and other quick-service restaurants. Some of that discount is warranted as Habit has to wind its way through some likely growing pains, but as I shared above the longer-term driver of the company’s success will be geographic expansion. It bears repeating — we’ve seen this time and time again with restaurant companies ranging from Dunkin’ Donuts to Starbucks (SBUX), Chipotle (CMG) back in the day and Del Taco (TACO) more recently. There is also the chance that another quick service chain will pull a Restaurant Brands-Popeye’s move to jumpstart its own growth metrics.

With more than 25% upside to our $11.50 price target, which is still a discount to the quick service peer group, and modest downside following the news of the March quarter, the risk to reward profile in HABT shares is rather tasty. As the company continues to expand its footprint East, I’ll continue to review the impact on the business – good and bad — as well as the bottom line and what it means for our price target.

  • We are adding shares of Habit Restaurant (HABT) to the Tematica Investing Select List as part of our Guilty Pleasure investing theme with an $11.50 price target.


Robust margins lead us to boost our price target for USAT shares

Yesterday morning USA Technologies (USAT) reported March quarter results that pushed the shares higher in morning trading, and has us nudging our price target to $12 from $11 in response. For the quarter, USA achieved EPS of $0.04, beating the consensus by $0.03, despite missing revenue expectations for the period by just over 6%, as the company’s gross margin rose to more than 33% vs. 25.0% in the year-ago quarter.

That jump in profitability reflects continued growth in USA’s total mobile payment connection base as well as sustained growth in the dollar transaction volume carried over those connections. Exiting the quarter, USA’s total connection base stood at 969,000 across 15,600 customers (up from 504,000 and 12,400, respectively exiting March 2017), with transaction volume climbing to $318 million, up 57% higher year over year.  USA’s margins also benefitted from realized synergies from its November 2017 acquisition of Cantaloupe Systems. As a reminder, Cantaloupe utilizes cloud-based, mobile technologies to offer an integrated end-to-end vending and payment solution for cashless vending, dynamic route scheduling, automated pre-kitting and merchandising and inventory management.

We continue to see that as extremely synergistic with USA’s mobile payment platform for vending and other unattended retail applications, with more incremental revenue and profit synergies to be had in the coming quarters. Central among those synergies is new customer engagements, which should drive additional mobile payment connections and customer growth. Also adding to that is the recently inked multi-year with payment processing firm Ingenico that pairs Ingenico’s hardware, software, security and services products with USA’s mobile payment services platform. As the company’s results and guidance, including the margin commentary, are digested, we expect 2018 EPS to move higher from the pre-earnings report consensus of $0.06 for this year and $0.13 next year.

Do we continue to think that USAT will emerge as a potential takeout candidate as the mobile payment industry continues to grow and mature? Yes, but that does not factor into our new price target of $12.

  • We are boosting our price target on USA Technologies (USAT) shares to $12 from $11 following robust margin performance in the March quarter and strong prospects for more realized synergies with its Cantaloupe acquisition and new Ingenico relationship.


Net asset value per share continues to climb at GSV Capital

Last night shares of Asset-lite company GSV Capital (GSVC) reported mixed March quarter results with a beat on the bottom line and a miss on the top line. As I’ve shared before, the real driver of GSV’s shares price is not revenue or earnings, but the trajectory of its investment portfolio, which we measure through its net asset value per share. Exiting the March quarter, that portfolio’s net assets across 29 positions totaled approximately $210.5 million, or $9.99 per share up from to $9.64 per share at the end of 2017, and $8.83 per share exiting the March 2017 quarter.

The company’s top five holdings, which included privately held Palantir Technologies, Spotify (SPOT), Dropbox (DBX), private company Coursera and NESTGVS, accounted for 58% of GSV’s investment portfolio exiting March vs. 39% in the year ago quarter. With consensus price targets of $157 and $33 for Spotify and Dropbox shares, respectively, we continue to see added lift in the company’s net asset value per share. Should the company’s largest holding in Palantir Technologies go public as is widely postulated or be acquired, we would have a third leg to the stool driving GSV’s net asset value growth higher.

Helping the net asset value per share comparisons, GSV repurchased 1.1 million shares during the quarter for $6.2 million, which reduced the shares outstanding by 5% year over year. Following the upsizing of the company’s share repurchase program by an additional $5 million, GSV has roughly $8.8 million remaining. At current levels, the company could repurchase another 1.25 million shares, shrinking its outstanding share count by 6%.

  • After reporting March quarter earnings that saw its net asset value per share continue to climb, we continue to rate GSV Capital (GSVC) shares a Buy with an $11 price target.


WEEKLY ISSUE: Robust Earnings and March Retail Sales Bode Well for Select List

WEEKLY ISSUE: Robust Earnings and March Retail Sales Bode Well for Select List


Once again, the stock market has shrugged off moves in the geopolitical landscape and mixed economic data to start the week off higher. Not surprising as the highly anticipated 1Q 2018 earnings season has gotten underway and based on what we saw the last two days so far so good. For the record, we had 44 companies that reported better than expected top and bottom line results, a number of them high profile companies such Bank of America (BAC), Netflix (NFLX), Goldman Sachs (GS), Johnson & Johnson (JNJ), and CSX (CSX).

Like I said, so far so good, and while we’re getting some additional nice EPS beats this morning, we’re still very early on in the 1Q 2018 earnings season. Make no mistake, it’s encouraging, but we have a long way to go until we can size up 1Q 2018 earnings performance vs. the high bar of expectation that calls for roughly 18% EPS growth year over year for the S&P 500.

That’s why I’ll continue to parse the data — earnings and otherwise — as it comes through. Last week and this week, we’ll get more of that for March, and that means we can get a view on how those data streams performed in full for 1Q 2018. Case in point, on Monday we received the March Retail Sales Report, which on its face came in at 0.6%, better than expected, and excluding autos and food services the metric also 0.6% vs. February. That translated into a 4.7% increase for retail ex-auto and food services year over year for the month. Stepping back, the data found in Table 2of the report showed that line item rose 4.3% year over year for all of 1Q 2018.

With that information, we can size up which categories contained in the report gained wallet share and identify those that lost it. The two big winners for 1Q 2018 were gasoline stations, up 9.7%, which was no surprise given the rise in gas prices over the last three months, and Nonstore retailers, which also rose 9.7%. We see that data as very favorable for our Amazon (AMZN) shares and boding well for Costco Wholesale (COST) given its growing e-commerce business. Contrasting that figure against the -0.6% for department store sales in 1Q 2108 confirms the ongoing shift in how and where consumers are shopping. Not good news in our view for the likes of JC Penney (JCP) and other mall anchor tenants.

The hardest hit category during 1Q 2018 was Sporting Goods, hobby, book & music stores, which fell 4% year over year. Remember, we’re seeing these categories impacted as well by the shift to digital commerce, streaming services such as newly public Spotify (SPOT) and programs like Amazon’s Kindle Unlimited that looks to be the Netflix (NFLX) of books, audiobooks, and magazines. In my view, the other shoe to drop for this Retail Sales Report category is the Toys R Us bankruptcy that is poised to do to the toy industry what the Sports Authority bankruptcy and subsequent liquidation sales did to Under Armour (UAA), Nike (NKE) and Adidas among others. We’ll get a better picture on that when toy company Mattel (MAT) reports its quarterly results later this week.

I’d also call out that Clothing & Clothing Accessories store retail sales for 1Q 2018 rose just 3.0%, signaling slower growth than overall retail sales – a sign that consumers are spending their disposable dollars on other things or elsewhere. Over the last year, we’ve more than touched on the transformation that is underway with digital shopping, and we continue to see Amazon as extremely well positioned. Likely augmenting that Amazon has moved its Amazon Prime Wardrobe service, its “try before you buy offering,” from beta to launch.

Of course, it requires Prime membership and we see this service as helping drive incremental Prime subscriptions, especially as Amazon continues to improve its apparel offering, both private label and branded. Another headwind to clothing retailers looks to be had in Walmart’s (WMT) upcoming website overhaul that is being reported to have a “fashion destination” that will leverage its partnership with Lord & Taylor. With branded apparel companies looking to reach consumers, some with their own Direct 2 Consumer businesses and others by leveraging third party logistic infrastructure, we’ll keep tabs on Walmart’s progress and what it means for brick & mortar clothing sales. If you’re thinking this should keep our Buy rating on shares of United Parcel Service (UPS), you’re absolutely right.

The bottom line is the March Retail Sales report served to confirm our bullish view on both Connected Society companies Amazon and UPS as well as Cash-Strapped Consumer play Costco.

  • Our price target on Amazon remains $1,750
  • Given its strong monthly same-store sales data and ongoing wallet share gains as it opens additional warehouse locations, we are boosting our Costco Wholesale (COST) price target to $210 from $200
  • Our long-term price target on United Parcel Service (UPS) shares remains $130


Robust Earnings from Lam Research Bode Well for Applied Materials

Last night Applied Materials (AMAT) competitor Lam Research reported stellar 1Q 2018 earnings and issued an outlook that topped Wall Street expectations. For the quarter, shipments of its semiconductor capital equipment rose 19% year over year, which led revenue to climb more than 30% year over year for the quarter. Higher volumes and better pricing led to margin expansion and fueled a $0.43 per share earnings beat with EPS of $4.79. All in all, a very solid quarter for Lam, but also one that tell us demand for chip equipment remains strong. Those conditions led Lam to guide current quarter revenue to $2.95-$3.25 billion vs. the consensus view of $2.94 billion.

From growing memory demand, 5G chips sets, 3D sensing, smarter automobiles and homes, and augmented reality to virtual reality and the Internet of Things, we continue to see a number of emerging technologies that are part of our Disruptive Technologies investing theme driving incremental chip demand in the coming years that will fuel demand for semi-cap equipment. We see this as a very favorable tailwind for our Applied Materials shares. Also, let’s not forget Applied’s recently upsized dividend and buyback programs, which, in my view limits potential downside in the shares.

  • Our price target on shares of Applied Materials (AMAT) remains $70.


The Habit Restaurant – Loving the Burgers and Shakes, but Not the Shares Just Yet

People need to eat. That’s a pretty recognizable fact. Some may eat more than others, some may eat less; some may eat meat, others may not. But at the end of the day, we need food to survive, but in some cases for comfort at the end of a long day.

As investors, we recognize this and that means considering where and what consumers eat, and also identifying companies that are poised to benefit from other opportunities as well. One such opportunity is geographic expansion, and with restaurants, it often means expanding across the United States.

Typically, expansion is driven by new store openings, which in turn drive sales. Tracing back its expansion over the last several years, Chipotle Mexican Grill (CMG) had to build up to 2,363 locations. Even with that number of locations, per Chipotle’s recently filed 10-K, the company still expects to “open between 130 and 150 new restaurants in 2018.” At that pace, it would take quite a while before Chipotle had as many locations as McDonald’s (MCD) (more than 14,000) or Starbucks (SBUX) (just under 14,000) in the U.S. exiting last year.

A little over a year ago, Restaurant Brands (QSR), the company behind Tim Hortons and Burger King, acquired Popeye’s in part for food-related synergies but also the opportunity to grow Popeye’s through geographic expansion. In 2016, Popeye’s had some 2,600 locations compared to more than 7,500 Burger Kings in the U.S. For those wondering, that’s greater than the 2,251 locations Jack in the Box (JACK) had in 2017.

This brings us to  The Habit Restaurants (HABT), a Guilty Pleasure company if there ever was one.

With just 209 Habit Burger Grill fast-casual locations in 11 states spread between the two coasts, Habit has ample room to expand its concept serving flame char-grilled burgers and sandwiches, fries, salads and shakes. And if you’re wondering how good Habit is, don’t just listen to me (one of those 209 locations is just a few miles away from him), the company was named “best tasting burger in America” in July 2014.

In 2017, the company recorded revenue of $331.7 million from which it generated EPS of $0.16. For this year, consensus expectations have it serving up revenue near $393 million, up around 18% year over year, but EPS of $0.05 — a sharp drop from 2017.

What I’m seeing is Habit hitting an inflection point as it engages a national advertising agency, opens 30 new locations this year (7-10 in first-quarter 2018) and contends with higher wage costs (up 6%-7% vs. 2017), as well as test markets breakfast. Making matters challenging, the overall restaurant industry has been dealt a tough hand during the first two months of 2018 as winter weather and cold temperatures led to reduced traffic and same-store sales industry-wide, according to research firm TDn2K.

While a recent survey of March restaurant sales published by Baird showed a pick-up, the question I am pondering is to what degree will restaurant sales rebound on a sustained basis as the winter weather fades? I’m asking this question full well knowing the level of credit-card and other debt held by consumers as the Fed looks to hike interest rates several times this year.

Do I like the long-term potential of Habit?

Yes, and I would recommend their burgers, fries, and shakes – without question. That said, the company is not without its challenges, especially as McDonald’s begins to roll out its fresh beef offering nationwide. I had one of those a few days ago and in my view, it’s a clear step up from what Mickie D’s had been serving. You may be getting the idea that I like burgers, and I can easily confirm that as well as my fondness for chocolate shakes.

By most valuation metrics, HABT shares are cheap, but as we all know, cheap stocks are usually cheap for a reason. As such, we want to see how the company performed during the first quarter, the quarter in which the greatest number of new locations were to be opened. Typically, new locations drive up costs, and given the uptick in wage costs, this combination could weigh on the company’s bottom line.

All of this has us sitting on the sidelines with Habit Restaurants shares, which means adding them to Tematica Investing Contender List as part of our Guilty Pleasure investing theme.