The Magic 8-Ball Market

The Magic 8-Ball Market

Last week ended with equity markets taking another dive that accelerated into Friday’s close as the trade war with China intensified heading into its eighteenth month with China announcing that it will impose retaliatory tariffs on US goods. The S&P 500 closed down 2.5% for the third time this month. After the close President Trump launched a twitter storm to announce additional retaliatory tariffs in response to China’s. So that’s going well.

Investors face challenging times as the major market movers have simply been words (tweets) coming from politicians and bureaucrats, the prediction of which is akin to assessing the next missive from a Magic 8-Ball.

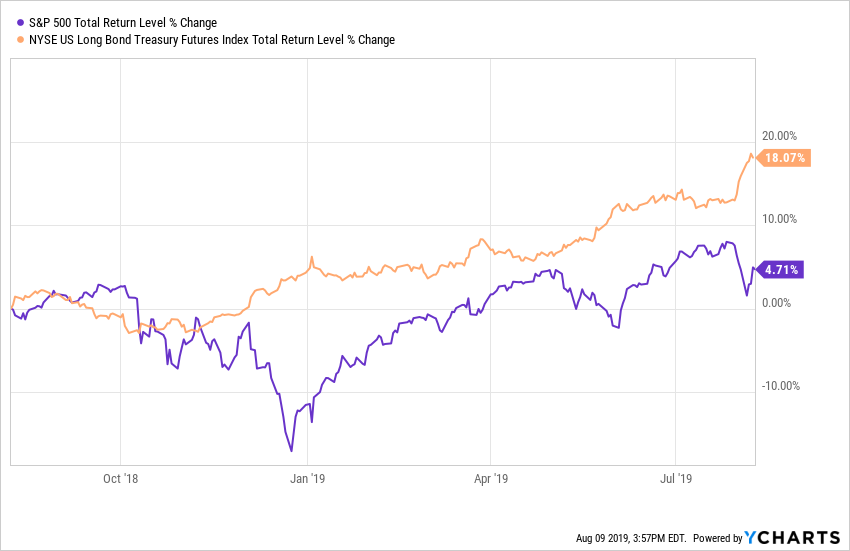
While many continue to talk about the ongoing bull market, the major US equity market indices have seen four consecutive weekly declines and are all in the red over the past year with the small cap Russell 2000 down well over 10%, sitting solidly in correction territory. On the other hand, this year has seen the strongest performance out of long-maturity Treasuries since at least 1987.
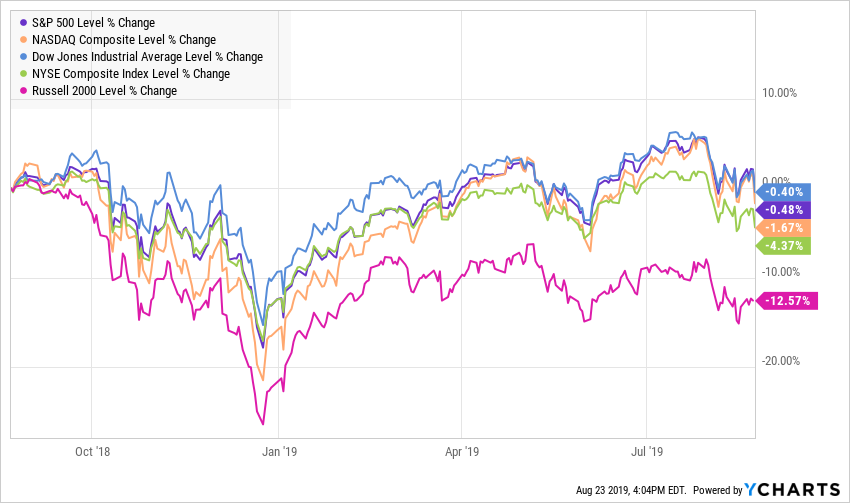
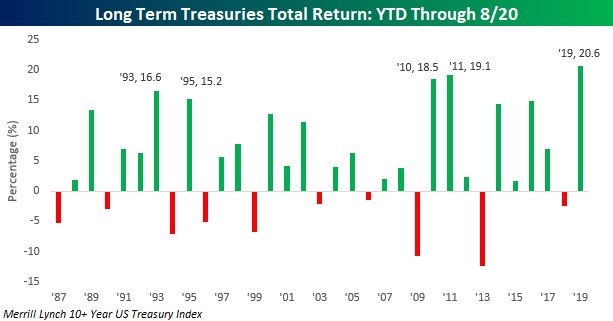
Source: Bespoke Investment Group

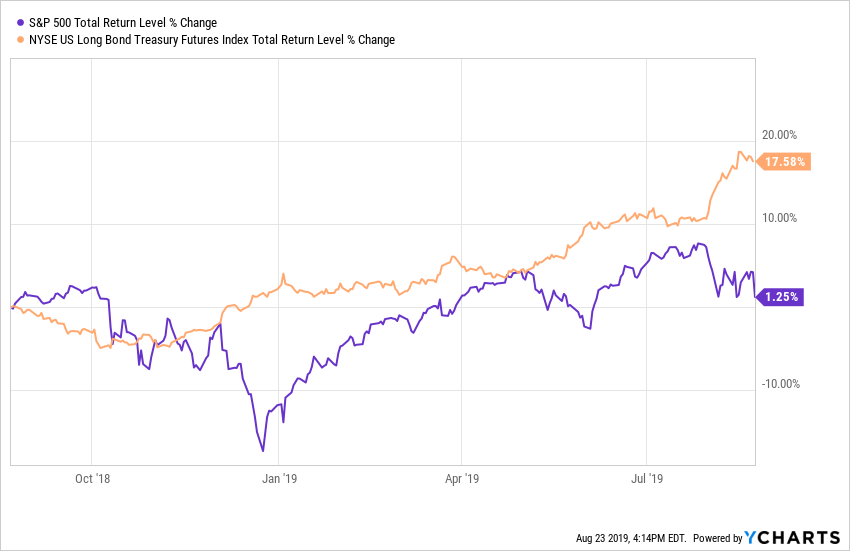
How many bull markets see the total return for the long bond outpace the S&P 500 by over 16%.
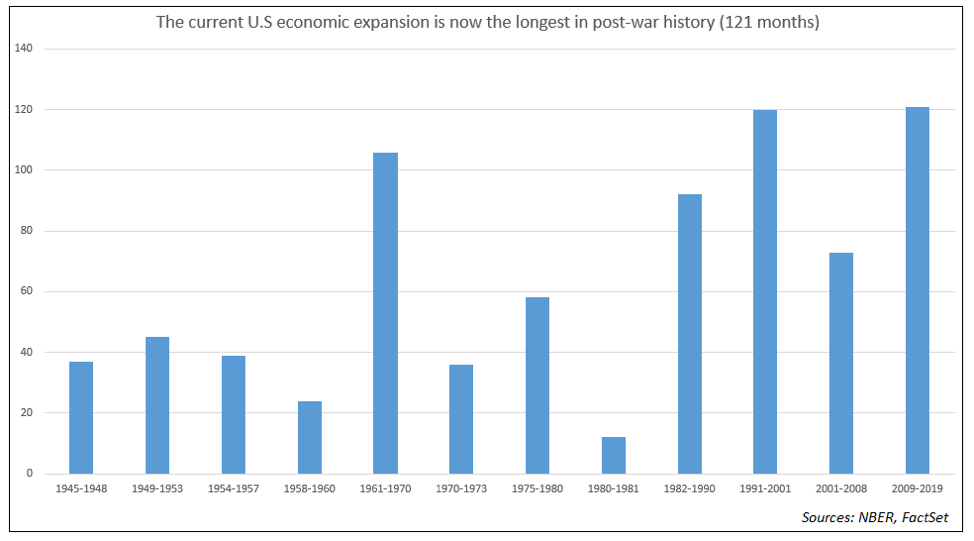
This comes at a time when the domestic economy is in it 121st month, the longest is post-war history, which means that many have not lived through a recession as an adult.

Yield Curve

As the adage goes, expansions don’t die of old age, but their footing becomes less sure over time and we are seeing signs of rockier terrain. One sign comes from the yield curve which has been flattening steadily since October 2018 with the spread between the 10-year and the 3-month falling from over 100 basis points to -39. The most widely watched part of the curve, between the 10-year and 2-year, has inverted four times in the past few weeks.
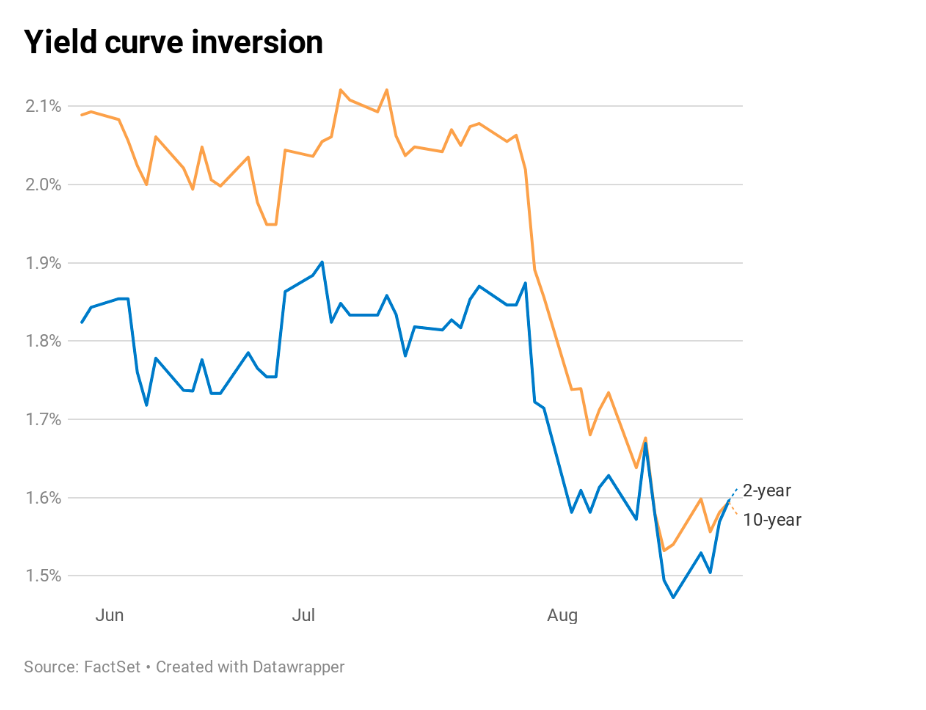

This 2-10 inversion is most closely watched as over the past 50 years it has preceded all seven recessions. Credit Suisse has found that on average a recession hit 22 months after the 2-10 inversion occurred.

The third of August’s four inversions came as Kansas City Federal Reserve President Esther George and Philadelphia Fed President Patrick Harker stated in a CNBC interview that they don’t see the case for additional interest rate cuts following the cut in July. Mr. Market was not looking to hear that.

This past week we also received the meeting minutes from the prior Fed meeting with led to July’s 25 basis point cut which gave the impression of a Fed far less inclined to cut than the market was expecting with most Fed participants seeing July’s cut as part of a recalibration but not part of a pre-set course for future cuts. Keep in mind that central bank rate cuts are a relative game and ECB officials have been signaling a high likelihood of significant accommodative measures at the September meeting, saying the ECB “will announce a package of stimulus measures at its next policy meeting in September that should overshoot investors’ expectations.”

Manufacturing

Another source of bumps on the economic road comes from the manufacturing sector, both domestic and international. A recent IHS Markit report found that the US manufacturing sector is in contraction for the first time in nearly a decade as the index fell from 50.4 in July to a 119-month low of 49.9 in August – readings below 50 indicate contraction.

According to the Institute for Supply Management, US manufacturing activity has slowed to a nearly three-year low in July. By August New Orders (a key leading indicator) had dropped by the most in 10 years with export sales falling to the lowest level since August 2009.

New business growth has slowed to its weakest rate in a decade, particularly across the service sector. Survey respondents mentioned headwinds from weak corporate spending based on slower growth expectations both domestically and internationally – likely caused by the ongoing trade war that got much, much worse this past week.

In a note to clients on August 11th, Goldman Sachs stated that fears of the US-China trade war leading to a recession are increasing and that the firm no longer expects a trade deal between the two before the 2020 US election. The firm also lowered its GDP forecast for the US in the fourth quarter by 20 basis points to 1.8%.

Global manufacturing has also been slowing, with just two of the G7 nations, Canada and France, currently showing expansion in the sector. In July, China’s industrial output growth slowed to the weakest level in 17 years.
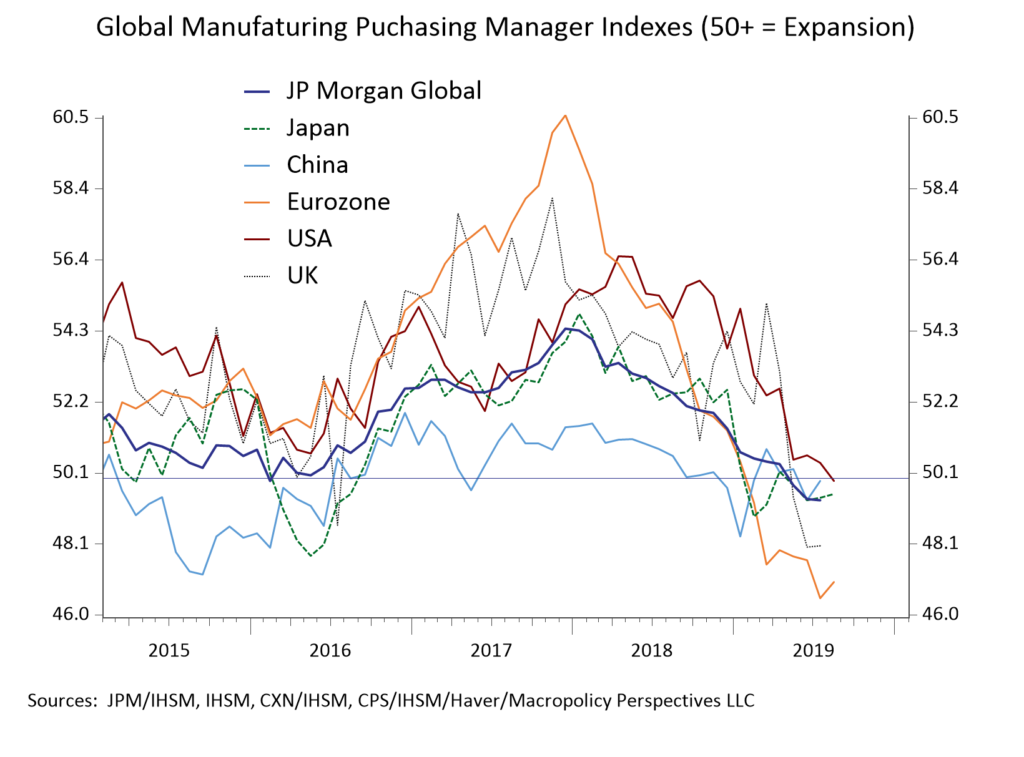
Germany is seeing the most pronounced contraction with its manufacturing PMI dropping from 63.3 in December 2017 to 43.6 this month. German car production has fallen to the levels last seen during the financial crisis.
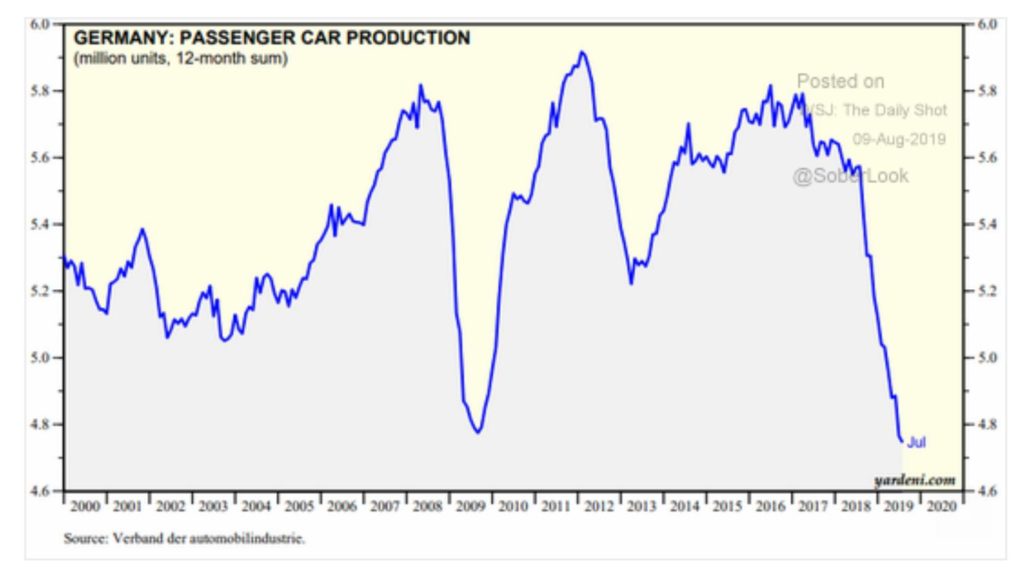
Overall, we see no sign of stabilization in global manufacturing as global trade volumes look to be rolling over, leaving the economy heavily dependent on growth in the Consumer and the Service sectors. Keep in mind that the last time global trade volumes rolled over like this was back in 2008.

The Consumer

The consumer is yet another source of bumps on the economic road. Ms. Pomboy’s tweet is perfect.
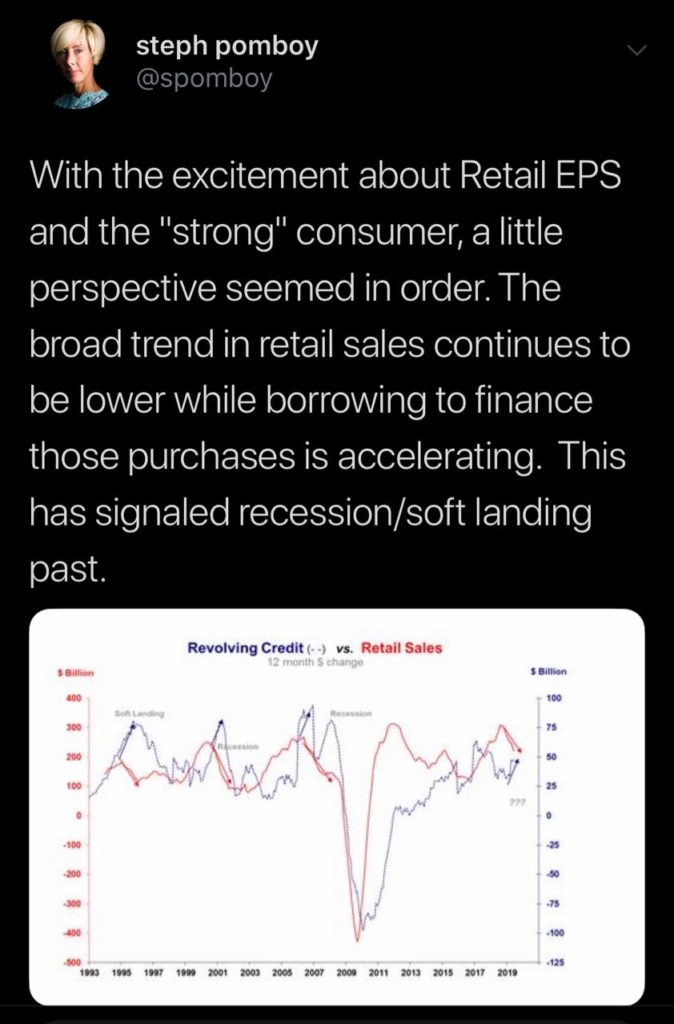
As for that debt, Citigroup recently reported that its credit-card delinquency rate had risen to 2.91% in July from 2.56% in June versus its three-month average of just 1.54%. With all the positive stock moves we’ve seen in retail, keep in mind that the story for many has been more about earnings than actual growth.

For example, Nordstrom (JWN) shares rose 21% after it delivered stronger-than-expected earnings, but that was off of weaker than expected revenue of $3.87 billion versus expectations for $3.93 billion. Nordstrom also slashed net sales guidance for the fiscal year as well as earnings guidance. Management forecast net sales for the year to decrease by about 2%. It previously estimated sales would be flat to 2% down. It also slightly lowered guidance on earnings per share to a range of $3.25 to $3.50, compared with the prior guidance of between $3.25 to $3.65. Did I mention shares rose 21%?

US Consumer sentiment fell to 92.1 in August, the lowest reading for 2019, versus expectations for 97 and down from 98.4 in July. If sentiment continues to degrade, how long will the consumer continue to load up credit cards in order to spend?

Debt

It isn’t just the consumer that is taking on more debt – yet more economic bumps. The federal government deficit rose by $183 billion to $867 billion during just the first 10 months of this fiscal year as spending grew at more than twice the rate of tax collections. The Congressional Budget Office expects the annual budget deficit to be more than 1 TRILLION dollars a year starting in 2022. Total public debt, which includes federal, state and local has reached a record 121% of GDP in 2019, up from 69% in 2000 and 43% in 1980.
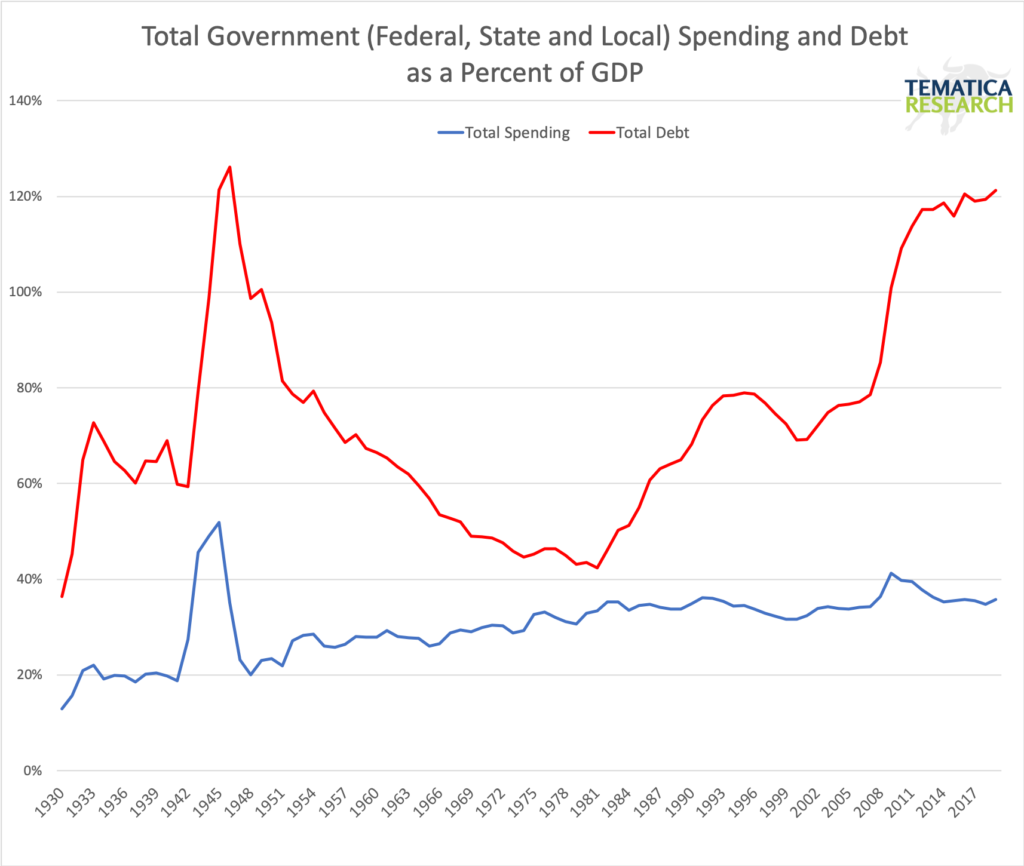
Keep in mind that debt is pulling resources out of the private sector and at such high levels, fiscal stimulus becomes more challenging in times of economic weakness. The only time debt to GDP has been higher was after WWII, but back then we had relatively young population and a rapidly growing labor force compared to today.

I’ve mentioned before that I am concerned with the strengthening dollar. Dollar denominated on balance sheet debt is over $12 trillion with roughly an additional $14 trillion in off-balance sheet dollar denominated debt – that’s a huge short USD position. The recent resolution of the debt ceiling issue means that the US Treasury now needs to rapidly rebuild its cash position as I had been funding the government through its reserves. This means that we will see a drain on global liquidity from the issue of over $200 billion in Treasury bills.

I’ve also written many times in the past concerning the dangers that lie in the enormous levels of corporate debt with negative yielding corporate debt rising from just $20 billion in January to pass the $1 trillion mark recently – more bumps on the road.

Bottom Line

As I said at the start of this piece, this expansion is the longest in post-war history which doesn’t itself mean a recession is imminent, but it does mean that the economy is likely to be more vulnerable. Looking next at the economic indicators we see quite a few that also imply a recession is increasingly likely.

The President’s twitter storm in response to China’s tariffs and the continually rising geopolitical uncertainties that create a strong headwind to any expansions in the private sector only increase risks further. Perhaps by the time you read this piece some part of the rapid escalation of the trade war will have been reversed, as foreign policy has become increasingly volatile day-to-day, but either way, the view from here is getting ugly.

Turning Heads I Win, Tails You Lose Inside Out

Turning Heads I Win, Tails You Lose Inside Out

For much of the current expansion, cycle investors have been forced taught to believe in a Heads-I-Win-Tales-You-Lose investing environment in which good economic news was good for equities and bad economic news was also good for equities. Good news obviously indicates a positive environment, but bad news meant further central bank intervention, which would inevitably raise asset prices.

Those who didn’t buy-the-dip were severely punished. Many fund managers who dared to take fundamentals into consideration and were wary, or put on portfolio protection, saw their clients take their money and go elsewhere. An entire generation of market participants learned that it’s easy to make money, just buy the dip. That mode just may be changing as the past two weeks the major indices have taken some solid hits. Keep in mind that while the headlines keep talking up the equity markets, the total return in the S&P 500 has been less than 5% while the long bond has returned over 18%. Austria’s century bond has nearly doubled in price since it was first offered less than two years ago!

Earnings Season Summary

So far, we’ve heard from just under 2,000 companies with the unofficial close to earnings season coming next week as Wal Mart (WMT) reports on the 15th. The EPS beat rate has fallen precipitously over the past week down to 57.2%, which if it holds, will be the lowest beat rate since the March quarter of 2014. Conversely, the top line beat rate has risen over the past week to 57.4% which is slightly better than last quarter, but if it holds will be (excepting last quarter) the weakest in the past 10 quarters. The difference between the percent of companies raising guidance versus percentage lowering is down to -1.8% and has now been negative for the past four quarters and is below the long-term average.

With 456 of the 505 S&P 500 components having reported, the blended EPS growth estimate is now -0.72% year-over-year, with six of the eleven sectors experiencing declining EPS. This follows a -0.21% decline in EPS in Q1, giving us (if this holds) an earnings recession. The last time we experienced such a streak was the second quarter of 2016.

The Fed Disappoints

Last week Jerome Powell and the rest of his gang over at the Federal Reserve cut interest rates despite an economy (1) the President is calling the best ever, (2) an unemployment rate near the lowest level since the 1960s, at a (3) time when financial conditions are the loosest we’ve seen in over 16 years and (4) for the first time since the 1930s, the Fed stopped a tightening cycle at 2.5%. We have (5) never seen the Fed cut when conditions were this loose. They were looking to get some inflation going, Lord knows the growing piles of debt everywhere would love that, but instead, the dollar strengthened, and the yield curve flattened. Oops. That is not what the Fed wanted to see.

The President was not pleased. “What the Market wanted to hear from Jay Powell and the Federal Reserve was that this was the beginning of a lengthy and aggressive rate-cutting cycle which would keep pace with China, The European Union and other countries around the world,” he said in a tweet. “As usual, Powell let us down.”

The dollar’s jump higher post-announcement means that the Fed in effect tightened policy by 20 basis points. Oops2. The takeaway here is that the market was not impressed. It expected more, it priced in more and it wants more. Now the question is, will the Fed give in and give the market what it wants? Keep in mind that both the European Central Bank and the Bank of England are turning decisively more dovish, which effectively strengthens the dollar even further.

Looking at past Fed commentary, the track record isn’t exactly inspirational for getting the all-important timing right.

But, we think the odds favor a continuation of positive growth, and we still do not yet see enough evidence to persuade us that we have entered, or are about to enter, a recession.” Alan Greenspan, July 1990

“The staff forecast prepared for this meeting suggested that, after a period of slow growth associated in part with an inventory correction, the economic expansion would gradually regain strength over the next two years and move toward a rate near the staff’s current estimate of the growth of the economy’s potential output.” FOMC Minutes March 20, 2001

“At this juncture, however, the impact on the broader economy and financial markets of the problems in the subprime market seems to likely be contained.” Ben Bernanke, March 2007

“Would I say there will never, ever be another financial crisis? You know probably that would be going too far but I do think we’re much safer and I hope that it will not be in our lifetimes and I don’t believe it will be.” Janet Yellen, June 2017 (This one is going to be a real doozy)

This time around Fed Chairman Powell told us that what we are getting is a “mid-cycle policy adjustment.” Wait, what? We are now (1) in the longest expansion in history with (2) the lowest unemployment rate in over 50 years as (3) corporate leverage levels reaching record levels at a (4) time when more of it is rated at just above junk than ever before in history. This is mid-cycle? I’m pretty sure this one will be added to the above list as some serious Fed facepalming. Now I think these folks are incredibly bright, but they are just tasked with an impossible job and live in a world in which their peers believe they can and ought to finesse the economy. So far that theory hasn’t turned out all that well for anyone who doesn’t already have a good-sized pile of assets.

Domestic Economy (in summary because it is August after all)

  • We are 3-year lows for the US ISM manufacturing and services PMIs.
  • We are seeing a shrinking workweek, contracting manufacturing hours and factory overtime is at an 8-year low.
  • Just saw a contraction in the American consumer’s gasoline consumption.
  • American households just cut their credit card balances, something that happens only about 10% of the time during an expansion. Keep in mind that Q2 consumer spending was primarily debt-fueled when looking towards Q3 GDP.
  • The Organization for Economic Co-operation and Development (OECD) Leading Economic Indicator for the US fell to a 10-year low in June, having declined for 18 consecutive months. A streak of this nature has in the past always been indicative of a recession. Interestingly that same indicator for China just hit a 9-month high.
  • The Haver Analytics adjusted New York Fed recession risk model has risen from 50% in early January to a 10-year high of 80%.

Global Economy

  • The IMF has cut world GDP forecasts for the fourth consecutive time.
  • We have 11 countries so far in 2019 experiencing at least one quarter of shrinking GDP and 17 central banks are in cutting mode with Peru the latest to cut, the Royal Bank of Australia hinting at further cuts and Mexico and Brazil likely next in line.
  • Some 30% of the world’s GDP is experiencing inverted yield curves.
  • Over half the world’s bond market is trading below the Fed funds rate.
  • Despite the sanctions on Iran and OPEC output cuts, WTI oil prices have fallen over 20% in the past year.

Europe

  • The Eurozone manufacturing PMI for July fell to 46.5, down from 47.6 in June and is now at the lowest level since the Greek debt crisis back in 2012 as employment declined to a six-year low with a decline in exports. Spain came in at 48.2, 48.5 for Italy and 49.7 for France.
  • Germany, long the economic anchor for the Eurozone and the world’s fourth-largest economy, has negative yields all the way out 30 years and about 40% of Europe’s investment-grade bonds have negative yields. The nation’s exports declined 8% year-over-year and imports fell 4.4% in June as global demand continues to weaken.
  • France had its industrial production contract -2.3% in June versus expectations for -1.6%.
  • Italy’s government is back in crisis mode as the two coalition ruling parties look to be calling it quits. Personally, I think Salvini (head of the League) has been waiting for an opportune time to dump his Five Star partners and their recent vote against European Infrastructure gave him that chance. The nation is likely heading back to the polls again at a time when Europe is facing a potential hard Brexit, so we’ve got that going for us.
  • The UK economy just saw real GDP in Q2 contract 0.2% quarter-over-quarter. Domestic demand contracted -3%. Capex fell -0.5% and has now been in contraction for five of the past six quarters. Manufacturing output also contracted -2.3% in the worst quarter since the Great Financial Crisis.

Asia

  • South Korean exports, a barometer for global trade, fell 11% year-over-year in July. The trade war between South Korea and Japan continues over Japan’s reparations for its brutal policy of “comfort women” during WWII.
  • The trade war with China has entered the second year and this past week it looks unlikely that we will get anything sorted out with China before the 2020 election. The day after Fed’s rate decision Trump announced that the US would be imposing 10% tariffs on $300 billion of Chinese goods starting September 1st. In response, China devalued its currency and word is getting out that the nation is preparing itself for a prolonged economic war with the US. The rising tension in Hong Kong are only making the battle between the US and China potentially even more volatile and risky. Investors need to keep a sharp eye on what is happening there.
  • Auto sales in China contracted 5.3% year-over-year in July for the 13th contraction in the past 14 months.
  • Tensions are rising between India and Pakistan thanks to India’s PM Modi’s decision to revoke Kashmir’s autonomy.

US Dollar

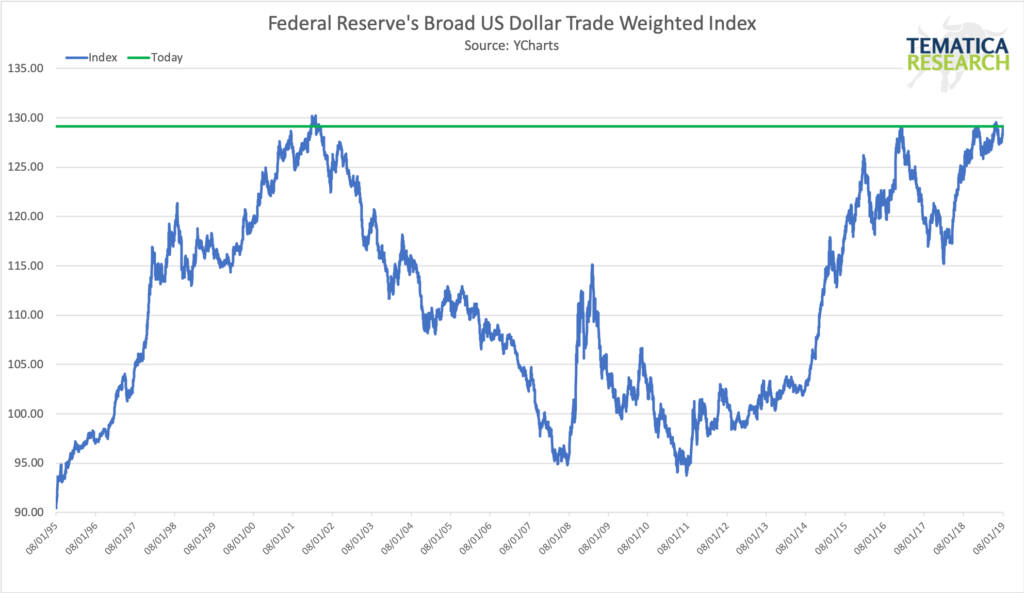
When we look at how far the dollar has strengthened is have effectively contracted the global monetary base by more than 6% year-over-year. This type of contraction preceded the five most recent recessions. While the headlines have been all about moves in the equity and bond markets, hardly anyone has been paying attention to what has been happening with the dollar, which looks to be poised the breakout to new all-time highs.

Reaching for new all-time highs?

A strengthening dollar is a phenomenally deflationary force, something that would hit the European and Japanese banks hard. So far we are seeing the dollar strengthen significantly against Asian and emerging market currencies, against the New Zealand Kiwi and the Korean Won, against the Canadian dollar and the Pound Sterling (Brexit isn’t helping) and China has lowered its peg to the dollar in retaliation against new tariffs in the ongoing trade war. There is a mountain of US Dollar-denominated debt out there, which is basically a short position on the greenback and as the world’s reserve currency and the currency that utterly dominates global trade. As the USD strengthens it creates an enormous headwind to global growth.

The deflationary power of a strengthening US dollar strength in the midst of slowing global trade and trade wars just may overpower anything central banks try. This would turn the heads-I-win-tales-you-lose buy-the-dip strategy inside out and severely rattle the markets.

The bottom line is investors need to be watching the moves in the dollar closely, look for those companies with strong balance sheets and cash flows and consider increasing liquidity. The next few months (at least) are likely to be a bumpy ride.

The market is going great so no need to worry, right?

The market is going great so no need to worry, right?


There are weeks when sitting down to write this piece is tough because not much worthy of note has happened in the markets or the economy outside of the usual noise. This week, that was most definitely not the case. Thank God it is Friday – we all need a break.


New Market Highs and the Economy Gets Uglier

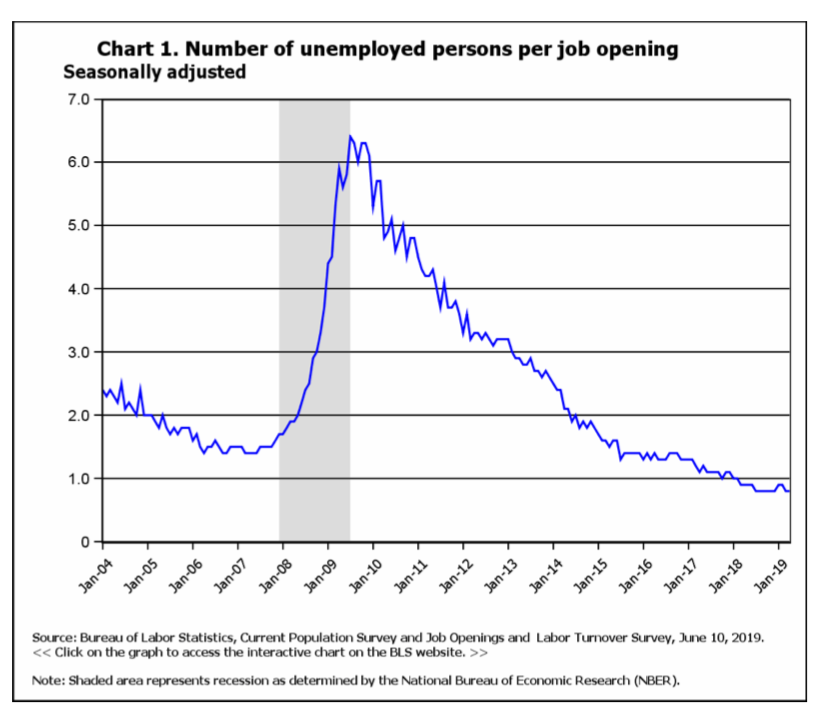
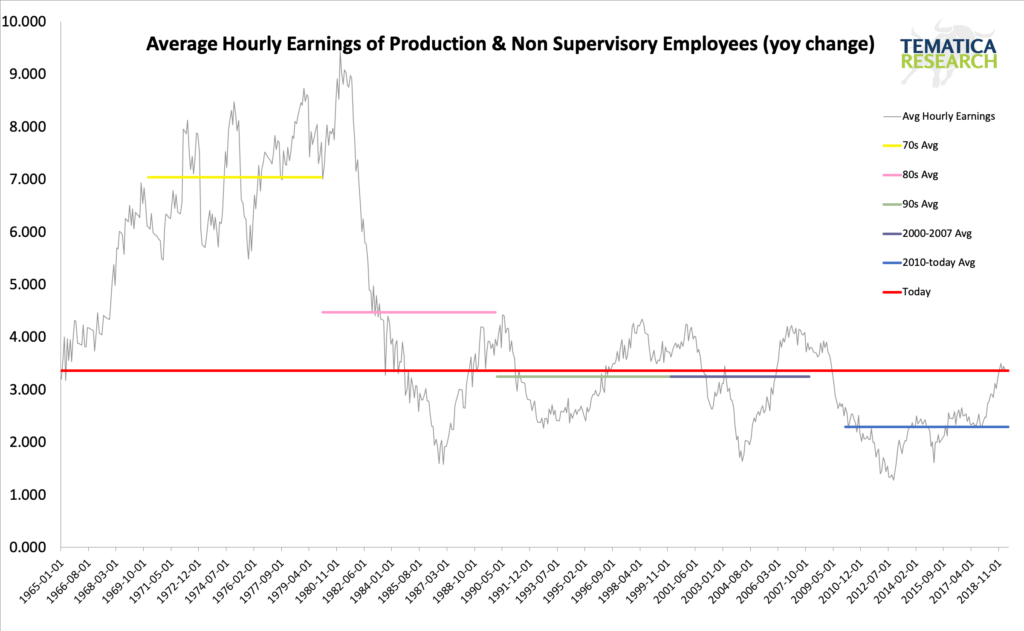
Thursday the S&P 500 closed at a new all-time high and is now above its 50-day, 100-day and 200-day moving averages. The post Federal Reserve Open Market Committee meeting debrief gave the market essentially what it wanted, a significantly more dovish stance with plenty of reasons to believe future rate cuts are imminent. Perhaps the Marty Zweig adage, “Don’t fight the Fed,” has been flipped on its head to “Fed, don’t fight the markets.” Unemployment is at multi-decade lows with more job openings than unemployed persons, rising hourly earnings, and improving retail sales while the market hits all-time highs and yet the Fed is preparing to stimulate. Yeah, something’s off here.

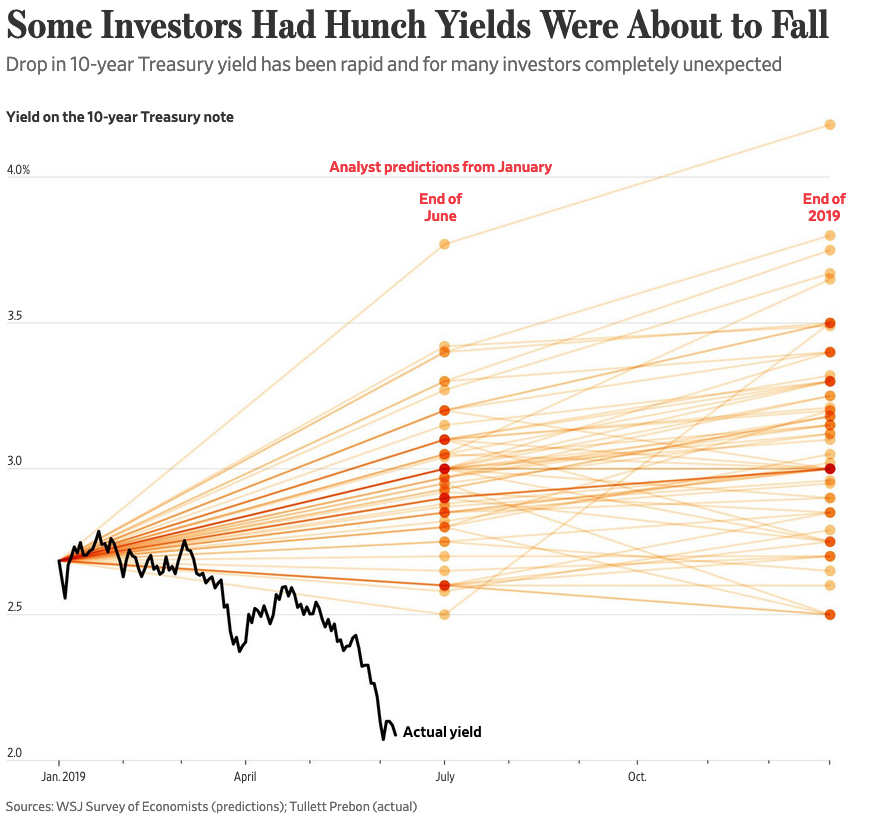
Stocks may be partying like it is 1999 (for those who remember that far back) but the yield on the 10-year closed at 2.01% Thursday. To put that in context, on June 9th when the 10-year was down to 2.09%, the Wall Street Journal ran an article asserting that, “Almost nobody saw the nosedive in bond yields coming, but a few players were positioned well enough to profit. Some think there is more room for yields to fall further,” along with this chart. To be clear, despite not one respondent predicting the yield on the 10-year would fall below 2.5% in 2019, none of these economists are idiots, but the thing is they all tend to read from the same playbook.

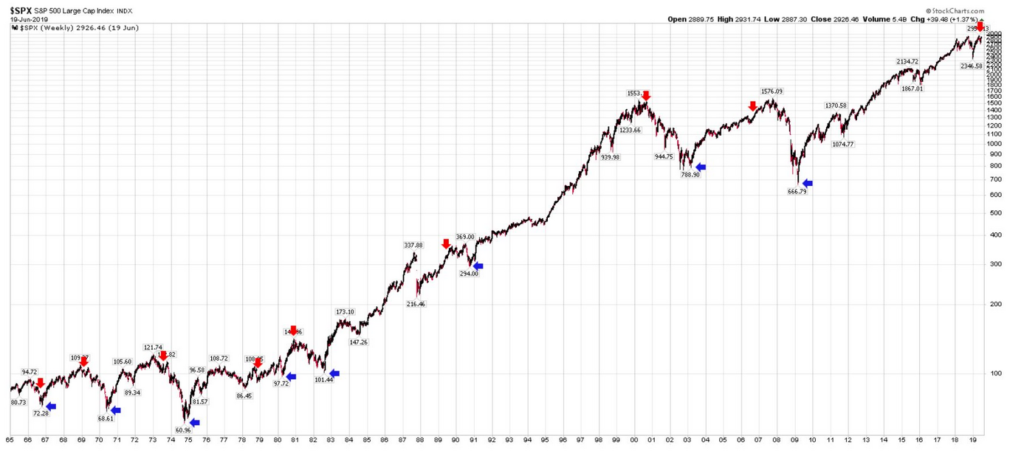
The stock market is giddy over its expectations for lower rates, yet the spread between the 3-month and the 10-year Treasury has been inverted for four weeks as of this writing, not exactly a ringing endorsement for economic growth prospects. Every time this curve has been inverted for 4 consecutive weeks, it has been followed by a recession (hat tip @Saxena_Puru) for this chart. Note that the chart uses 10-year versus 1-year until the 3-month became available in 1982. Much of the mainstream financial media and fin twit believe this time is different. Time will tell.

The red arrows denote 4 consecutive weeks of inversion and the blue arrows mark bear-market lows (20% declines).

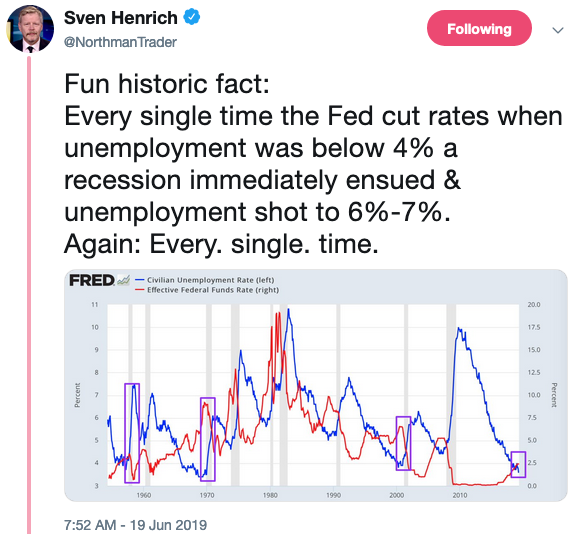
Then there is this, with a hat tip to Sven Henrich whose tweet with a chart from Fed went viral – that in and of itself says a lot.

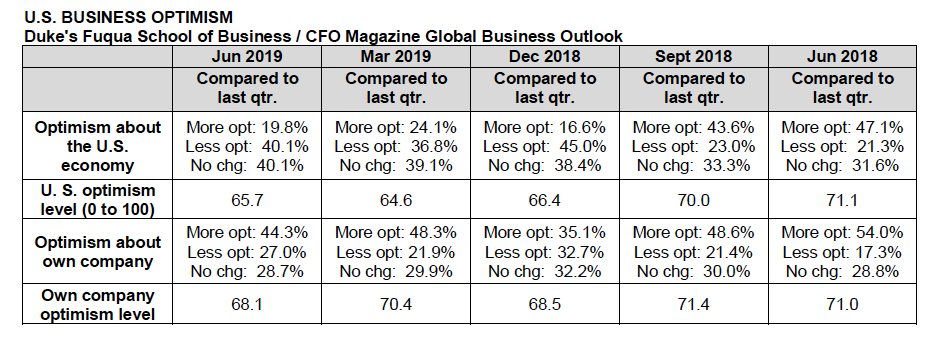
Both US imports and exports have declined from double-digit growth in 3Q 2018 to essentially flat today. The recent CFO Outlook by Duke’s Fuqua School of Business found that optimism about the US and about their own companies amongst CFO’s had fallen from the prior year.

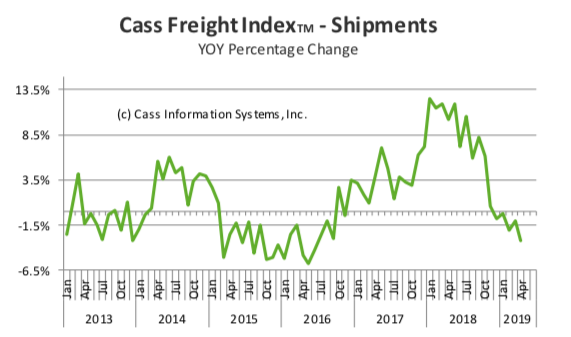
The shipments of goods being moved around the country have plummeted since the beginning of 2018, as shown by the Cass Freight Index.

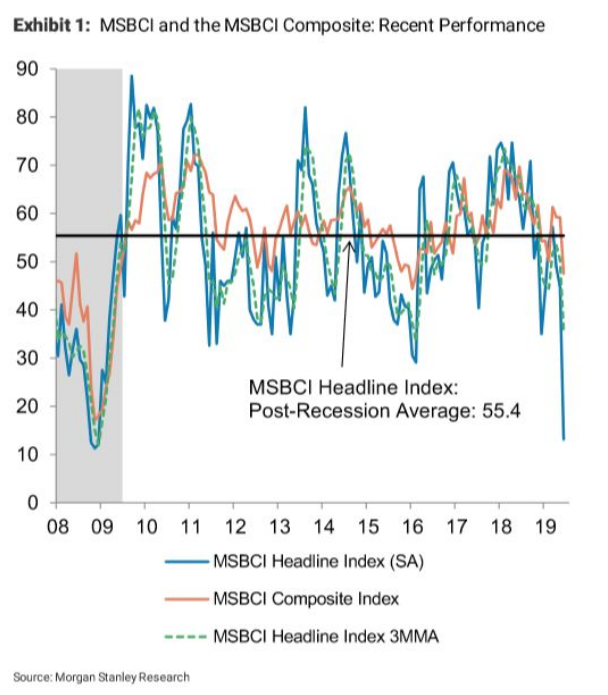
The Morgan Stanley Business Conditions Index fell 32 points in June, the largest one-month decline in its history.

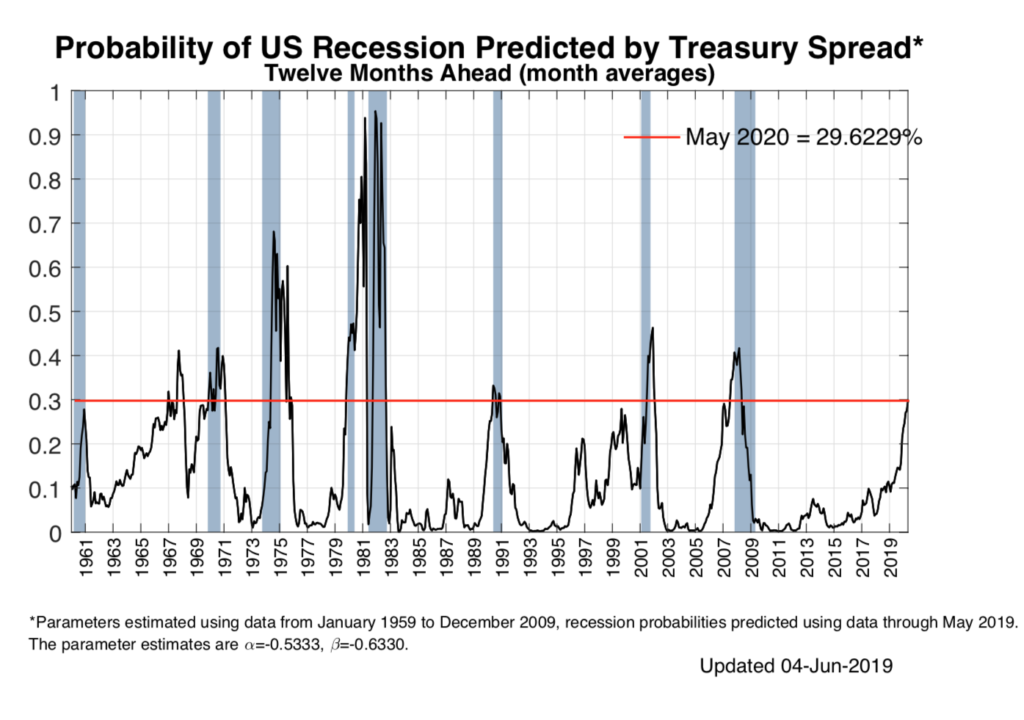
If all that doesn’t have your attention, consider that the New York Fed’s recession probability model puts the probability that we are in a recession by May 2020 at 30%. Note that going back to 1961, whenever the probability has risen to this level we have either already been in a recession or shortly entered one with the exception of 1967 – 7 out of 8 times.

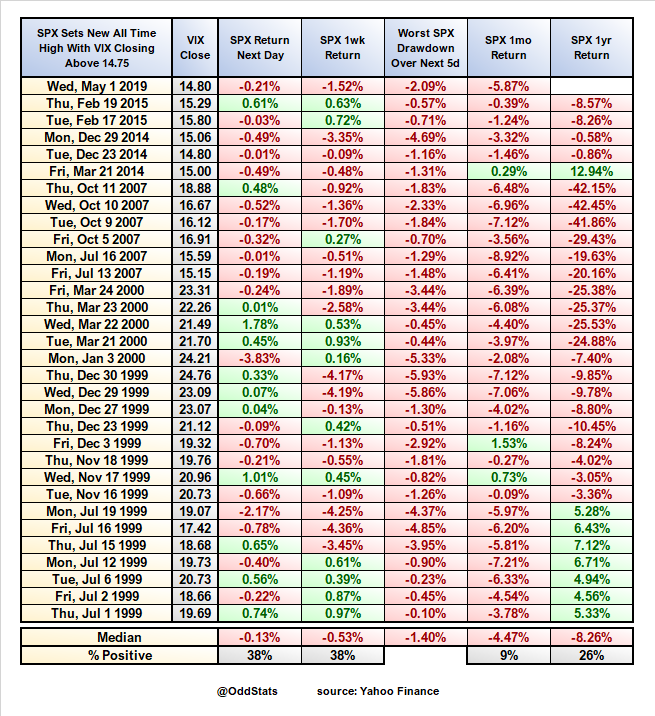
But hey, the market is going great so no need to worry right? If that’s what you are thinking, skip this next chart from @OddStats.


Geopolitics – From Bad to Oh No, No No

Brinksmanship with Iran continues as in the early hours of Friday we learned that the US planned a military strike against Iran in response to the shooting down of an American reconnaissance drone. The mission was called off at the last minute after the President learned that an estimated 150 people would likely have been killed. Frankly, the official story sounds a bit off, but what we do know is that we are in dangerous territory and one can only hope that some cooler heads prevail, and the situation gets dialed back a whole heck of a lot.

Given we weren’t enjoying enough nail-biting out of the Middle East news, an independent United Nations human rights expert investigating the killing of Saudi journalist Jamal Khashoggi is in a 101-page report recommending an investigation into the possible role of the Saudi Crown Prince Mohammed bin Salam citing “credible evidence,” and while not specifically assigning blame to bin Salam, did assign responsibility to the Saudi government. This week the US Senate voted to block arms sales to Saudi Arabia, rebuking the President’s decision to use an emergency declaration to move the deal forward. This matters when it comes to investing because there are some seriously high-stakes games being played out that have the potential to suddenly rock markets without any warning.

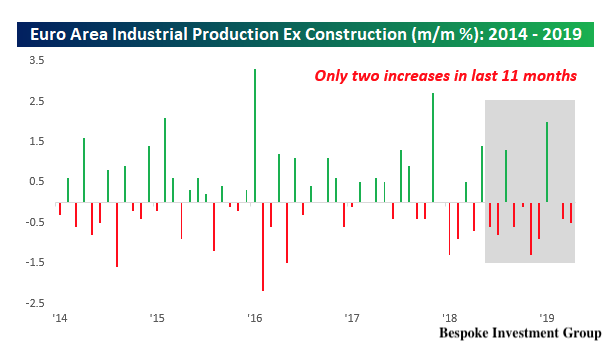
Over in Europe more and more data points pointing to a slowing economy, which led to European Central Bank President Mario Draghi to announce that more stimulus could be in the works if inflation fails to accelerate. At the ECB’s annual conference in Sintra, Portugal Draghi stated that, “In the absence of improvement, such that the sustained return of inflation to our aim is threatened, additional stimulus will be required.” It isn’t just inflation that is troubling the region. Euro Area Industrial Production (ex Construction) has only seen increases in 2 of the last 11 months.

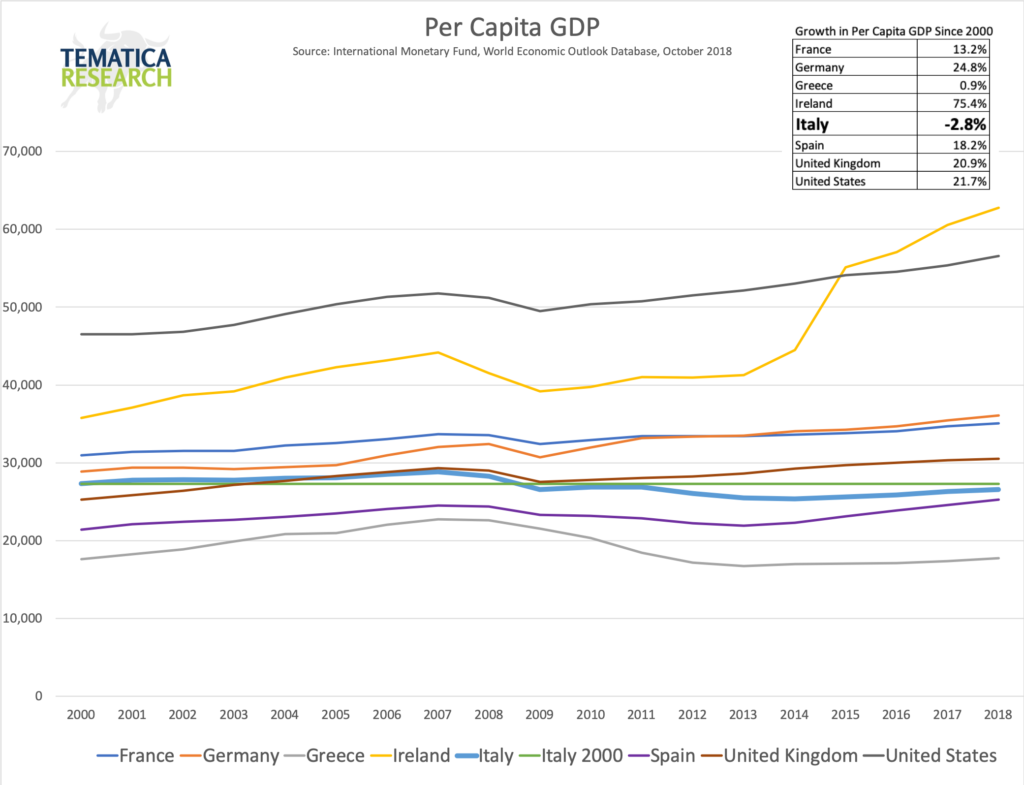
Italy continues to struggle with its budget deficit outside the limits allowed by the European Union, leading to a battle between Rome and Brussels. Friday Deputy Prime Minister Matteo Salvini (head of the euro-skeptic Lega party) threatened to quit his position if he is not able to push through tax cuts for at least €10 billion. While the US has been laser-focused on the Fed (and the president’s tweets) the Italian situation is getting more tense and a time when UK leadership with respect to Brexit is also getting a lot more tense. To put the Italian problem in perspective and understand why this problem is not going away, look at the chart below.

Today, Italy’s per capita GDP is 2.8% BELOW where it was in 2000 while Germany is 24.8% higher. Even the beleaguered Greece has outperformed Italy. Italy’s debt level is material to the rest of the world, its economy is material to the European Union, its citizens are losing their patience and its leadership consists of a tenuous partnership between a far-right, fascist-leaning Lega and a far-left, communist(ish) 5 Star movement lead by folks that very few in the nation respect. So that’s going well.

As if the European Union didn’t have enough to worry about as its new parliament struggles to find any sort of direction or agreement on leadership, the parliamentary process for selecting the next Prime Minister of the UK is down to two finalists. Enthusiam is rampant.

A hard Brexit is looking more likely and that is not going to be smooth sailing for anyone.


The Bottom Line

All this is a lot to take in, but there is a bright light for the week. Anna Wintour, Vogue’s editor-in-chief and eternal trend-setter, has given flip-flops her seal of approval. So, we’ve got that going for us. If that didn’t put a little spring into your step, I suggest you check out this twitter feed from Paul Bronks. Your soon-to-be more swimsuit ready abs will thank me, but your neighbors will wonder what the hell is going on at your place.

Weekly Issue December 17 2018

Weekly Issue December 17 2018

Key points inside this issue:

  • The Duke University/CFO Global Business Outlook survey surprises the market
  • Costco stumbles, but it is far from down and out
  • Thematic confirmation had in the November Retail Sales Report
  • Digging into Friday’s other economic reports
  • What to watch this week
  • Holiday Housekeeping

The Duke University/CFO Global Business Outlook survey surprises the market

What looked to be shaping up as a positive week for the stock market turned on its head Friday following renewed concerns over the pace of the global economy. As we’ve talked about recently, the vector and velocity of the latest economic reports suggest a slowing economy and that is fueling questions over the top and bottom-line growth prospects for 2019.

Tossing some logs on the that fire late last week was the new survey findings from the Duke University/CFO Global Business Outlook survey that showed almost half (48.6%) of US chief financial officers believe the United States will be in recession by the end of next year while 82% of CFOs surveyed believe that a recession will begin by the end of 2020. That’s quite different than the Wall Street consensus, which per The Wall Street Journal’s Economic Forecasting Survey sees the speed of the economy slowing from 3.5% in the September 2018 quarter to 2.5% in the current one to 2.4% in the first half of 2019 followed by 2.2% in the back half of the year.

This revelation has added to the list of concerns that I’ve been discussing of late and adds to the growing worries over EPS growth prospects in 2019.


Costco stumbles, but it is far from out

Last Thursday night, Costco Wholesale (COST), our Middle-Class Squeeze Thematic Leader, reported an EPS beat by $0.05 per share for the quarter, but revenue came in a tad short at up 10.3% year over year, or $34.3 billion vs. the expected $34.66 billion. Same-store sales for the quarter rose 8.8% (+7.5% ex-gasoline and currency), which is well above anything we’ve seen for the September-November period per Friday’s November Retail Sales report save for digital shopping (Non-store retailers) and gas station sales – more on that shortly.

Despite the positive EPS, COST shares fell 8.6% on Friday.

The issue with Costco was the margin profile as reported operating income was essentially flat year over year. When combined with the top line increase vs. the year-ago quarter it means the company’s operating margin hit 2.7% vs. 3.0% in the year-ago quarter, and 3.2% this past August quarter. Part of the issue was the jump up in pre-opening expenses for new warehouse locations which rose by 6% quarter over quarter. The real culprit was the step up in merchandising costs, which climbed 10.8% year over year for the November quarter vs. 5.4% year over year in the September quarter. Clearly, Costco is seeing the impact of not only higher prices but also the impact of tariffs associated with the U.S.-China trade war.

Despite that, the core basics at the company – foot traffic, renewal rates, and membership growth – continue to fire on all cylinders. That to me makes Costco one of the best-positioned retailers, and the fact that its e-commerce business continues to blossom is positive as well. In all of 2019, Costco looks to open 20-23 net new warehouses, which equates to an increase of 2.5%-3.0% year over year. This will likely drive pre-opening expenses higher in the coming months, but given the favorable metrics associated with each new location over the medium to longer-term, we’ll take it, especially if the economy slows more than expected. Odds are that will drive more consumers to Costco than not.

  • Our long-term price target on Costco Wholesale (COST) shares remains $250.


Thematic confirmation in the November Retail Sales Report

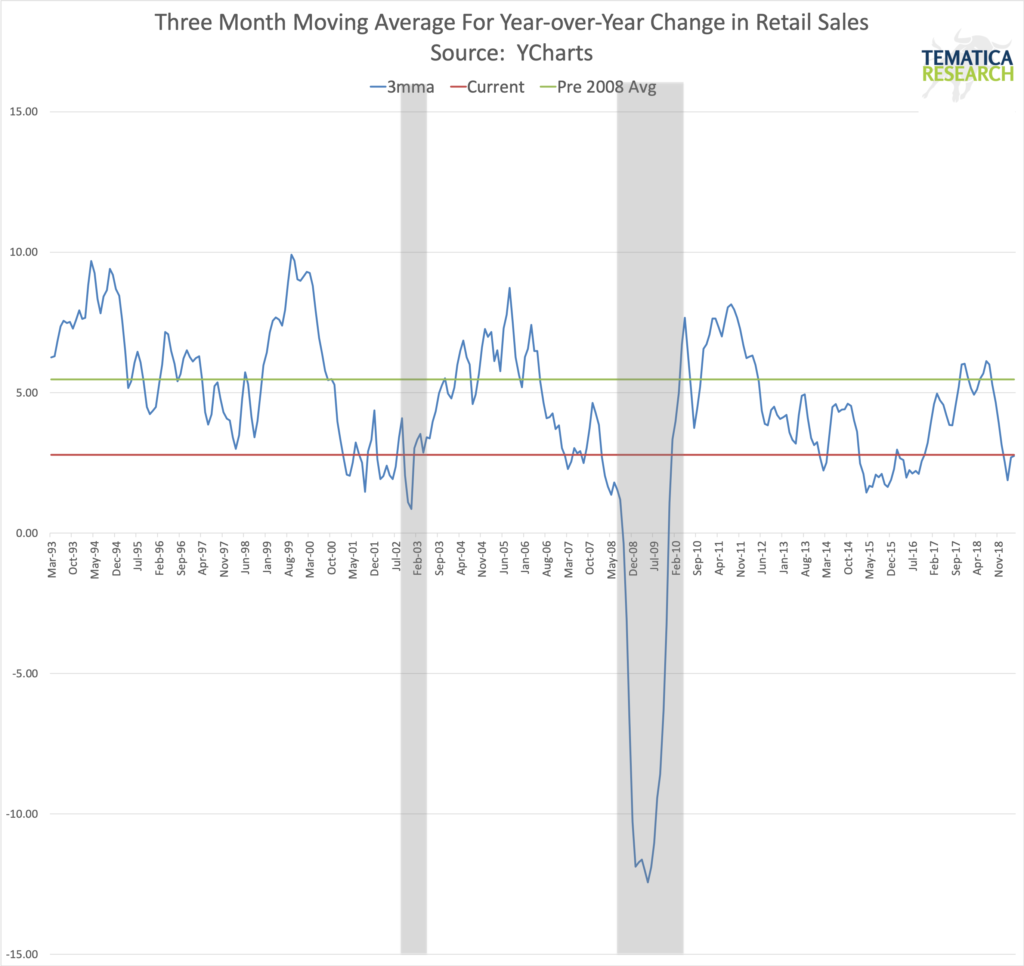
Looking over Friday’s November Retail Sales Report, core Retail Sales rose 4.0% year over year with strong performance as expected for Non-store Retailers (+10.8% year over year), Gasoline Stations (+8.2%) and Food Service & Drinking Places (+5.6%). To me, those first and third categories ring positive for our Digital Lifestyle and Living the Life investing themes. That means I see those as positive signs for our thematic and holiday shopping positioned companies, which includes the aforementioned Costco, but also Amazon (AMZN), United Parcel Service (UPS), McCormick & Co. (MKC), International Flavors & Fragrances (IFF) and Del Frisco’s Restaurant Group (DFRG).

Back to the November Retail Sales report, while the sequential overall retail comparisons came in either as expected or slightly better depending on the forecast one is looking at, what’s likely to catch the market’s attention is the sequential drop in year over year retail sales growth that was had in November. Again, year over year November retail sales growth rose 4.0%, which was down compared to the October year over year increase of 4.5%.

Given the growing amount of data that points to a slowing domestic economy, one that is driven meaningfully by the consumer, odds are market watchers will not love what they saw in those year over year comparisons. Add to it that a recent Gallup poll found that Americans plan to spend less on holiday gifts today than they expected back in October and less than they expected to spend in 2017. The $91 decline in expected spending since October is “one of the steeper mid-season declines, exceeded only by a $185 drop that occurred in 2008, as the Wall Street financial crisis was unfolding, and a $102 drop in 2009 during the 2007-2009 recession.”

Clearly, those latest data points weighed on the overall stock market last week, but those weren’t the only ones.


Digging into Friday’s other economic reports

The November Retail Sales report wasn’t the only set of key data that weighed on the market last Friday. The November Industrial Production Report showed a flat manufacturing economy following the modest dip in October. On the December Flash PMI reports, the U.S. hit a 19-month low for the month with softer new order growth, while “Lower oil-related costs contributed to the slowest rate of input price inflation since the start of the year.” Turning to the eurozone, its Composite Output PMI hit 51.3, down from 52.7 in November, and reached a four-year low. The Flash Manufacturing PMI data for Japan was better, as it rose to 52.4 for December up from 52.2 in November, but that is hardly what we would call a robust figure given the expansion/contraction line at the 50.0 level. While new orders activity improved in Japan, new export orders fell, signaling a change of direction, which supports the notion of a slowing global economy.

This data along with the back and forth on U.S.-China trade, Brexit developments, Italy budget concerns, protests in France, and the potential government shutdown have all raised investor uncertainty levels. We see this in the current “Extreme Fear” (9) reading on the CNN Business Fear & Greed Index, which is little changed over the last few weeks. We’ve seen this play out in the stock market as the number of stocks hitting new highs pales in comparison to hitting 52-week lows. As one likely suspects, we saw this play out in small cap stocks, which per the Russell 2000 last week, were once again the hardest hit of the major stock categories. Quarter to date, small cap stocks are down just under 17% quarter to date.

We saw a number of these concerns brewing as we exited September and entered the September- quarter earnings season. We have been careful in making additions to the Select List given what I’ve viewed as an environment that has been more skewed to risk than reward. Odds are that will continue to be the case between now and the end of the year, which means we will continue to be overly selective when it comes to deploying capital. For that reason, last week we added the ProShares Short S&P 500 ETF (SH) shares to our holdings to add some downside protection.


What to Watch This Week

Following last week’s rash of economic data, don’t ask me how or why but the Atlanta Fed saw fit to boost its GDP Now forecast for the current quarter to 3.0% from 2.4% last week. As subscribers know, I prefer the far more solid track record at the NY Fed and its Nowcast report, which now calls for the current quarter to be +2.4%, down from +2.44% last week. That’s in line with The Wall Street Journal’s Economic Forecasting Survey, but again that Duke poll is likely to be in the forefront of investor minds this week as more data is had. This includes several pieces of housing data — the November Housing Starts & Building Permits as well as November Existing Home Sales and the October NAHB Housing Market Index — as well as the November Durable Orders Report and November Personal Income & Spending data.

As I mentioned above, the number of economic numbers suggesting the global economy continues to slow are growing, which likely gives the Fed far more room to issue dovish comments after next week’s all but done December rate hike. In recent weeks as the Fed has once again signaled it will more than likely remain data dependent in 2019, we’ve seen a change in the futures market, which is now pricing in less than 20 basis points of rate hikes next year versus over 55 basis points just a few months ago. But we have to consider the reason behind this slower pace of rate hikes, which is the suggestion by recent data that the economy is far from overheating, which also adds to the core question we suspect investors and the market are asking: how fast/strong will EPS growth be in 2019?

As we prepare for Fed Chair Powell’s remarks, it’s not lost on me that we could very well see a “buy the rumor, sell the news” event following the FOMC meeting next week.

Heading down the final stretch of 2018, I’ll be looking at well-positioned companies relative to our investment themes that have been hard hit by the quarter to date move in the market. As of Friday’s market close, the S&P 500 was down X% quarter to date, while the tech-heavy Nasdaq Composite Index and the small-cap heavy Russell 2000 were down 14% and nearly 17%, respectively, on that basis. One of the criteria that I’ll be focusing on as I weed through this growing list of contenders is favorable EPS growth year over year relative to the S&P 500. And, yes, when I say that I do mean to “real” EPS growth due to rising profit margins and expanding dollar profits instead of those lifted largely by buyback activities.

With that in mind, I’ll be paying close attention to a number of key earnings reports coming at us next week. These include Nike (NKE), Carmax (KMX), ConAgra (CAG), General Mills (GIS), Micron (MU), FedEx (FDX) and Darden Restaurants (DRI). Inside these reports and company commentaries, I’ll be looking for data points that to confirm our investment themes, the question of inflation vs. deflation and where it may be, and a last-minute update from FedEx on digital commerce for this holiday shopping season that we are all in the thick of. Also, among those reports is Del Frisco’s competitor – The Capital Grill, which is owned by Darden. I’ll be paying extra close attention to that report and what it means for our DFRG shares.


Holiday Housekeeping!

And that brings us to our Housekeeping note, which is this – given the way the Christmas and New Year’s holidays fall this year, barring any unforeseen issues that will require our attention and immediate action, we here at Tematica will be in “get ready for 2019” mode. That means we’ll be using the quiet holiday time to review the Thematic Leaders as well as positions on the Select List to ensure we are well prepared for the coming months ahead.

As such, we’re likely to be back the week of January 7th, although I can’t rule out the urge to share some thoughts with you sooner. For example, if the Fed says something that rolls the stock market’s eyes later this week, I’ll be sure to weigh in and share my thoughts. The same goes for the Darden earnings report I mentioned above and what it may mean for our DFRG shares.

We will have a new podcast episode or two before then, and we will be sharing a number of Thematic Signals over the coming weeks – if only those confirming signs for our investment themes would take a break. I’m only kidding, but of course, I love how recognizable and relatable the themes are in and around our daily lives.

To you and your loved ones, Merry Christmas, Happy Holidays, and Happy New Year! See you 2019!!