Weekly Issue: As Global Economy Slows, Investors Switch into Fear Mode

Weekly Issue: As Global Economy Slows, Investors Switch into Fear Mode


Key points inside this issue

  • The global economy continued to slow in August
  • Uncertainty has investors in Extreme Fear mode
  • Trade remains the focus of the stock market
  • Boosting our Disney (DIS) price target following D23’s Disney+ focus
  • Items to watch this week


The stock market has been a more volatile than usual over the last few weeks as investors:

  • Contend with the latest global economic data
  • Eye the yield curve
  • Question what the Fed will do next
  • Brace for the next round of trade talks

As if that wasn’t enough, we’ve also witnessed mixed June quarter retail earnings, which are now getting factored into second half of 2019 earnings-per-share expectations for the S&P 500. At the same time, the velocity of corporate buybacks has slowed, Washington is scrutinizing tech companies, and consumer confidence is waning. 

All in all, these issues weighing on investors minds have led to swings in the market based on the most recent headlines, and that can make for a challenging time in the market and for investors.


The global economy continued to slow in August

Last Thursday morning, we received the first meaningful piece of August economic data in the form of the IHS Markit Flash PMI data for the month, and in aggregate, it confirms the global economic slowdown. To date, the U.S. has been the best house on the slowing economic block, but Thursday’s data, which showed the domestic manufacturing sector contracting for the first time in a decade means the trade war and uncertain environment are weighing on the economy. 

During periods of uncertainty, whether we’re talking about companies or people, the natural instinct is to pull back, wait and assess the situation. For both people and companies, dialing back spending is an arguable course of action when faced with uncertainty, but from an economic perspective that translates into a headwind for growth. We’re seeing that headwind in the day’s Flash PMI data.

Aside from the headline, U.S. Flash Manufacturing PMI hit 49.9, marking a 119-month low; the index’s new orders component put in its weakest reading since 2009. Per the report, “Survey respondents often cited subdued corporate spending in response to softer business conditions and concerns about the global economic outlook.” 

But as we saw with the July Retail Sales report, consumers continue to spend, despite rising debt levels and banks are starting to report a pick-up in delinquency rates. The question that is coming to the forefront of investor minds is whether consumers will be able to spend and keep the economy chugging along during the all- important holiday shopping season that will soon be upon us? Given the continued increase in consumer debt levels and news that Citibank (C), JPMorgan Chase (JPM), Bank of America (BAC) and other banks are reporting rising credit card delinquency rates we could be starting to see the consumer spending breaking point. 

Looking at the August Flash PMI data for the eurozone, the slowdown continued as well, but the report also registered a “sizeable drop in confidence regarding the 12-month outlook” with sentiment down to its lowest level since May 2013. Digging into that report we find new order growth in Germany, the largest economy in the eurozone, falling to its weakest levels since early 2013. The August data for the region confirms current forecasts the region is likely to hit just 0.1%-0.2% Gross Domestic Product in the current quarter. Another round of weak data, and odds are we’ll soon see recession fears rising ahead of the European Central Banks upcoming mid-September monetary policy meeting.


Uncertainty has investors in Extreme Fear mode

If we were to step back and look at the data, what we are seeing is data that points to a continued slowdown with some bright spots. Granted those bright spots are also somewhat mixed and there are reasons to be concerned over the sustainability of those bright spots. Is it any wonder then that the CNN Money Fear & Greed Index has been firmly in “Extreme Fear” for the last week? In a word, no.

During periods of Extreme Fear, the jittery market is bound to overreact. Add in the fact that we are in one of the seasonally slowest times of the year for trading volumes means market reactions will be even more extreme one way or another. The danger for investors is to get caught up in the turbulence, and it can be rather easy to do, especially if one is looking to pile onto a money-making trade, be it a long or short one. This makes headline-grabbing, bold assertions increasingly digestible, like the one from hedge fund hired-gun Harry Markopolos on General Electric (GE) or rumormongering like the recent one that drove the recent pop in shares of Tesla Motors (TSLA).

Rumors and assertions are tricky things, and while some may turn out to be true, others may only have a whisper of truth, if any at all. In the case of Markopolos, he’s working with an unnamed hedge fund partner, and while it would be wrong to cast wide dispersion on the industry, the reality is it is hurting. In 2018, eVestment hedge fund performance data showed the overall hedge fund industry returned negative 5.08%. While the industry is in positive territory on a year-to-date basis this year, it still meaningfully lags the major market indexes.

The bottom line is that in a market environment that is teaming with uncertainty on several sides, it is even more important that investors continue to focus on the data rather than be led astray by rumors and conjecture. Whether it is digging into a company’s financial filings; cross referencing conference call transcripts across a company’s competitors, customers and suppliers; or wading deep into the economic data, now more than ever it is important to do the homework rather than simply piling onto an idea that could simply be one person talking his or her trade book.  In our case, we’ll continue to assess and revisit the tailwinds that powers each of our investing themes each week through Thematic Signals and our Thematic Reading as well as our Thematic Signals podcast. 

Along the way, we may find something that helps put some of those potentially over-the- top assertions into perspective. One such example is found in the work by Bronte Capital that took Markopolos’ assertion that GE’s industrial margins near 15% are “too good to be true” to task by comparing them with similar margins at Honeywell (HON), Emerson Electric (EMR) and others. Once again, digging into the data adds that layer of context and perspective that is both helpful and insightful to investors.

In my experience, making a trade without doing the homework first and getting conviction on the thesis rarely yields the hopium expected. If the homework checks out, it offers confidence and conviction in the position. Periodically checking the data to determine if that thesis remains on track can either keep one’s conviction running high or alert to a potential issue. Not doing the homework leaves one vulnerable to a change they might not even known was coming.


Trade remains the focus on the stock market

As we approached the end of last week, the stock market was poised to move higher week over week, but as we saw it finished up on a very different note given all of Friday’s news. That news spanned from China threatening countermeasures on tariffs set to be instilled on Sept. 1, to the Fed being ready to extend the current recovery even though it remains upbeat about the domestic economy, to President Trump “ordering” U.S. companies to look for “alternative to China” and then raising tariffs on China after the market close. 

There was little question, we were once again seeing U.S.-China trade tensions escalate, raising questions as to what it could mean for the next round of trade talks. In other words, as we headed into one of the last summer weekends, U.S.-China trade uncertainty continued. While the market absorbed China’s escalation and Fed Chair Powell’s “at the ready when needed” comment, it was Trump’s latest trade salvo that reversed the market’s direction for the week leading all the major stock indices to finish down for the week. Trump said he would raise existing duties on $250 billion in Chinese products to 30% from 25% on October 1 and increase the 10% tariff on another $300 billion of Chinese goods set to take effect on September 1 to 15%.

The trade drama at the G-7 meeting continued over the weekend, and it appeared the market was going to start this week off with more than a whimper given that last night US stock market futures were down more than 1%. However, like any good drama that has a number of twists, this morning President Trump shared that China wants to make a trade deal, which served to walk back last week’s jump in trade tensions. 

My stance on the trade war has been a combination of hope, patience and details. Hope for a trade deal, patience realizing it would take time to come together and that the details of any trade agreement matter. Despite the purported trade related developments today, my stance remains unchanged. 


Boosting our Disney price target following D23’s Disney+ focus

While many were watching the political and trade events unfold at the G-7 meeting over the weekend, there was another gathering of note – D23 2019 at which Walt Disney (DIS) shared quite a bit about its upcoming Disney+ service that is set to launch on November 12. As I’ve said before, that service not only grows Disney’s exposure to our Digital Lifestyle investing theme, it’s also going to change how Wall Street values both DIS shares as well as those for Netflix (NFLX)

On its own Disney+ will cost users $6.99 a month, or $69.99 for a full year, but together with ESPN+ and ad-supported Hulu the bundle will run customers $12.99 per month, which is on par with the standard plan offered by Netflix that allows for two screens to be watching at the same time. The starter price for Disney+ allows for up to support for four simultaneous streams with 4K included. That’s quite a difference, and one that runs the risk of eating into Netflix’s business, particularly at the margin as Middle-class Squeeze consumers tally up how much they are spending on all of their streaming video and music as well as other subscription services

During D23 Disney showcased a plethora of Disney+ exclusive content ranging from its Star Wars to Marvel universes. On the Marvel front, Disney+ will include seven live action programs that are expected to tie into the active Marvel Cinematic Universe (MCU) that span existing characters and introduce new ones as well. While some may be missing the original Marvel streaming content that was found on Netflix, the upcoming Marvel content on Disney+ will continue the interlocking nature of the box office films that culminated in this summer’s blockbuster Avengers: Endgame. 

The original programming will be dribbled out over the coming quarters, but at launch Disney+ is expected to contain approximately 7,000 episodes of television series and 400 to 500 movies. According to Disney CEO Bob Iger, almost every single movie in the Disney catalog will eventually be available on the service. That is expected to pale in comparison to the sheer volume of content found on Netflix, which according to Ampere Analysis will be roughly eight times bigger than Disney+’s launch lineup. That may help explain the initial price point for Disney+ but what the service has going for it is it will be the only place one can find some of the biggest franchises in entertainment. That’s very much a page out of the Disney park playbook, and the odds are certainly high that Disney will leverage the content found on Disney+ across its merchandising and park businesses. It was also revealed that Disney and Target (TGT) will partner to open Disney shops inside Target locations, which should only add to the Disney merchandizing business. 

The looming question is to what degree will Disney+ attract subscribers? A far better sense will be had once the service goes live, but that hasn’t stopped Wall Street for putting forth expectations. Wedbush expects Disney to add between 10 million and 15 million subscribers to its service each year until they reach around 45 million. For context, that compares to roughly 60 million Netflix US subscribers and other firms are calling for a faster sign-up rate at Disney+ given the combination of cost and content. 

  • With details surrounding Disney+ becoming clearer, we are boosting our price target on Walt Disney (DIS) shares to $150 from $125. As subscriber data for Disney+ is shared, we’ll continue to refine our price target. 


What to watch this week

On the corporate earnings front this week, the parade of retail earnings will continue with J.Jill (JILL), Chico’s FAS (CHS), Tiffany & Co. (TIF), Best Buy (BBY), Ulta Beauty (ULTA), and Dollar Tree (DLTR) on tap to report, among others. In each of those reports, I’ll be looking for signals relating to our Living the Life, Digital Lifestyle, Aging of the Population, and Middle-class Squeeze investing themes. 

Beyond that cohort, we also have Sanderson Farms (SAFM) reporting and it will be interesting to see what it says about the growing prevalence of meat alternatives that are part of our Cleaner Living investing theme. . Yesterday, Cleaner Living Index company Beyond Meat (BYND) announced it will start testing plant-based fried chicken with YUM Brand’s (YUM) KFC in Atlanta beginning today, August 27. In keeping with that theme, we’ll be comparing and contrasting results at Campbell Soup (CPG) and Hain Celestial (HAIN) given the shifting preference among consumers for healthier foods and snacks. 

Also this week, specialty contractor and one-time Digital Infrastructure Thematic Leader Dycom Industries (DY) will issue its quarterly results and guidance, both of which should offer a view on 5G network buildout for its key customers that include AT&T (T) and Verizon (VZ). Given that Nokia (NOK) shares on the Select List, this will be a report worth digging into.   

While the number of economic data release last week were relatively light, they did pack quite a punch and that continued today with the July Durable Orders Report. While its headline figure showed a better than expected increase, excluding transportation, aircraft and defense to focus on core capital goods the data revealed a 0.4% increase in July, which followed the 0.9% increase in June. Sucking some of the air out of that improvement, core capital goods shipments in July dropped 0.7%, which will weigh on September quarter GDP forecasts. Over the coming days, we’ll get several other pieces of economic July data including trade inventories and Personal Income & Spending reports. 

Coming off a better-than-expected July Retail Sales report, we expect investors will be closely watching the July Personal Income & Spending report to gauge the degree to which consumers can be counted on to power the economy in the second half of the year. In addition to the usual monthly economic data, this week will also bring us the second GDP estimate for the June quarter. As focused as some might be on that revision, we here at Tematica far more focused on what the continued slowdown in the current quarter means for the market and investors. 

Costco continued to gain share in May

Costco continued to gain share in May


KEY POINT FROM THIS ALERT:

  • Our price target on shares of Costco Wholesale (COST) remains $220.

Late last night, Costco Wholesale (COST) once again delivered simply outstanding overall sales and comparable sales this time for the month of May. This continues the multi-month streak of not only mid to upper single digit year over year comparisons but ones that clearly standout relative to overall brick & mortar retail. We continue to see Costco winning consumer wallet share as consumers look to stretch their disposable dollars. With gas prices and other costs poised to creep higher as companies contend with rising input and freight costs, we see Costco extremely well positioned for what lies ahead.

Now for the nitty-gritty on the May sales data…

Net sales of $11.02 billion for the retail month of May rose 14.1% compared to  $9.66 billion last year. Helping achieve that robust results were the 950 warehouse locations exiting May 2018 vs. 732 at the end of May 2017 – a 2.7% increase year over year that also bodes very well for a continued rise in the high margin membership fee revenue. In terms of the geographic, year over year comparison for the four week period, Costco’s

  • US sales rose 11.7% (8.7% excluding gas and foreign exchange)
  • Canada, up 13.0% (5.4% excluding gas and foreign exchange)
  • Other International, 9.4% (7.4% excluding gas and foreign exchange)
  • Total Costco, up 11.7% (8.0% excluding gas and foreign exchange)

And while it remains a small piece of Costco’s overall revenue mix, its E-commerce business grew 34.4% during May 2018 vs. the year-ago month (33.3% excluding foreign currency).

Reviewing all of the above in full, Costco is reaping the benefits of having properly positioned itself with consumers, especially Cash-strapped Consumers, and is in the process of reaping those benefits as it expands its footprint.

We’ll continue to enjoy the ride.

  • Our price target on shares of Costco Wholesale (COST) remains $220.


Boosting our AMZN price target as Amazon crushes expectations

Boosting our AMZN price target as Amazon crushes expectations

KEY POINTS FROM THIS UPDATE ON AMAZON (AMZN):

  • We are boosting our price target on Amazon (AMZN) shares to $1,250 from $1,150, which keeps our Buy rating intact.
  • Last night Amazon crushed 3Q 2017 expectations and offered an upbeat take on the current quarter.
  • Culling through the quarterly results, Amazon’s key differentiator – Amazon Web Services – continues to ride the cloud adoption wave and fund its expanding services and geographic footprint.
  • As we have said for some time, as consumers and business continue to migrate increasingly to online and mobile platforms Amazon shares are ones to own, not trade.


Last night thematic investing poster child Amazon (AMZN) reported 3Q 2017 results that easily topped expectations and sent the shares soaring in after-market trading. Quickly reviewing the results, which have already been amply covered by the financial media but bear repeating as they set the tone for our conversation – Amazon delivered EPS of $0.52 vs. the consensus expectation of -$0.01 with revenue for the quarter coming in at $43.74 billion topping the expected $42.14 billion. Even backing out the $1.3 billion in revenue derived from Whole Foods, Amazon’s digital retail and Amazon Web Services (AWS) outpaced expectations. The clear driver of the upside was AWS as well as the 59% increase in its subscription services business that includes digital music, digital video, audiobooks, e-books.

As investors know, context and perspective are key and in this case, Amazon’s 3Q 2017 revenue tied its 4Q 2016 revenue, which included the 2016 holiday shopping season. Once again, the bulk of the company’s operating earnings were furnished by AWS, which we continue to see as the company’s key differentiator compared to other retailers and one of its platforms alongside its digital voice assistant Alexa that is helping it weave itself even deeper into consumer’s lives.

In Amazon tradition, the company issued rather wide guidance with revenue for the current quarter between $56-$60.5 billion, which is in line with consensus expectations and equates to a year over year increase of 28%-38%. In terms of operating income for the current quarter, Amazon shared its current view that is should fall in the range of $300 million to $1.65 billion and that compares to the $1.64 billion Wall Street was expecting and $1.3 billion earned in the year-ago quarter. Given the litany of 2017 holiday shopping forecasts that call for an acceleration in digital shopping growth rates, it’s rather likely that Amazon’s top line guidance will prove conservative… yet again.


Boosting our AMZN price target to $1,250

Heading into last night’s earnings report, our price target for AMZN shares was $1,150. Today, given several factors, including the accelerating pace of digital commerce, continued revenue growth and margin expansion at AWS and the burgeoning subscription revenue business, we are boosting our price target to $1,250. As we do this we are seeing other investment banks up their price targets and some that have been less enthusiastic on AMZN shares finally come around and upgrade the rating to a Buy or some equivalent. As we have said for some time, as consumers and business continue to migrate increasingly to online and mobile platforms Amazon shares are ones to own, not trade.


Culling through AMZN’s 3Q 2017 results

Digging into 3Q 2017 earnings report, Amazon rattled off more than 30 highlights which in sum point to its expanding footprint and effectively recapped a number of product and service announcements during the quarter. The real meat came in culling through the company’s income and business segment information for the quarter. In that, we see the real power behind AWS as it supplied nearly all of the company’s operating income in the quarter and just 10.5% of the quarter’s revenue. Again, we see this as the key differentiator that allows Amazon to fund its retail expansion efforts and better yet the business is on an $18 billion run rate exiting 3Q 2017, up from $13 billion coming out of 3Q 2016 and $16 billion for 2Q 2017. What this tells us is AWS continues to win share as more companies embrace the cloud, and as that occurs AWS’s margins continue to scale higher enabling Amazon to expand its geographic and service footprint.

To be fair, the North American retail business rose 35% year over year fueled in part by the ongoing shift to digital commerce that we increasingly talk about as Amazon’s service offering expands (more on that shortly) and a successful Prime Day 2017. This kept the North American business as the company’s largest, but these ongoing investments in warehouses, new services, and video content once again weighted on segment profits. Contrary to expectations, the North American segment was profitable during the quarter, but its operating margin did slip to 0.4% in 3Q 2017 vs. from roughly 1.4% in the year-ago quarter. Again, not unexpected given the number of investments Amazon continues to make so it can continue to expand its product and service offering, catering to customer wants, but better than expected. In the current stock market environment that is meaningful.

Turning to the International retail facing business, revenue rose 29% year over year to $13.7 billion, a hair shy of the $14 billion achieved in 4Q 2016 as it too benefitted from Prime Day 2017 as well as the debut of Prime in India last year. During the earnings call Amazon shared that in India, it had more Prime members join in India than in any other country in the first 12 months. Despite the amazing growth in the International business, there is no other way to say it other than this segment continues to be a drag on Amazon’s overall profit picture as its operating loss widened both sequentially and year over year. It’s being fueled by the same expansion efforts as Amazon looks to solidify its footprint outside the US by replicating the growing number of Prime services it has in the U.S. We see this as Amazon doing what it does – playing the long game, and while we will be patient with this business we will be sure to monitor its ongoing progress.


Amazon to unleash even more creative destruction

Above it was mentioned that Amazon continues to expand its footprint and in addition to its in sum stellar 3Q 2017 results, it was reported that Amazon is positioning to unleash its creative destruction forces on the pharmaceutical industry. Yesterday, the St. Louis Post-Dispatch reported: “Amazon has become a licensed pharmaceutical wholesaler in 12 states, with a pending application in a thirteenth.” Because , Amazon would also need to be licensed as a pharmacy in each state to which it shipped drugs we see this as signs that Amazon is making a move, with the next question being will it build its own capabilities or will it look to acquire a building block company like it did with Whole Foods and grocery? We’ll continue to watch this for what it means not only for Amazon’s balance sheet but more importantly its revenue and profit stream.

It was also quietly announced this week that “Amazon will soon allow customers in some areas to place orders for takeout food with local restaurants from inside the Amazon app.”


Initial observations of the Amazon-Whole Foods marraige

Initial observations of the Amazon-Whole Foods marraige

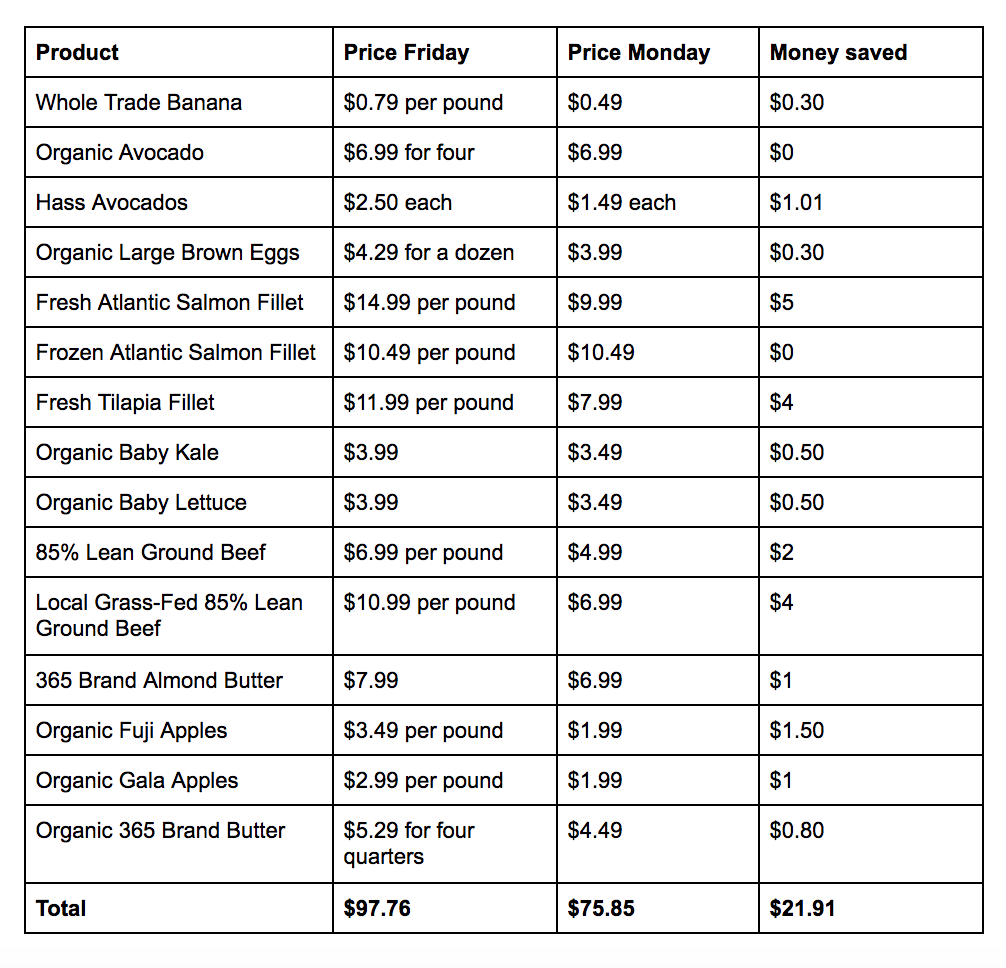
With the official closing of the Amazon (AMZN) acquisition of Whole Foods Market (WFM) yesterday, I made a point of visiting two locations near me outside of Washington, D.C. The traffic in the store was greater than usual for a Monday, as were the length of the lines at the checkout counters. There were a number of prices that were better as has been reported, and there was a pop-up stand for Amazon Echo devices.

What was missing, however, were the appropriate Amazon’s private label brands that are slated to hit shelves at Whole Foods locations, as well as the lockers that will allow for both delivery of items as well as returns.

I say appropriate items because Amazon has quietly expanded the scope of its private label products from food (Happy Belly, Mama Bear and Wickedly Prime) and supplements (Amazon Elements) to fashion, electronics, household items, cosmetics, lingerie, and furniture to name a several. Conversations with the store managers confirmed Amazon private label products will be turning over in the store “over time” where appropriate. That hasn’t slowed Amazon from including Whole Foods’ private label brand, 365 Everyday Value, on its website although based on some basic searching 365 Everyday Value has yet to be offered under Amazon Fresh.

Like many large acquisitions, integration and the targeted synergies come over time, and I are still in the very early days of these two companies being under one roof. I expect the rollout of Amazon private label products to be had at the 470 Whole Foods locations in the U.S. and the U.K. over the coming quarters with added benefits coming (Amazon Fresh, Amazon meal kits and the instillation of Amazon Prime as the new membership rewards program).

As the combined entity flexes its product and logistical offering, I suspect before too long the conversation will shift from “death of the mall” to “death of the grocery store.” One of the “secret weapons” that Amazon has over its grocery and other competitors that range from Kroger (KR) to Wal-Mart (WMT) is the high margin Amazon Web Services, which continues to be embraced by corporate America as it increasingly migrates to the cloud.

One thing I am pondering is based on the number of Whole Foods locations, will Amazon look to make other grocery acquisitions in a bid to reach key markets that have a high concentration of Amazon Prime customers? If so, this could quickly turn the conversation from “the death of the mall” to the “death of the grocery store.”


  • We continue to rate Amazon (AMZN) shares a Buy with a $1,150 price target.

Source: Whole Foods prices cheaper with Amazon – Business Insider

May Data From ADP and Challenger Offer Confirmation for Several Tematica Select List Positions

May Data From ADP and Challenger Offer Confirmation for Several Tematica Select List Positions

This morning we received the Challenger Job Cuts Report as well as ADP’s view on May job creation for the private sector. While ADP’s take that 253,000 jobs were created during the month, a nice boost from April and more in line with 1Q 2017 levels, we were reminded that all is not peachy keen with Challenger’s May findings. That report showed just under 52,000 jobs were cut during the month, a large step up from 36,600 in April, with the bulk of the increase due unsurprisingly to retail and auto companies.

As Challenger noted in the report, nearly 40% of the May layoffs were due to Ford (F), but the balance was wide across the retail landscape with big cuts at Macy’s (M), The Limited, Sears (SHLD), JC Penney (JCP) and Lowe’s (LOW) as well as others like Hhgregg and Wet Seal that have announced bankruptcy. In total, retailers continued to announce the most job cuts this year with just under 56,000 for the first five months of 2017. With yesterday’s news that Michael Kors (KORS) will shut 100 full-price retail locations over the next two years, we continue to see more pain ahead at the mall and fewer retail jobs to be had.

Sticking with the Challenger report, one of the items that jumped out to us was the call out that,

“Grocery stores are no longer immune from online shopping. Meal delivery services and Amazon are competing with traditional grocers, and Amazon announced it is opening its first ever brick-and mortar store in Seattle. Amazon Go, which mixes online technology and the in-store experience, is something to keep an eye on since it may potentially change the grocery store shopping experience considerably, “


In our view, this means the creative destruction that has plagued print media and retail brought on by Amazon (AMZN) is set to disrupt yet another industry, and it’s one of the reasons we’ve opted out of both grocery and retail stocks. The likely question on subscriber minds is what does this mean for our Amplify Snack Brands (BETR) position? In our view, we see little threat to Amplify’s business; if anything we see it’s mix of shipments skewing more toward online over time. Not a bad thing from a cost perspective. We’d also note that United Natural Foods (UNFI) is a partner with Amazon as well.

  • Our price target on Amazon (AMZN) remains $1,100 and offers more than 10% upside from current levels.
  • Amplify Snack Brands (BETR) has an $11 price target and is a Buy at current levels.
  • Our target on United Natual Foods (UNFI) is $65, and the recent pullback over the last six weeks enhances the long-term upside to be had.

We’d also note comments from Chipotle Mexican Grill (CMG) that its recent cybersecurity attack hit most Chipotle restaurants allowing hackers to steal credit card information from customers. In a recent blog post, Chipotle copped to the fact the malware that it was hit with infected cash registers, capturing information stored on the magnetic strip on credit cards. Chipotle said that “track data” sometimes includes the cardholder’s name, card number, expiration date and internal verification code. We see this as another reminder of the down side of what we call both our increasingly connected society and the shift toward cashless consumption. It also serves as a reminder of the long-tail demand associated with cyber security, and a nice confirmation point for the position PureFunds ISE Cyber Security ETF (HACK) shares on the Tematica Select List.

  • Our price target on PureFunds ISE Cyber Security ETF (HACK) shares remains $35.


Assessing the Market as We Get Ready for 1Q17 Earnings Deluge

Assessing the Market as We Get Ready for 1Q17 Earnings Deluge

Despite yesterday’s move higher in the stock market, March to date has seen the Dow Jones Industrial Average move modestly lower with a larger decline in the Russell 2000. Only the Nasdaq Composite Index has climbed higher in March, bringing its year to date return to more than 9 percent, making it the best performing index thus far in 2017. By comparison, the Dow is up 4.75 percent, the S&P 500 up 5.35 percent and the small-cap heavy Russell 2000 up just 0.75 percent year to date.

So what’s caused the move lower in the stock market during March, bucking the upward trend the market enjoyed since Election Day 2016?

Despite the favorable soft data like consumer confidence and sentiment readings, investors are waking to the growing disconnect between post-election expectations and the likely reality between domestic economic growth and earnings prospects. Fueling the realization is the move lower in 1Q 2017 earnings expectations for the S&P 500, per data from FactSet, as well as several snafus in Washington, including the pulling of the vote for the GOP healthcare plan. These have raised questions about the timing and impact of President Trump’s stimulative policies that include infrastructure spending and tax reform.

We’ve been steadfast in our view that the earliest Trump’s policies could possibly impact the US economy was late 2017, with a more dramatic impact in 2018. On a side note, we agree with others that would have preferred to have team Trump focus on infrastructure spending and tax reform ahead of the Affordable Care Act. As we see it, focusing on infrastructure spending combined with corporate tax reform first would have boosted confidence and sentiment while potentially waking the economy from its 1.6 to 2.6 percent annual real GDP range over the last five years sooner. We’d argue too that that would have likely added to Trump’s political war chest for when it came time to tackle the Affordable Care Act. Oh well.


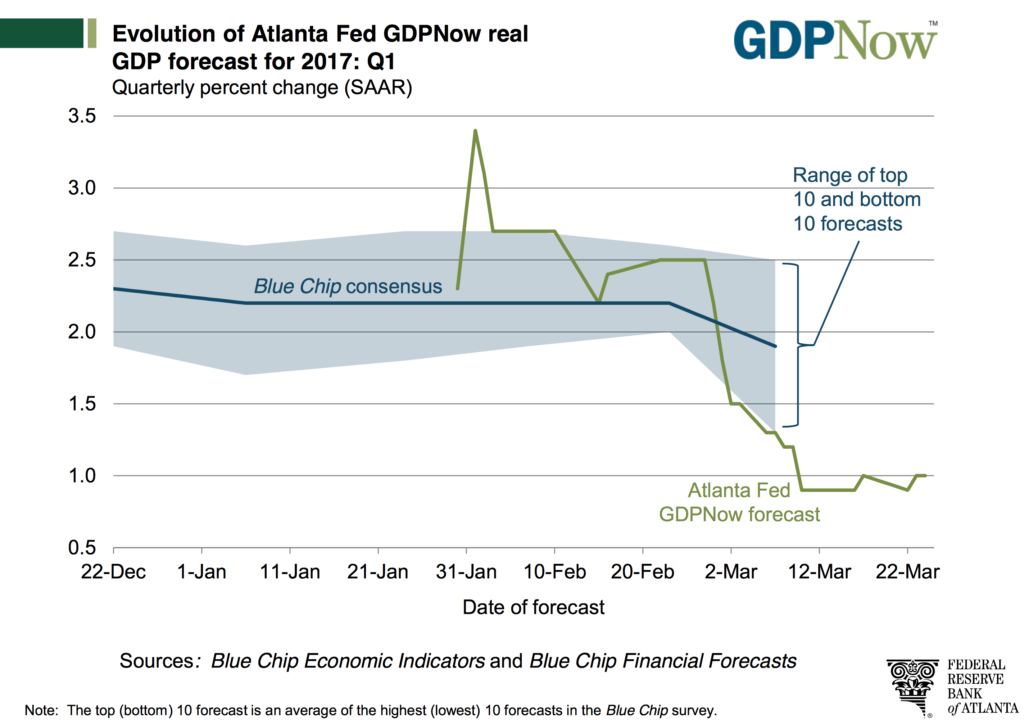
Evolution of Atlanta Fed GDPNow real GDP forecast for 2017: Q1


So here we are and the enthusiasm for the Trump Trade is being unraveled as growth slows once again. As depicted above, the most recent forecast for 1Q 2017 GDP from the AtlantaFed’s GDPNow sits at 1.0 percent compared to 1.9 percent for 4Q 2016 and 3.5 percent in 3Q 2016. Even a grade school student understands the slowing nature of that GDP trajectory. Despite all the upbeat confidence and sentiment indicators, the vector and velocity of GDP forecast revisions and push outs in the team Trump timing has led to to the downward move in S&P 500 EPS expectations for the current quarter and 2017 in full.

With Americans missing bank cards payments at the highest levels since July 2013, the delinquency rate for subprime auto loans hitting the highest level in at least seven years and real wage growth continuing to be elusive, the outlook for consumer spending looks questionable. Factor in the aging of the population, which will have additional implications, and it looks like the consumer-led US economy is facing more than a few headwinds to growth in the coming quarters. These same factors don’t bode very well for the already struggling brick & mortar retailers like Macy’s, Sears, JC Penney, Payless and others.

Now here’s the thing, currently, the S&P 500 is trading at 18x 2017 expectations —expectations that are more than likely to be revised down than up as the outlook for U.S. economic growth in the coming quarters is revisited. In three days, we close the books on 1Q 2017 and before too long it means we’ll be hip deep in corporate earnings reports. If what we’ve seen recently from Nike, FedEx, General Mills, Kroger and Target is the norm in the coming weeks, it means we’re more likely to see earnings expectations revised even lower for the coming year.

While it’s too early to say 2017 expectations will be revised as steeply as they were in 2016, (which started the year off with the expectation of a 7.6 percent increase year over year but ended with only a 0.5 percent increase following 4Q 2016 reporting), but any additional downward revisions will either serve to make the market even more expensive than it currently is or lead to a resumption of the recent downward move in the market. Either way, odds are there is a greater risk to the downside than the upside for the market in the coming weeks.

Buckle up; it’s bound to get a little bouncy.