WEEKLY ISSUE: Robust Earnings and March Retail Sales Bode Well for Select List

WEEKLY ISSUE: Robust Earnings and March Retail Sales Bode Well for Select List


Once again, the stock market has shrugged off moves in the geopolitical landscape and mixed economic data to start the week off higher. Not surprising as the highly anticipated 1Q 2018 earnings season has gotten underway and based on what we saw the last two days so far so good. For the record, we had 44 companies that reported better than expected top and bottom line results, a number of them high profile companies such Bank of America (BAC), Netflix (NFLX), Goldman Sachs (GS), Johnson & Johnson (JNJ), and CSX (CSX).

Like I said, so far so good, and while we’re getting some additional nice EPS beats this morning, we’re still very early on in the 1Q 2018 earnings season. Make no mistake, it’s encouraging, but we have a long way to go until we can size up 1Q 2018 earnings performance vs. the high bar of expectation that calls for roughly 18% EPS growth year over year for the S&P 500.

That’s why I’ll continue to parse the data — earnings and otherwise — as it comes through. Last week and this week, we’ll get more of that for March, and that means we can get a view on how those data streams performed in full for 1Q 2018. Case in point, on Monday we received the March Retail Sales Report, which on its face came in at 0.6%, better than expected, and excluding autos and food services the metric also 0.6% vs. February. That translated into a 4.7% increase for retail ex-auto and food services year over year for the month. Stepping back, the data found in Table 2of the report showed that line item rose 4.3% year over year for all of 1Q 2018.

With that information, we can size up which categories contained in the report gained wallet share and identify those that lost it. The two big winners for 1Q 2018 were gasoline stations, up 9.7%, which was no surprise given the rise in gas prices over the last three months, and Nonstore retailers, which also rose 9.7%. We see that data as very favorable for our Amazon (AMZN) shares and boding well for Costco Wholesale (COST) given its growing e-commerce business. Contrasting that figure against the -0.6% for department store sales in 1Q 2108 confirms the ongoing shift in how and where consumers are shopping. Not good news in our view for the likes of JC Penney (JCP) and other mall anchor tenants.

The hardest hit category during 1Q 2018 was Sporting Goods, hobby, book & music stores, which fell 4% year over year. Remember, we’re seeing these categories impacted as well by the shift to digital commerce, streaming services such as newly public Spotify (SPOT) and programs like Amazon’s Kindle Unlimited that looks to be the Netflix (NFLX) of books, audiobooks, and magazines. In my view, the other shoe to drop for this Retail Sales Report category is the Toys R Us bankruptcy that is poised to do to the toy industry what the Sports Authority bankruptcy and subsequent liquidation sales did to Under Armour (UAA), Nike (NKE) and Adidas among others. We’ll get a better picture on that when toy company Mattel (MAT) reports its quarterly results later this week.

I’d also call out that Clothing & Clothing Accessories store retail sales for 1Q 2018 rose just 3.0%, signaling slower growth than overall retail sales – a sign that consumers are spending their disposable dollars on other things or elsewhere. Over the last year, we’ve more than touched on the transformation that is underway with digital shopping, and we continue to see Amazon as extremely well positioned. Likely augmenting that Amazon has moved its Amazon Prime Wardrobe service, its “try before you buy offering,” from beta to launch.

Of course, it requires Prime membership and we see this service as helping drive incremental Prime subscriptions, especially as Amazon continues to improve its apparel offering, both private label and branded. Another headwind to clothing retailers looks to be had in Walmart’s (WMT) upcoming website overhaul that is being reported to have a “fashion destination” that will leverage its partnership with Lord & Taylor. With branded apparel companies looking to reach consumers, some with their own Direct 2 Consumer businesses and others by leveraging third party logistic infrastructure, we’ll keep tabs on Walmart’s progress and what it means for brick & mortar clothing sales. If you’re thinking this should keep our Buy rating on shares of United Parcel Service (UPS), you’re absolutely right.

The bottom line is the March Retail Sales report served to confirm our bullish view on both Connected Society companies Amazon and UPS as well as Cash-Strapped Consumer play Costco.

  • Our price target on Amazon remains $1,750
  • Given its strong monthly same-store sales data and ongoing wallet share gains as it opens additional warehouse locations, we are boosting our Costco Wholesale (COST) price target to $210 from $200
  • Our long-term price target on United Parcel Service (UPS) shares remains $130


Robust Earnings from Lam Research Bode Well for Applied Materials

Last night Applied Materials (AMAT) competitor Lam Research reported stellar 1Q 2018 earnings and issued an outlook that topped Wall Street expectations. For the quarter, shipments of its semiconductor capital equipment rose 19% year over year, which led revenue to climb more than 30% year over year for the quarter. Higher volumes and better pricing led to margin expansion and fueled a $0.43 per share earnings beat with EPS of $4.79. All in all, a very solid quarter for Lam, but also one that tell us demand for chip equipment remains strong. Those conditions led Lam to guide current quarter revenue to $2.95-$3.25 billion vs. the consensus view of $2.94 billion.

From growing memory demand, 5G chips sets, 3D sensing, smarter automobiles and homes, and augmented reality to virtual reality and the Internet of Things, we continue to see a number of emerging technologies that are part of our Disruptive Technologies investing theme driving incremental chip demand in the coming years that will fuel demand for semi-cap equipment. We see this as a very favorable tailwind for our Applied Materials shares. Also, let’s not forget Applied’s recently upsized dividend and buyback programs, which, in my view limits potential downside in the shares.

  • Our price target on shares of Applied Materials (AMAT) remains $70.


The Habit Restaurant – Loving the Burgers and Shakes, but Not the Shares Just Yet

People need to eat. That’s a pretty recognizable fact. Some may eat more than others, some may eat less; some may eat meat, others may not. But at the end of the day, we need food to survive, but in some cases for comfort at the end of a long day.

As investors, we recognize this and that means considering where and what consumers eat, and also identifying companies that are poised to benefit from other opportunities as well. One such opportunity is geographic expansion, and with restaurants, it often means expanding across the United States.

Typically, expansion is driven by new store openings, which in turn drive sales. Tracing back its expansion over the last several years, Chipotle Mexican Grill (CMG) had to build up to 2,363 locations. Even with that number of locations, per Chipotle’s recently filed 10-K, the company still expects to “open between 130 and 150 new restaurants in 2018.” At that pace, it would take quite a while before Chipotle had as many locations as McDonald’s (MCD) (more than 14,000) or Starbucks (SBUX) (just under 14,000) in the U.S. exiting last year.

A little over a year ago, Restaurant Brands (QSR), the company behind Tim Hortons and Burger King, acquired Popeye’s in part for food-related synergies but also the opportunity to grow Popeye’s through geographic expansion. In 2016, Popeye’s had some 2,600 locations compared to more than 7,500 Burger Kings in the U.S. For those wondering, that’s greater than the 2,251 locations Jack in the Box (JACK) had in 2017.

This brings us to  The Habit Restaurants (HABT), a Guilty Pleasure company if there ever was one.

With just 209 Habit Burger Grill fast-casual locations in 11 states spread between the two coasts, Habit has ample room to expand its concept serving flame char-grilled burgers and sandwiches, fries, salads and shakes. And if you’re wondering how good Habit is, don’t just listen to me (one of those 209 locations is just a few miles away from him), the company was named “best tasting burger in America” in July 2014.

In 2017, the company recorded revenue of $331.7 million from which it generated EPS of $0.16. For this year, consensus expectations have it serving up revenue near $393 million, up around 18% year over year, but EPS of $0.05 — a sharp drop from 2017.

What I’m seeing is Habit hitting an inflection point as it engages a national advertising agency, opens 30 new locations this year (7-10 in first-quarter 2018) and contends with higher wage costs (up 6%-7% vs. 2017), as well as test markets breakfast. Making matters challenging, the overall restaurant industry has been dealt a tough hand during the first two months of 2018 as winter weather and cold temperatures led to reduced traffic and same-store sales industry-wide, according to research firm TDn2K.

While a recent survey of March restaurant sales published by Baird showed a pick-up, the question I am pondering is to what degree will restaurant sales rebound on a sustained basis as the winter weather fades? I’m asking this question full well knowing the level of credit-card and other debt held by consumers as the Fed looks to hike interest rates several times this year.

Do I like the long-term potential of Habit?

Yes, and I would recommend their burgers, fries, and shakes – without question. That said, the company is not without its challenges, especially as McDonald’s begins to roll out its fresh beef offering nationwide. I had one of those a few days ago and in my view, it’s a clear step up from what Mickie D’s had been serving. You may be getting the idea that I like burgers, and I can easily confirm that as well as my fondness for chocolate shakes.

By most valuation metrics, HABT shares are cheap, but as we all know, cheap stocks are usually cheap for a reason. As such, we want to see how the company performed during the first quarter, the quarter in which the greatest number of new locations were to be opened. Typically, new locations drive up costs, and given the uptick in wage costs, this combination could weigh on the company’s bottom line.

All of this has us sitting on the sidelines with Habit Restaurants shares, which means adding them to Tematica Investing Contender List as part of our Guilty Pleasure investing theme.

WEEKLY ISSUE: Is Inflation Rearing Its Ugly Head or Not?

WEEKLY ISSUE: Is Inflation Rearing Its Ugly Head or Not?

Today is the day that we here at Tematica, and other investors as well, have been waiting for to make some semblance of the recent stock market volatility. Earlier this morning we received the January Consumer Price Index (CPI), one of the closely watched measures of that now dirty word – inflation. As a quick reminder, the market swings over the last two weeks were ignited by the headline wage data in the January Employment Report, as well as other signs, such as rising freight costs that led us to add shares of Paccar (PCAR) to the Tematica Investing Select List earlier this week. This topic of resetting inflation expectations and what it may mean for the Fed and interest rates has been a topic of conversation on recent Cocktail Investing Podcast between Tematica’s Chief Macro Strategist Lenore Hawkins and myself.


What the January CPI Report Showed and Its Impact on AMZN, COST and UPS

The headline figures from the January CPI report showed the CPI rose 0.5% month over month in January, which equates to a 2.1% increase year over year. Keeping in sync with the headline figure, which includes all categories, the consensus expectation was for a 0.3% month over month increase. The driver of the hotter than expected headline print was the energy index rose, which climbed 3.0% in January, and we’ve witnessed this first hand in the gasoline price jump of late. Excluding the volatile food and energy components, the “core” CPI index was up 0.3% month over month in January, coming in a bit ahead of the expected 0.2% increase. On a year over year basis, that core figure rose 1.8%, which is in keeping with the 1.7%-1.8% over the last eight months. Month over month gas and fuel prices were up 5.7% and 9.5%, respectively.

Late yesterday, the American Petroleum Institute released data showing a 3.9 million barrel increase in crude stockpiles for the week ended Feb. 9, along with a 4.6 million barrel rise in gasoline stocks and a 1.1 million barrel build in distillates. With crude inventories once again on the rise as US oil production has risen in response to the recent surge in oil prices from September to late January, we’ve seen oil prices retreat to December levels and odds there is more relief to come.

As we wait for others, who if you’ve seen the whipsaw in stock market futures today are simply reacting to the January headline CPI figure, to get some clearer heads about themselves and digest the internals of the report, I’ll share our thoughts on the January Retail Sales report that was also published this morning.

Staring with the headline figure, January Retail Sales came in at -0.3% month over month, falling short of the 0.2% consensus forecast. Excluding auto and food, January core retail sales fell 0.3% month over month; on a year over year basis, retail sales rose 3.9% with nonstore sales leading the way (up 10.2%) followed by gas stations sales (up 9.0% year over year), which is of little surprise given our January CPI conversation above. We do see that nonstore figure as further confirmation for not only our Amazon (AMZN) and United Parcel Service (UPS) shares, but also our Costco Wholesale (COST) ones as it continues to embrace our Connected Society theme.

  • Our price target on Amazon (AMZN) shares remains $1,750
  • Our price target on Costco Wholesale (COST) shares remains $200
  • See my comments below for my latest thoughts on UPS shares


Market’s Knee-Jerk Reaction to January Retail Sales Offered Opportunity in PCAR, Not BGFV

Despite the 3.9% year over year January Retail Sales print, the market is focusing on the month over month drop, which was one of the weakest prints in some time. Here’s the thing, we here at Tematica have been talking about the escalating level of debt that consumers have been taking on as a headwind to consumer spending and despite the post-holiday sales, consumers tend to ramp spending down after the holidays. Odds are these two factors led to that month over month decline, but even so up 3.9% year over year is good EXCEPT for the fact that gas station sales are bound to fall as gas prices decline.

If we look at these two reports, my take on it is a skittish stock market is once again knee-jerk reacting to the headline figures rather than understanding what is really going on. The initial reaction saw Dow stock market futures fall from +150 to -225 or so before rebounding to -125. As data digestion occurs, odds are concerns stoked by the initial reactions will fade as well

With market anxiety still running higher compared to this time last year or even just six months ago, I expect the market to cue off the major economic data points to be had in the coming weeks building to the Fed’s next FOMC meeting on March 20-21. As I pointed out on this week’s podcast, at that meeting we’ll get the Fed’s updated economic forecast and I expect that will have chins wagging over the prospects of three or four rate hikes to be had in 2018.

In the meantime, I’ll continue to look for opportunities like I saw with Paccar (PCAR) shares on Monday, and avoid pitfalls like the one I mentioned yesterday with Big Five Sporting Goods (BGFV). And for those wondering, per the January Retail Sales Report, sporting goods sales 7.1% in January. Ouch! And yes, I always love it when the data confirms my thesis.

  • Our price target on Paccar (PCAR) shares remains $85


Waiting on Applied Materials Earnings Announcement

After today’s market close, Applied Materials (AMAT) will share its latest quarterly results, and update its outlook. As crucial as those figures are, in recent weeks we’ve heard positive things from semi-cap competitors, which strongly suggests Applied should deliver yet another good quarter and a solid outlook. Buried inside those comments, we’ll get a better sense as to the vector and velocity for its products, both for chips as well as display equipment.

Those comments on the display business will also serve as an update for the currently capacity constrained organic light emitting diode market, one that we watch closely given the position in Universal Display (OLED) shares on the Tematica Investing Select List. I see this morning’s announcement by Universal that it successfully extended its agreement with Samsung though year-end 2022 with an optional 2-year extension as reminding investors of Universal’s position in the rapidly growing technology. With adoption poised to expand dramatically in 2018, 2019 and 2020, I continue to see OLED shares as a core Disruptive Technologies investment theme holding.

  • Our price target on Applied Materials (AMAT) shares remains $70
  • Our price target on Universal Display (OLED) shares remains $225


Should We Be Concerned About UPS Amid Amazon Announcement?

Several paragraphs above I mentioned United Parcel Service (UPS) shares, and as one might expect the headline reception to the January Retail Sales Report has them coming under further pressure this morning. That adds to the recent news that our own Amazon (AMZN) would be stepping up its business to business logistics offering and competing with both UPS and FedEx (FDX). Of course, this will take time to unfold, but these days the market shoots first and asks questions later. At the same time, we are entering into a seasonally slower time of year for UPS, and while yes consumers will continue to shift toward digital shopping as we saw in today’s retail sales report, the seasonal leverage to be had from the year-end holidays is now over.


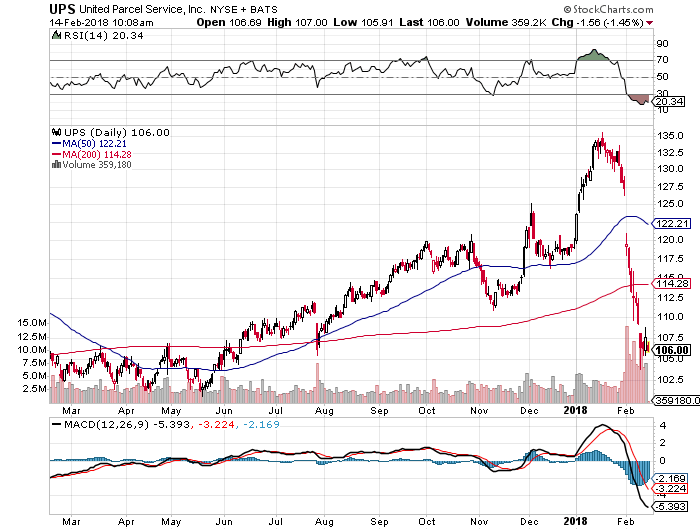
While it may sound like we are getting ready to give UPS shares the ol’ heave ho’, along with the February market gyrations, it’s been a quick ride to the $106 level from $130 for UPS shares, and this has placed them into the oversold category. From a share price perspective, the shares are back to levels last seen BEFORE both the 2017 Back to School and year-end holiday shopping seasons. With prospects for digital shopping to account for an even greater portion of consumer wallets in 2018 and 2019 vs. 2017, we’re going to be patient with UPS shares in the coming months as we wait for the next seasonal shopping surge to hit.

  • Our long-term price target on UPS shares remains $130.


Thematic Tailwinds and Headwinds Drive February Retail Sales 

Thematic Tailwinds and Headwinds Drive February Retail Sales 

This morning the US Department of Commerce published its February Retail Sales report, which was in line with expectations growing 0.1 percent compared to January. This report is always an interesting read due in part to the fact that we can look at the data a number of ways — month over month, year over year, and three-month comparisons on a trailing and year over year basis. As you can imagine, this can lead to quite a bit of confusion when trying to puzzle together exactly what the investing signal is coming out of that retail report noise.

Here’s our take on it featuring the thematic lens that we hang our hat at here at Tematica . . .

February 2017 vs. January 2017

Month over month retail sales climbed by 0.1 percent, in line with expectations. The four categories that saw faster spending growth than the average were furniture (+0.7 percent), building materials (+1.8 percent), health & personal care stores (+0.7 percent) and nonstore retailers (+1.2 percent). The sequential increase in building material demand, as well as furniture, fits with the mild winter weather that led to a pickup in construction employment and a stronger than seasonal pickup in housing starts.

The continued tick higher in health & personal care stores ties with our Aging of the Population investing theme. We continue to see this category rising faster than overall retail spending as the first baby boomers turn 70 this year with another 1.5 million each year for the next 15 years. The scary part is of these baby boomers, roughly only 50 percent have saved enough for retirement, which touches on our Cash Strapped Consumer investing theme.

Finally, we once again see Nonstore retailers taking consumer wallet share in February, which comes as no surprise as Amazon and other retailers continue to expand their service offerings and geographic footprints, while other traditional brick & mortar retailers focus on growing their direct to consumer business. In short, our Connected Society investing theme continues to transform retail.

Month over month weakness was had at electronics & appliance stores, clothing, and department stores. Compared to January gasoline station sales ticked down modestly as well, which we attribute to the essentially flat gasoline prices month over month per data from AAA.


February 2017 vs. February 2016

Year over year February Retail Sales excluding autos and food rose 5.9 percent led by a 19.6 percent increase in gasoline station sales, a 13.0 percent increase in Nonstore retail, a 7.3 percent rise in building materials, a 7.0 percent increase at health & personal care stores. Without question, the rise in gasoline station sales reflects the year over year 18 percent increase in gas prices per AAA data, while the milder winter we discussed earlier is likely pulling demand forward in construction and housing — we’ll look for February and March housing data to confirm this. The rise in gas prices reflects OPEC oil production cuts, which serves as a reminder that oil and other energy products are part of our Scarce Resource investing theme — there is only so much to be had, and production levels dictate supply.

As far as the year over year increase in health & personal care goes, it’s the same story — the Aging of the Population as Father Time is a tough customer to beat no matter how people embrace our Fountain of Youth investing theme. Finally, and certainly no surprise is the continued increase in Nonstore retail sales. Candidly, we see no slowdown in this Connected Society shift — all we need to do is look at the evolving shopping habits of the “younger” generation.

The two big declines were had were…. no surprise….. electronic & appliance stores, which fell 6 percent year over year, and department stores, which dropped 5.6 percent compared to February 2016.  With hhgregg (HGG) closing a good portion of its stores and JC Penney (JCP) recently announcing even more store closures, the results of these two categories, which are likely feeling the heat from Amazon (AMZN) in particular and others benefiting from the Connected Society tailwind, the results from these two categories is anything but surprising.

If we look at the three month rolling average on both a sequential and year over year basis, the leaders remained the same — building materials, gasoline stations, Nonstore retail and health & personal care. Behind each of these there is a clear thematic tailwind, even construction and housing, which is has historically been a beneficiary of the rising aspect of our Rise & Fall of the Middle Class investing theme. We’ll have a better sense of that with tomorrow’s February Housing Starts and Building Permits report.

And just in case anyone was holding out hope for electronics & appliance stores and department stores, the three-month rolling averages showed continued declines on both on a sequential and year over year basis. Nothing like a thematic headwind to throw cold water on your business.

The question to us is whether we will see more M&A chatter like we saw several weeks back with Macy’s (M) and more recently with Hudson Bay (TSE:HBC) being interested in Neiman Marcus. We can understand one company picking off well-positioned assets that might improve its overall customer mix, but we suspect there will be a number of companies left standing with no dance partners when this game of retail musical chairs is over. That means more companies going the way of Wet Seal than not, which means pain for mall REIT companies like Simon Property Group (SPG).

Before we go, we have to mention the piece by Tematica’s Chief Macro Strategist, better known on the Cocktail Investing Podcast as the High Priestess of Global Macro, Lenore Hawkins, which  called out the lack of weekly, year over year wage growth in February. Paired with higher prices, such as gas prices and others, that are leading to a pickup in reported inflation, it tells us our Cash-strapped Consumer investing theme has more room to go.

Hat tip to Lenore Hawkins, who added her special sauce and insights to this viewpoint. 

Note: Tematica’s subscription trading service, Tematica Pro, has a short position in SPG shares. 


January Retail Sales – Department Store Pain vs. E-tailing Gains

January Retail Sales – Department Store Pain vs. E-tailing Gains

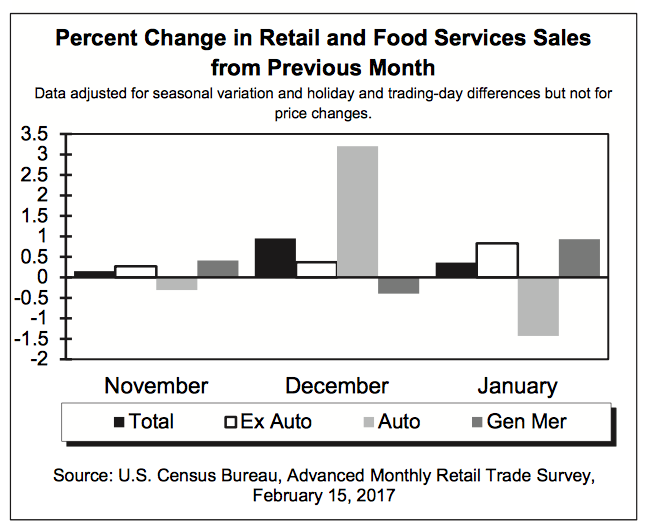
Earlier today the Census Bureau published its report on January Retail Sales, which topped expectations with a print of +0.4 percent vs. the expected 0.1 percent. Stripping out January Auto sales and food services, Retail sales +0.2 percent month over month. To us, the more telling figure was the 5.1 percent year over year increase in Retail only sales that was fueled by the 14.5 percent increase in Nonstore retailers, the +13.9 percent increase in gasoline station sales as well as strong showings from the Health & Personal Care stores categories and Building Material & Garden stores. Lackluster categories remained General Merchandise and Department Stores as well as Furniture and Electronics & Appliance stores.


Donning our thematic hats and looking at the January report, we find continued support for the accelerating shift toward digital commerce that sits at the core of our Connected Society investing theme and benefits companies like Amazon (AMZN) and Alphabet (GOOGL), both of which are on the Tematica Select List, and eBay as well as delivery companies such as United Parcel Service (UPS). To us there is no more telling statistic for that than the year over year comparison between Nov. 2015 – Jan. 2016 and Nov. 2016 – Jan. 2017. when Nonstore retail sales rose 12.7 percent vs. 4.6 percent for overall retail sales. Talk about a share gain!

We see the strong showing by Health & Personal Care stores as rather confirming for our Aging of the Population investment theme, while the continued pain felt at department stores comes as little surprise given the post-holiday shopping comments we’ve heard from Macy’s (M), Kohl’s (KSS), JC Penney (JCP) and others, which includes a number of location closures. That loss of anchor tenants alongside announced store closings ranging from The Limited to Wet Seal and others only supports our Death of the Mall view that poses a significant headwind to mall real-estate investor trust companies like Simon Property Group (SPG), Westfield Corp. (WFGPY) and Taubman Centers (TCO).

  • We continue to rate AMZN shares a Buy with a price target of $975
  • We continue to rate GOOGL shares a Buy with a $900 price target
January Retail Sales – Department Store Pain vs. E-tailing Gains

January Retail Sales – Department Store Pain vs. E-tailing Gains

Earlier today the Census Bureau published its report on January Retail Sales, which topped expectations with a print of +0.4 percent vs. the expected 0.1 percent. Stripping out January Auto sales and food services, Retail sales +0.2 percent month over month. To us, the more telling figure was the 5.1 percent year over year increase in Retail only sales that was fueled by the 14.5 percent increase in Nonstore retailers, the +13.9 percent increase in gasoline station sales as well as strong showings from the Health & Personal Care stores categories and Building Material & Garden stores. Lackluster categories remained General Merchandise and Department Stores as well as Furniture and Electronics & Appliance stores.

Donning our thematic hats and looking at the January report, we find continued support for the accelerating shift toward digital commerce that sits at the core of our Connected Society investing theme and benefits companies like Amazon (AMZN), a Tematica Select List holding, and eBay as well as delivery companies such as United Parcel Service (UPS). To us there is no more telling statistic for that than the year over year comparison between Nov. 2015 – Jan. 2016 and Nov. 2016 – Jan. 2017. when Nonstore retail sales rose 12.7 percent vs. 4.6 percent for overall retail sales. Talk about a share gain!

We see the strong showing by Health & Personal Care stores as rather confirming for our Aging of the Population investment theme, while the continued pain felt at department stores comes as little surprise given the post-holiday shopping comments we’ve heard from Macy’s (M), Kohl’s (KSS), JC Penney (JCP) and others, which includes a number of location closures. That loss of anchor tenants alongside announced store closings ranging from The Limited to Wet Seal and others only supports our Death of the Mall view that poses a significant headwind to mall real-estate investor trust companies like Simon Property Group (SPG), Westfield Corp. (WFGPY) and Taubman Centers (TCO).