Category Archives: Tematica Investing

Guilty Pleasures: the affordable treats that bring a moment of happiness

Guilty Pleasures: the affordable treats that bring a moment of happiness


There are several notions as to what constitutes a guilty pleasure. One definition is something one enjoys but would be embarrassed to have others know, while another is enjoying something even though it may not be held in high regard or may not be good for you. As one might expect there are a number of guilty pleasures to be had, ranging from certain films and TV programs (like the Bachelor, but we don’t judge), products ranging from tobacco, alcohol and marijuana to fast food, coffee and sugary treats as well as gambling and video games.

Some may label these as “vice” stocks, but that category tends to be limited to alcohol, gaming and tobacco and has a pejorative connotation vs. the little affordable treats and pleasures that bring a moment of enjoyment and happiness as well as much needed relief at certain times. By their nature, these guilty pleasures are ones that people will consume no matter the tone of the economic environment. In other words, they tend to be inelastic goods, and more often than not the companies behind them tend to be characterized as healthy cash flow generators and dividend payers.

These companies and brands differ from our Living the Life investing theme in that the pleasure derived is not a function of the premium price or image, but rather simply from the product or experience itself. Part of the joy of owning a Prada bag is having others see it whereas a guilty pleasure may be and often is, enjoyed in private.

In our view, Tematica’s Guilty Pleasure investing theme, like all of our other investing themes, cuts across several traditional Wall Street industry sectors, as the concept focuses on those companies that bring the kinds of products that consumers won’t do without, regardless of the economic climate. With that in mind, it should come as little surprise that the guilty pleasure group of stocks held up well during the last two recessions and performed even better on a relative basis when compared to several stock market indices. A 2009, report by Merrill Lynch that examined the performance of tobacco, alcohol, and casino stocks during all of the recessions since 1970 found that while the broad S&P 500 fell by 1.5% on average, guilty pleasure stocks rose on average 11%. During the great tech meltdown, the broad market fell 20% between June 2001 and June 2002, but during that time tobacco stocks gained 8% and gambling related stocks nearly 20%.

The inelastic nature of the products produced by these guilty pleasure companies has enabled them to weather price increases better than other products and services that are considered to be more of a commodity in nature. Perhaps the best example is in the tobacco industry. Consider that while the domestic tobacco business is in a decline as more people become aware of the health effects of smoking on their well-being and taxes are raised each year on cigarettes, price increases more than offset the decline in volume consumption by customers. Another example: despite the increasing concern over sugar as part of our diets, chocolate companies like Hershey Co., have been able to pass through price increases to offset any combination of higher raw material, fuel, utilities, and transportation costs.

When the price of key inputs of these guilty pleasure products, (such as commodities like coffee, beef, sugar, or cocoa) decline after a period of upward movement , the combination of lower input costs and prior price increases tends to deliver better margins, profit generation, EPS growth and cash flow. Think about it … when was the last time you saw the price of a beverage at Starbucks or the price for a package of Oreos decline? Demand for these products is such that rising costs are passed onto the consumer, but declining costs don’t result in much downward pricing pressure. Your wallet and your taste buds know what we’re talking about…


Altria: A Guilty Pleasure stock and a dividend dynamo as well

As mentioned above, tobacco is universally known to be harmful, yet people continue to smoke in one form or another. The US tobacco market saw a slight decline in volume sales and a slight increase in value sales in 2017 as Americans slowly continued to reduce their tobacco consumption, perhaps in part due to our Clean Living investment theme, while producers increased prices to maintain profits.

Big Tobacco has long been under threat from the steady decline of smoking, particularly in the developed world. But in recent years, the industry has been able to push through price increases to make up for falling volumes — boosting both their profits and stock prices. Those profits and cash flow have allowed tobacco companies to invest in smoking alternatives (e-cigarettes, vape pens and other devices) that deliver nicotine without as many of the harmful effects that come with lighting up as well as return capital to shareholders in the form of share repurchases and increasing dividends.

One such stock that falls into that grouping is Altria (MO), which is best known for cigarettes (primarily the Marlboro brand that has 43% market share in the US) and smokeless tobacco products (Copenhagen, Skoal, Red Seal, and Husky brands) and to a lesser extent wine under the brands Chateau Ste. Michelle, Columbia Crest, and 14 Hands. In the US, Altria has commanded 50%-51% of the cigarette market over the last year, and while primarily known for that product category, in cigars, the company has a 26% share with its large machine-made Black & Mild brand. In smokeless products, it has 55% share with the Copenhagen (32%) and Skoal (19%) brands.

Digging into Altria’s financials, roughly 85% of its revenue and profits are drawn from the smokeable products business, with smokeless accounting for 11% of sales and growing, and 14% of its operating profit. What that tells us is the smokeless products are a higher margin business for the company, thus a continued shift toward that product line bodes well for Altria’s profits and cashflow. Rounding out the revenue and profit mix at just under 4% and 1%, respectively, is the company’s wine business. What that business mix analysis tells us is even though we may hear some talk of the non-smokeable product potential, at least in the near-term, Altria is a smokeable product company.

That means we can expect additional tobacco taxes and further cigarette price hikes. As we’ve seen in the past, that should translate into rising profits, continued share buybacks and dividend increases. Current consensus estimates have Altria achieving EPS of $4.35 in 2019, up from $4.05 this year and $3.39 in 2017. Helping those EPS comparisons, during the June 2018 quarter, Altria repurchased 7.6 million shares at an average price of $57.65 and exiting that quarter, Altria had slightly more than $1 billion remaining in the current $2 billion share repurchase program. Management signaled it expects to complete that program by the end of the second quarter of 2019. As simple math shows us, shrinking share counts do wonders for EPS and their comparisons.

In terms of dividends, Altria recently announced it was boosting its quarterly dividend by 14% to $0.80 per share from the prior $0.70 per share – offering up a dividend yield of just over 5.4%. That marked the 53rd increase in the company’s dividend since 1968, which qualifies the company as a dividend dynamo company – one that increases its dividend year in, year out. That increase tends to lead to a step function higher in the share price overtime, something we’ve witnessed time and time again with Tematica Select List resident McCormick & Co. (MKC). With Altria, this latest dividend increase puts its annual 2018 dividend at $3.00, up from $2.00 in 2014.

If we look at other Guilty Pleasure stocks such as Hershey (HSY), Molson Coors (TAP), Constellation Brands (STZ) and your choice of a gaming company, the dividend yield range is 1.7% to 2.9%. If Altria shares traded in that dividend yield band, it would result in a share price well north of $100. Historically Altria shares have traded in the average dividend yield range of 3.74% to 4.8% over the last several years, which would suggest upside to $81 and downside to $63, which is well above the current share price.

Even after this latest quarterly dividend increase, Altria’s dividend payout remains close to 73% based on expected EPS of $4.35 in 2019 (vs. $3.39 in 2017) leaving ample room for additional dividend increases in the coming years. For example, if Altria kept its dividend payout ratio intact and achieved expected 2020 EPS of $4.70, it could mean a quarterly dividend of more than $0.85 per share. That would imply a potential annual dividend in the range of $3.30-$3.40, and further upside to be had in MO shares over the coming several quarters.

That’s a Guilty Pleasure company worth holding onto, especially if it manages to further transform its business from a tobacco centric one to something more evenly divided between smokeable and smokeless products. There is also the likely prospect of Altria entering the cannabis space as the legal status of marijuana continues to expand in the US. In many ways that move is a natural extension of its existing skill set – tobacco growth, processing, packaging and distribution – and it fits with the guilty pleasure framework of Altria’s business focus.

  • We are issuing a Buy on the shares of Altria (MO) and adding them to the Tematica Investing Select List with an $81 price target.


Companies riding the Guilty Pleasure Tailwind

  • ALTRIA (MO)
  • ANHEUSER-BUSCH (BUD)
  • BRITISH TOBACCO (BTI)
  • BROWN-FORMAN (BF.B
  • CAESAR’S ENTERTAINMENT (CZR)
  • CONSTELLATION BRANDS (STZ)
  • CRAFT BREW ALLIANCE (BREW)
  • DIAGEO PLC (DEO)
  • DOMINO’S (DPZ)
  • DUNKIN BRANDS (DNKN)
  • HERSHEY COMPANY (HSY)
  • L BRANDS (LB)
  • LAS VEGAS SANDS (LVS)
  • MCDONALD’S (MCD)
  • MELCO RESORTS AND ENTERTAINMENT (MLCO)
  • MGM RESORTS (MGM)
  • MOLSON COORS (TAP)
  • PEPSICO (PEP)
  • SHAKE SHACK (SHAK)
  • STARBUCKS (SBUX)


Breaking down the ISM Manufacturing Report plus Paccar and Costco updates

Breaking down the ISM Manufacturing Report plus Paccar and Costco updates

Key points inside this issue

  • While the August ISM Manufacturing Report shows an improving economy, it also confirms inflation is percolating as well.
  • An earnings beat and robust outlook at heavy truck and engine company Navistar (NAV), keeps us bullish on Paccar (PCAR). Our PCAR price target remains $85.
  • Our price target on Costco Wholesale (COST) shares remains $230 heading into the company’s same-store-sales report after tonight’s market close.

This week we started to get our first firm look at the domestic economy for the month of August. The first piece of data was the ISM Manufacturing Index for August, which came in at 61.3, the highest reading in the last 12 months and a sequential improvement from 58.1 in July. In pulling back the covers on the index’s components, we find the forward-looking components – net orders and the backlog of orders – move up nicely month over month suggesting the manufacturing economy will continue to grow this month. The same, however, can be said for the Price component, which registered 72.1 for August. While down from July’s 73.2 figure, sixteen of the surveyed 18 industries reported paying increased prices for raw materials in August. With the August Prices reading well above the expansion vs. contraction line that is 50, the modest tick down in that sub-index does little to suggest the FOMC won’t boost interest when it meets later this month.

With regard to the report and the current trade wars, new export orders in August ticked lower to 55.2, down a meager 0.1 month over month. We’ll continue to monitor this and related data to assess the actual impact of the current trade wars for as long as they are occurring. As a reminder, by the end of this week, the US could impose tariffs on roughly half of all Chinese goods entering the country. Estimates put that figure at $200 billion, a step up from the $34 billion that had tariffs placed on them in July and the additional $16 billion last month. Should this latest round of tariffs go into effect, odds are we will see China follow suit with another round of its own tariff increases on US goods.

Drilling into the employment component of the ISM Manufacturing Report, it jumped to 58.5 in August, up from 56.5 in July. Given the historical relationship between this component and the Bureau of Labor Statistics (BLS) Employment Report – a reading in the ISM employment index above 50.8 percent, is generally consistent with an increase in the (BLS) data on manufacturing employment – odds are Friday’s Employment Report could surprise to the upside. To us, the real figure to watch inside that report, however, will be average hourly earnings to see how it stacks up against the data pointing to mounting inflation to be had in the economy. As we’ve said before, if wage growth lags relative to that data, it could put the brakes on the robust consumer spending we’ve seen in recent months.


An update on Paccar and a reminder on Costco Wholesale

Turning to the portfolio, this morning heavy truck and engine company Navistar (NAV) reported better than expected quarterly earnings due to continued strength in the heavy truck market. We see that as well as Navistar’s upsized heavy truck industry delivery forecast to 260,000-280,000 from the prior 250,000-280,000 as a positive for our Paccar (PCAR) shares. The same can be said from the recent July report on truck tonnage released by the American Trucking Association that showed an 8.6% year over year increase for the month, sequentially stronger than the 7.7% increase in June. The activity had with that ATA report suggest not only a pick up in the domestic economy, but the pain point of the current truck shortage continues to be felt, which bodes well for continued new order flow.

  • Our price target on Paccar (PCAR) shares remains $85.

After tonight’s close, Costco Wholesale (COST) will report its August same-store-sales figures, which we expect will continue the recent string of favorable reports. We’ll also be looking for an update on the number of open warehouses, a leading indicator for its high margin membership fee revenue stream. Based on the report, we will look to revisit our current $230 price target on COST shares.

  • Our price target on Costco Wholesale (COST) shares remains $230 for now.


Weekly Issue: Luxury Goods Are No Longer Scarce

Weekly Issue: Luxury Goods Are No Longer Scarce

Key Points from This Week’s Issue:

  • LVMH Moët Hennessy Louis Vuitton S.E. is the obvious way to gain exposure to our Living the Life investment theme; however the lack of liquidity in the shares has us take a pass. 
  • Instead, we are issuing a Buy on the shares of Del Frisco’s Restaurant Group (DFRG) and adding them to the Tematica Investing Select List with a $14 price target. 


Global Demand for Luxury Goods Is Exploding, Giving Rise to Our Living the Life Investment Theme

When we think of the term “living the life” we tend to think of an existence filled with joy, personal satisfaction and the ability to live life to the fullest, which usually implies the finer things in life be it food and drink, travel and hospitality, automobiles, clothing and other personal goods. The word “luxury” originates from the Latin word “Luxus,” which means indulgence of the senses, regardless of cost. Premium to luxury products and services are defined by McKinsey & Co. as ones that have “constantly been able to justify a significantly higher price than the price of products with comparable tangible functions.” The Boston Consulting Group (BCG), meanwhile, defines luxury goods as “items, products and services that deliver higher levels of quality, taste and aspiration than conventional ones.” Between those two definitions are luxury brands like Louis Vuitton, Tiffany, Hermès, Gucci, Ferrari, Prada, Porsche, Rolex and Burberry.

Tematica’s Living the Life investing theme looks to capture the global spending on higher-end affordable luxury as well as luxury branded goods and services that from an economic perspective have a high-income elasticity of demand. As people become wealthier, which we are seeing with the Rise of the Middle Class across many emerging economies, especially China, they will buy more luxury goods.

According to data published by Deloitte, the luxury market reached annual sales of $1 trillion at the end of 2017, of which more than 80% was comprised of luxury cars, luxury hospitality and personal luxury goods. In 2017, the core of the luxury market remained the personal goods category with apparel, beauty and handbags still account for the bulk of the market with shoes, jewelry and handbags ranked as the three fastest-growing product categories for the year.

Data collected by consulting firm Capgemini and published in its World Wealth Report 2018 showed the combined wealth of the world’s millionaires rose for a sixth straight year in 2017, topping $70 trillion for the first time ever due to an improving global economy and strong stock market performance. The number of high net worth individuals (HNWI) — which Capgemini defines as those having investable assets of $1 million or more (excluding primary residence, collectibles, consumables and consumer durables) —  reached 18.1 million in 2017, up almost 10% year over year. The four largest geographic markets for millionaires, accounting for 61% of the world’s high net worth individuals, were the US, Japan, Germany and China.


China: the driving force of luxury goods spending

One of the demonstrative forces that is driving and shaping the luxury market is the increasing wealth of Chinese consumers. Our Living the Life investing theme isn’t the only one benefitting from the improving economics or shifting demographics in China. While our Rise of the New Middle Class and our Aging of the Population investing themes are also taking cues from China, our Living the Life investing theme focuses on the explosive growth to be had in China high net worth individuals (HNWIs) and their impact on the demand for luxury goods and services. As you’ll see in the coming paragraphs, luxury goods companies have already recognized that opportunity and positioned their businesses accordingly.

From 2008 to 2014, the number of Chinese households purchasing luxury products doubled, fueled by growing incomes and greater access to luxury goods. Since 2015, the primary driver of increases in luxury spending has shifted from consumers making their first purchases of luxury goods to incremental spending from existing luxury consumers.

In 2016, it’s estimated that 7.6 million Chinese households purchased luxury goods. That number represents less than 2% of total households in China but is more than the total number of households in Malaysia or in the Netherlands. Each of these 7.6 million households spent twice as much as French or Italian households, leaving Chinese luxury consumers to account for almost a third of the global luxury market.

In 2008, wealthy Chinese represented only a third of Chinese luxury consumers; in 2017 they represented half of the shoppers in this category and account for 88% of Chinese luxury spend. With the number of Chinese millionaires expected to surpass that of any other nation in the coming years, according to Gartner, by 2024 Chinese consumers are expected to make up 40% of all luxury spending.

According to Gartner the top luxury brands in China today include Cartier, BVLGARI, Louis Vuitton, Coach, Gucci, Burberry, Mont Blanc, Valentino, Swarovski and Chow Tai Fook.

According to Hurun’s The Chinese Luxury Traveler 2017 report, enthusiasm for overseas travel shows no signs of abating, with the proportion of time spent on overseas tourism among luxury travelers rising 5% to become 70% of the total. Cosmetics, (45%), local specialties (43%), luggage (39%), clothing and accessories (37%) and jewelry (34%) remain the most sought-after items among luxury travelers. High domestic import duties and concerns about fake products both contribute to the popularity of shopping abroad. These high-end travelers prefer top class hotel accommodations such as The Ritz-Carlton, Banyan Tree, the Four Seasons, Mandarin Oriental, the Fairmont and the Peninsula.

During this past June 2018 earnings season, brands including Kering’s Gucci to Britain’s Burberry and French luxury handbag-maker Hermes all reported resilient demand from Chinese shoppers during the quarter, even as escalating China-U.S. trade tensions took hold. One of the factors that helped buoy demand was the reduction in import duties on certain goods that led brands such as  Gucci, Hermès and others to trim prices, thereby closing the price gap between the US and China.
 

Examining LVMH Moët Hennessy Louis Vuitton S.E. shares

An example of a well-positioned company for the Living the Life investing theme is LVMH Moët Hennessy Louis Vuitton S.E. (LVMHF) and its collection of 70 premium brands that span wine and spirits (10% of sales), Fashion and Leather Goods (39%), Perfumes and Cosmetics (13%), Watches and Jewelry (9%), and Selective Retailing (29%). The Selective Retailing component of LVHHF is comprised of retail aimed at international travel customers through LVMH’s ownership of Hong Kong based DFS, a leading luxury traveler retail and its network of duty free stores 11 major global airports and 20 downtown T Galleria locations, as well as affiliate and resort locations; its ownership in Miami Cruiseline, the leading provider of duty-free retail shops to the cruise ship industry; and select retail with Sephora SA and Le Bon Marché in Paris. Recognizable brands that all fall under the LVMH corporate umbrella include Dom Perignon, Hennessey, Moët & Chandon, Louis Vuitton, Fendi, Christian Dior, Aqua Di Parma, Guerlain, Kenzo Parfumes, BVLGARI, Tag Heuer and Chaumet.

In examining LVMH’s business portfolio, it’s one that tackles numerous aspects of the luxury goods industry, and its geographic position bodes well for continued success. In 2016, 25% of the company’s revenue was derived from Asia excluding Japan, and as the influence of the increasingly wealthy Chinese population that exposure rose to 31% in the June 2018 quarter. That geographic mix shift came primarily at the expense of LVMH’s US business, which slipped to 23% of revenue exiting the June quarter vs. 27% in 2016. That shift was hardly surprising given the emphasis on the company’s Asian store network that hit 1,195 locations halfway through 2018 vs. 991 in 2016, and now accounts for 27% of its overall store footprint. As one might suspect, that makes Asia LVMH’s largest market for its Wine and Spirits, Fashion and Leather Goods, Perfumes and Cosmetics, and Watches and Jewelry business units.

That emphasis on China is paying off for LVMH as its sales and profits in the first half of 2018 rose more than 10% year over year before adjusting for currency, led by its Fashion and Leather Goods business that climbed nearly 25% year over year. All of the other segments generated positive reported sales growth save for Wines & Spirits, which was flat on a reported basis as strong volume demand in Asia, particularly China, was offset by exchange rate fluctuations.

From a profit generation perspective, the two businesses we as investors should focus on when it comes to LVHM are its Fashion and Leather Goods (58% of profits) and Wines & Spirits (15%). Not only are these the two largest profit generators that contribute the bulk of LVMH’s earnings, they are also the higher margin businesses at roughly 32% of sales vs. the corporate average near 22%. As these two business lines go, so goes LVMH’s profit stream and its stock price. Margin improvement across all of its businesses, combined with its more than 10% top line increase, led company profits to climb more than 25% in the first half of 2018.

As one might expect, both the luxury goods industry and LVMH’s business are seasonal in nature owing to the heavy gift-giving season and holidays that span from the December quarter into the March quarter, owing to the growing influence of Chinese New Year which typically falls around either late January or February. As one might suspect it means a disproportional amount of revenue and profits for LVMH come during the second half of the year. In 2017, 68% of the company’s revenue and 69% of its profits were delivered in the second half of the year.

As we once again head into that holiday and shopping filled season, LVMH’s portfolio and geographic positioning have it well positioned to capture the growth in luxury goods spending. The continued focus on cost containment and the benefit of select price increases, with a more favorable mix of product bode well for LVMH’s profit growth to outpace that for its top line. It’s hard to argue with a well-positioned company that is delivering positive operating leverage.

Year to date, LVMHF shares have had a strong run, up some 24%, and are up nearly 150% since the beginning of 2016, but there is more upside to be had as the growing impact of the increasingly wealthy Chinese consumer is felt and as the company continues to grow its bottom line and dividend payments. By 2020, consensus expectations call for LVMH to deliver EPS of €14.90, up from €10.20 in 2017, with its dividend per share hitting €6.93 compared to €5.00 in 2017.

As alluring as LVMH’s business may be to investors, following the strong move in the share price, the shares are currently trading at the upper end of their historical P/E multiple and dividend yield ranges. From a risk to reward profile, while upside to the $420 level in LVMHF shares is likely, the downside risk to $320 doesn’t offer enough net upside to warrant getting involved at current levels. A more favorable entry point for the shares would be below $345.

The other item we must consider with LVMHF shares is the lack of liquidity. Fortunately, LVMH also has a US-listed ADR in LVMUY shares, which while not the most liquid stock it’s far, far better compared to LVMHF shares. In adjusting the above analysis for LVMUY shares, the net upside to downside tradeoff based on historical multiples would be 5%. Also in keeping with the comments above, a preferred entry point for LVMUY shares would be below $69, which offers more than 20% upside to the implied $84 price target.


Del Frisco shares offer a tasty Living the Life offering

Now let’s turn to Del Frisco’s Restaurant Group (DFRG), and if you’ve had the pleasure of eating there, you’ll recognize it’s a high-end experience with a bill to match. Quite a different business model compared to the recently exited Habit Restaurant (HABT) shares that netted more than an 80% return for the Tematica Investing Select List. Also unlike Habit shares that are now trading north of 270x expected 2019 EPS, Del Frisco shares are currently trading at just over 21x expected 2019 EPS of $0.44 and less than 1.0 on a 2019 enterprise value to sales basis).

While best known for its Del Frisco’s Double Eagle Steak House, the company’s portfolio also includes Sullivan’s Steakhouse, Del Frisco’s Grille, Barcelona Wine Bar, and bartaco that emphasizes steaks, chops, fresh seafood, tapas, street food, and wines and cocktails. In full the company operates 84 restaurants in 24 states and as one might expect for a company known for its steakhouse, it has a location in DC for those power dining folks. By comparison, Del Frisco’s is a far smaller restaurant footprint than its competition that includes Bloomin Brands’ (BLMN) Fleming’s Prime Steakhouse and Wine Bar, Darden’s (DRI) The Capital Grille, Smith & Wollensky, The Palm, Ruth’s Chris Steak House (RUTH) and Morton’s The Steakhouse. All pricey experiences that fit the mold of Tematica’s Living the Life investing theme.

When examining these kinds of companies, we have to keep a close watch on their cost structure and one of those key areas is food cost. In the case of these establishments that serve steaks, chops and other higher-end fare, Del Frisco’s it means beef, pork and chicken prices. The most recent data from the Livestock Monitor shows cattle and hog slaughter levels are higher year over year in aggregate, which has led to higher production levels and lower prices. We’ve seen the benefit of falling commodity prices in the past and what it means for margins, and as alluded to above Starbucks (SBUX) was a great example of margin expansion during periods of falling coffee prices. When Ruth’s Hospitality reported its quarterly results in offered some confirming comments:

“Food and beverage costs as a percentage of restaurant sales decreased 180 basis points year over year to 28.1%. This decrease was primarily driven by a 10% decrease in total beef costs as well as by 1.4% increase in average checks. Last summer, beef prices were driven to record high levels due to increased retail demand for prime beef. This year, we have not experienced increased retail demand, and as a result, we now expect full-year beef deflation of 1% to 4%. We currently expect this deflation to be the highest in the third quarter before returning to more normal levels in the fourth quarter.”

This wind up of this beef deflation led Ruth’s Hospitality to reduce its costs of goods sold to 28% to 30% of restaurant sales from its prior guidance of 29%-31%. We see that as a positive for the peer group, and especially for Del Frisco’s high margin Double Eagle business, which is also its largest revenue generator (roughly 48% of company revenue).

In examining Del Frisco’s shares, there is visible upside to $14 price target (roughly 32x 2019 EPS, but roughly 1.0 on a 2019 enterprise value to sales basis) vs. the 52-week bottom near $8. From risk-to-reward perspective, that equates to 45% upside as we head into the seasonally strong part of the year with falling beef prices vs. downside of 20%. Odds are that downside level is somewhat higher than $8 given the seasonal strength and falling beef prices, but nonetheless, the current risk-reward in the shares offers net upside of roughly 25%. That has us adding DGRG shares to the Tematica Investing Select List with a Buy rating. Should DFRG shares move lower, we’d look to scale into the position below $9 aggressively provided our thesis on the shares remains intact.

As we do this, it’s worth noting the company is pursuing strategic alternatives for its Sullivan’s Steakhouse business and has shared it has received “several bids from interested parties to purchase the concept and continue to engage in discussions.” A sale of this business which was its lowest margin business during the first half of 2018 would leave a stronger business mix and add cash to the company’s coffers. In my opinion, it also makes for a cleaner takeout story of the remaining Del Frisco’s business by a larger entity such as Bloomin Brands, Darden or privately held Landry’s that own Morton’s Steakhouse.

In terms of catalysts to watch, Darden will report its quarterly earnings on Sept. 20 and we’ll be looking for confirmation in beef deflation as well as improving restaurant traffic sales and margins, particularly at its Capital Grille business.

  • We are issuing a Buy on the shares of Del Frisco’s Restaurant Group (DFRG) and adding them to the Tematica Investing Select List with a $14 price target. 


Companies riding the Living the Life Tailwind

  • American Express (AXP)
  • Burberry Group (BURBY)
  • Constellation Brands (STZ)
  • Coty (COTY)
  • Diageo plc (DEO)
  • Estēe Lauder Companies (EL)
  • Ferrari NV(RACE)
  • Inter Parfums (IPAR)
  • Hermès (HESAY)
  • Ruth’s Hospitality (RUTH)
  • Prada S.p.A (PRDSY)
  • Tapestry (TPR)
  • Tiffany & Co. (TIF)
  • Volkswagen (VLKAY)


Adding Clean Living Play Chipotle Mexican Grill to the Select List

Adding Clean Living Play Chipotle Mexican Grill to the Select List


I’ve been keeping a close watch on the shares of Chipotle Mexican Grill (CMG) since we removed them from the Tematica Investing Select List in mid-2016. The company was previously part of what we now refer to as our Clean Living investment theme given its use of fresh, high-quality raw ingredients including meats that are raised without the use of non-therapeutic antibiotics or added hormones and none of the ingredients in the food (excluding beverages) in U.S. restaurants contain genetically modified organisms (GMOs).

The company was removed from the Tematica Select List back in 2016 when the share price dropped below our $390 stop-loss at the time.  Over the last 26 months, CMG shares fell to a low of $263 in November 2017 then rallied back to a recent high of just under $531. To refresh memories, Chipotle was once a darling of Wall Street as consumers flocked to eat its fast-casual Mexican fair that emphasized “food with integrity,” but its shares and management came under pressure following several outbreaks of foodborne illness that left diners ill and sent traffic, sales and shares plummeting in 2017. It appeared a recovery was underway until another outbreak occurred in mid-2017, once again hitting sales and the shares. This continued flow of bad headlines and whipsawing in the share price has kept us on the sidelines.

Management announced it would step down in November 2017 and in March 2018 Brian Niccol, the then CEO of Taco Bell, took over the Chipotle reigns. While Taco Bell may not be the poster child for refined cuisine, under Niccol’s watch Taco Bell same-store sales had grown an average of 4% a year at a time when the restaurant industry was experiencing a challenging environment as consumer preferences shifted toward healthier foods, snacks and beverages.

Investors loved the idea as the news of Niccol’s appointment started CMG shares on their current rebound. Niccol and his team quickly went to work on basic blocking and tackling, which led to declining guest complaints and improving guest satisfaction scores as shared on the June 2018 quarterly earnings call. Also on that call, following his first full quarter at the helm, Niccol shared his strategic plan for the company. It centered on four key areas: menu innovation, updated marketing, the introduction of a loyalty program, and a greater emphasis on digital sales.

That plan is already being put into action with the testing of several potential new menu items at its test kitchen in New York, including quesadillas, nachos, chocolate milkshakes (which personally perked up my ears), avocado tostadas, and a new salad. Once the company has confirmed these and other new test products meet consumer taste preferences and operational hurdles they will go national, a process that could take 18 to 36 months. Niccol also talked about overhauling the company’s marketing strategy, including more on TV spots and an overall campaign that is more  “engaging and lighthearted.” We’ll wait and see what this looks like before commenting, but historically Chipotle has shunned advertising and while this could weigh on margins in the coming quarters, it could help reinvigorate the company’s brand. Again, more on that in the coming months.

Coming later this year, Chipotle will test its loyalty program with the expectation of rolling it out in full force during 2019. We’ve seen the success of other loyalty programs, most notably at Starbucks (SBUX), and I am cautiously optimistic. As it is looking to improve its digital sales, the company has made some changes to its mobile app and recently added delivery at 1,800 of its locations via DoorDash through its app and website. By the end of 2019, customers “will be able to order delivery from within the Chipotle app in most locations.” We’ve seen the success of delivery at former Select List holding Habit Restaurant (HABT), and recognize it tends to come with premium pricing – a positive for Chipotle.

Rather than drink the new CEO’s Kool-Aid, let’s remember there is more work to be done with management’s “Big Fix” initiative, but as we have seen before, as the turnaround momentum begins to build, the benefits begin to kick in. As traffic rebounds, the company should see volume benefits paired with prior pricing actions improve the bottom line. Given the nature of its business, I will keep watch on trends in beef, pork and chicken, as well as other key ingredients such as avocados, and the potential benefit or hindrance to margins and EPS.

When examining CMG shares, I can see upside to at least $550, which equates to 45x expected earnings near $12 in 2019, up significantly from $6.60 in 2017. While that P/E figure is rich, it has the shares trading at a PEG ratio of roughly 1x. The 2019 EPS figure bakes in continued benefits from the company’s “Big Fix” turnaround and assumes management is able to squeeze meaningful margin leverage as it returns the company back to growth. While we will be patient we will also be tracking the company’s “Big Fix” progress.

So why now?

Simple, a recent downgrade from investment firm Wedbush hit Chipotle shares and led them to fall just over 9% during the last several trading days from $523 to the current $475. For some perspective, that followed a recent upgrade by Morgan Stanley to an Overweight rating and the reiteration of an Overweight rating by Piper Jaffray. I see Wedbush’s comment as very rear-view mirror relative to the company’s progress in turning the business around, a key point of our investment thesis. That 9% drop in the share price means we now have nearly 16% upside to that “at least” $550 price target. Yes, Niccol and the company have much further to go, and from time to time there will be missteps and setbacks along the way, but as the saying goes, our eye is on the long-term prize with Chipotle.

As such, we’re using the recent drop in the shares relative to the $550 price target to add CMG shares back to the Select List as part of our Clean Living investing theme. The strategy with this position will be to add to the shares on weakness provided the company continues to make progress on the new management team’s four-pronged initiative AND drives favorable traffic and sales metrics.

  • We are issuing a Buy on the shares of Chipotle Mexican Grill (CMG) and adding them to the Tematica Investing Select List with a $550 price target. 


WEEKLY ISSUE: Booking more Habit gains and redeploying into another Digital Lifestyle investment

WEEKLY ISSUE: Booking more Habit gains and redeploying into another Digital Lifestyle investment

Key points in this issue

  • We are issuing a Sell on Habit Restaurant (HABT) shares and removing them from the Tematica Investing Select List. As we say goodbye to Habit, we’d note the position generated a blended return of more than 80% over the last four months.
  • We are issuing a Buy on Alibaba (BABA) shares as part of our Digital Lifestyle investing theme with a $230 price target.
  • Chatter over Apple’s (AAPL) potential new products begins to swell ahead of its upcoming Fall event, and it’s looking for our Universal Display (OLED) shares as well. Our price targets for AAPL and OLED shares remain $225 and $150, respectively.


Exiting Habit Restaurant Shares

A few weeks ago we took some of our Habit Restaurant (HABT) shares off the table, which gave us a tasty 68% profit on that half of the position. In the ensuing weeks, Habit shares have continued their climb higher and with last night’s close, the remaining portion of our HABTshares were up almost 89% from our early May buy. Not only is that a hefty profit, but it equates to a very rich valuation as well.

As of last night’s close, HABTshares were trading at 278x expected 2019 EPS of $0.06 vs. a PE range of 16-80 for peers that that range from El Poll Loco (LOCO) to Shake Shack (SHAK). On a price to sales basis, HABTshares are trading near 1.15x expected 2018 sales, well ahead of the 0.9x takeout multiple at which Zoe’s Kitchen is being acquired by Cava Mezza Grill.

As we often hear, it pays not to fall in love with the stock one owns, lest we are tempted to not do the prudent thing. I still like the Habit Restaurant story, and that goes for its Ahi Tuna burger as well. That said, given the phenomenal run and rich valuation, I’m calling it a day and removing HABTshares from the Tematica Investing Select List. I’ll be keeping tabs on the company and its geographic expansion in the coming months, but I’d be more inclined to revisit the shares at a more reasonable set of valuation metrics.

  • We are issuing a Sell on Habit Restaurant (HABT) shares and removing them from the Tematica Investing Select List. As we say goodbye to Habit, we’d note the position generated a blended return of more than 80% over the last four months.

Gearing into Alibaba Shares

One of the shortcomings in the perspective for most investors is they tend to be focused on the geographic region in which they reside. Given the global nature of our investment themes, I try to keep an open mind and look for thematic opportunities no matter where they are. One such company that sits at the crossroads of our Digital Lifestyle and Rise of the New Middle-Class investments, and has a dash of Disruptive Innovators and Digital Infrastructure is Alibaba (BABA). Alibaba has long been heralded as the Amazon (AMZN) of China given its position in digital shopping (84% of revenue) but that’s about where the similarities end…. For now.

Last week Alibaba reported its latest quarterly results, in which revenue hit $12.23 billion for the quarter, beating consensus expectations of $12.02 billion. Paired with double-digit earnings before interest, tax, depreciation, and amortization (EBITDA) growth is more than overshadowing a $0.02 per share miss on the company’s bottom line, which came in at $1.22 per share.

At Alibaba, all the company’s operating profit is derived from its core commerce business with the remaining 16% of its revenue stream spread across cloud, digital media and innovation initiatives all weighing on that profit stream. By comparison, Amazon’s Amazon Web Services (AWS) is the company’s profit and cash flow secret weapon as I like to call it.

That’s the negative, but if we look at the year over year comparisons of the non-core commerce businesses, not only are they growing quickly, but year over year Alibaba is shrinking their losses across the board.

In many respects this is similar to one of the key concerns investors once had with Amazon not too long ago — can it turn a consistent profit? We have seen Amazon do just that for a number of quarters in a row, and investors have removed that objection, which has sent AMZN shares significantly higher.

With Alibaba, the question is not whether those businesses become profitable, but rather when. Yes, much like Amazon, Alibaba continues to invest for future growth as evidenced by the level of capital spending in the June quarter vs. the year ago and declining cash on the balance sheet.

Both of these reflect investments to — much like Amazon — move past its core commerce platforms, into physical retail and food-delivery services, as well as expanding its footprint in areas such as logistics and in overseas markets.

That said, the company is benefiting from the continued tailwinds of the Digital Lifestyle investment theme. This is evidenced by the continued growth in both active consumers on its retail marketplace as well as mobile monthly active users. Exiting June, the company’s annual active consumers reached 576 million, up nearly 24% year over year, while its mobile monthly active users hit 634 million, up 20% year over year.

Much like Amazon’s Prime business, as Alibaba expands its scope of product and services, at least in the near-term, it should continue to win new users and retain existing ones. Also much like Amazon, Alibaba will continue to grab incremental consumer wallet share. The combination should continue to drive top-line growth and pull its non-core commerce businesses into the black.

Following last week’s earnings report, consensus EPS sits at $5.71 per share, up from the $4.78 achieved in 2017, with expectations of $7.75 in 2019. What the math shows is an expectation for roughly 27% EPS growth over the 2017-2019 time frame, and against that backdrop BABA shares are trading at a PEG ratio of 0.85 based on 2019 EPS expectations.

In coming months, odds are we will see continued growth in China digital commerce as China consumers build up for the year-end holidays and Chinese New Year. That along with other gains in its cloud and digital media businesses should see Alibaba closing the profit gap leading to not only more comparisons to Amazon but to multiple expansion to a PEG ratio of 1.1x that offers upside to $230, if not more.

The one obvious risk is the impact of trade and tariffs between the U.S. and China, which stepped up today. My thinking is given the slowing economic data of late from China and potential mid-term election risk, President Trump could be angling for an October-early November trade win. Not only would that send the overall U.S. stock market higher, but it would remove the trade concerns from BABA shares as well.

  • We are issuing a Buy on Alibaba (BABA) shares as part of our Digital Lifestyle investing theme with a $230 price target.


Apple ChatterCcontinues to Build Ahead of its 2018 Product Launch

With Apple’s (AAPL) annual fall event inching closer, chatter about new products is increasing and the internet is filling up with speculation over the number of iPhones and other products that the company could ship later this year. The current buzz has three new models being released:

  • an iPhone X successor
  • a new 6.5-inch iPhone X Plus
  • a mass-market 6.1-inch LCD iPhone with thin bezels and Face ID just like the iPhone X

Accompanying this chatter is speculation concerning the impact on Apple shipments, with DigiTimes saying “new iPhone shipments should hit 70-75 million units through the end of the year, the highest level since the iPhone 6/6 Plus super cycle. This number is purely on new 2018 iPhone shipments, it does not include sales of older generations.”

These happenings help explain the favorable move higher in Apple shares registered in recent days as well as for fellow Select List holding Universal Display (OLED).

Based on the rumblings, it looks like Apple will have two iPhone models utilizing organic light-emitting diode display technologies, up from just one last year, a positive for Universal’s chemical and IP business, especially as shipments of those model will likely continue to grow in 2019. Remember, too, that some months ago Apple was expected to fully transition its iPhone lineup to organic light-emitting diode displays with its 2019 lineup. Going from one model to two or three of its new models appears to be a confirming step as organic light emitting diode capacity expands and display prices come down.

I continue to see an improving outlook for OLED shares as smartphone competitors follow suit and adopt the organic light-emitting diode technology, and its uses expand into other markets (interior automotive lighting, specialty lighting and eventually general illumination, much the way light emitting diodes did). Our price target on OLED shares remains $150.

With Apple, I expect the shares to continue to melt up ahead of its rumored mid- September event and look to revisit our $225 price target based on products the company does announce, not rumors.

  • Chatter over Apple’s (AAPL) potential new products begins to swell ahead of its upcoming Fall event, and it’s looking for our Universal Display (OLED) shares as well. Our price targets for AAPL and OLED shares remain $225 and $150, respectively.

WEEKLY ISSUE: Taking Positions Off the Board and Reallocating Into Existing Positions

WEEKLY ISSUE: Taking Positions Off the Board and Reallocating Into Existing Positions

Key points from this issue

  • We are exiting the shares of Paccar (PCAR), which had an essentially neutral impact on the Select List;
  • We are exiting the shares of Rockwell Automation (ROK), which were a drag of more than 11% on the Select List;
  • We are exiting the shares of GSV Capital (GSVC), which in full returned a modest decline since we added the shares back in April.
  • We are scaling into shares of Applied Materials (AMAT) at current levels and keeping our long-term price target of $70 intact.
  • We are scaling into shares of Netflix (NFLX) at current levels and keeping our long-term price target of $500 in place.


After the S&P 500 hit an all-time high yesterday, if the stock market finishes higher today it will mean the current bull market will be 3,453 days old, which will make it the longest on record by most definitions. For those market history buffs, as of last night’s market close, it tied the one that ran from October 1990 to March 2000.

Even as the S&P 500 hit an all-time high yesterday thus far in 2018 it’s up 7.1%. By comparison, we have a number of positions on the Tematica Investing Select List that are up considerably more. Among them are Amazon (AMZN), Apple (AAPL), Costco Wholesale (COST), ETFMG Prime Cyber Security ETF (HACK), Habit Restaurant (HABT), McCormick & Co. (MKC), and USA Technologies (USAT). Not that I’m prone to bragging, rather I’m offering a gentle reminder of the power to be had with thematic investing vs. the herd and sector-based investing.

Over the last few weeks, I’ve been recasting our investing themes, which in some cases has given rise to a new theme like Digital Infrastructure, combined a few prior themes into the more cohesive Digital Lifestyle and Middle-Class Squeeze ones, and expanded the scope of our Clean Living theme. In the next few weeks, I’ll finish the task at hand as well as ensure we have a stock recommendation for each of what will be our 10 investment themes.

As part of that effort, I’m re-classifying USA Technologies (USAT) shares as part of our Digital Infrastructure investing theme. The shares join Dycom Industries (DY) in this theme.


Pruning PCAR, ROK and GSVC shares

Once we pass the approaching Labor Day holiday, we will be off to the races with the usual end of the year sprint. For that reason, we’re going to take what is normally the last two relatively quiet weeks of August to do some pruning. This will go hand in hand with the ongoing investment theme reconstitution that will eliminate the stand-alone Economic Acceleration/Deceleration and Tooling & Re-tooling investment themes. As such, we’re saying goodbye to shares of Paccar (PCAR) and Rockwell Collins (ROK). We’ll also shed the shares of GSV Capital (GSVC), which are going to be largely driven by share price movements in Spotify (SPOT) and Dropbox (DBX). As the lock-up period with both of those newly public companies come and go, I’ll look to revisit both of them with an eye to our Digital Lifestyle and Digital Infrastructure investing themes.

  • We are exiting the shares of Paccar (PCAR), which had an essentially neutral impact on the Select List;
  • We are exiting the shares of Rockwell Automation (ROK), which were a drag of more than 11% on the Select List;
  • We are exiting the shares of GSV Capital (GSVC), which in full returned a modest decline since we added the shares back in April.


Scaling into Applied Materials and Netflix shares

We’ll use a portion of that returned capital to scale into shares of Applied Materials (AMAT), which approached their 52-week low late last week following the company’s quarterly earnings report that included an earnings beat but served up a softer than expected outlook.

Applied’s guidance called for sales of $3.85-$4.15 billion vs. analyst consensus outlook of $4.45 billion. On the company’s earnings conference call, CEO Gary Dickerson confirmed worries that slower smartphone growth could cause chipmakers to rein in capital spending and reduce demand for chipmaking equipment in the near- term. That’s the bad news, the good news is Applied sees double-digit growth in 2019 for each of its businesses and remains comfortable with its 2020 EPS forecast of $5.08.

From my perspective, I continue to see the several aspects of our Disruptive Innovators investing theme – augmented and virtual reality, 5G, artificial intelligence, Big Data and others – as well as growing storage and memory demands for connected devices driving semiconductor capital equipment demands. There is also the rising install base of semiconductor capital equipment inside China, and with Apple turning to China suppliers over Taiwanese ones to contain costs it likely means a rebound in China demand when the current US-China trade imbroglio ends.

As we wait for that, I suspect Applied will continue to use its stock buyback program During its recently closed quarter, Applied repurchased $1.25 billion or 25 million shares of stock and the company has about $5 billion remaining in buyback authorization. Applied’s next quarterly dividend of $0.20 per share will be paid on Sept. 13 to shareholders of record on Aug. 23.

  • We are scaling into shares of Applied Materials (AMAT) at current levels and keeping our long-term price target remains $70 intact.

Turning to Netflix (NFLX) shares, they are down some just under 20% from where I first added them to the Select List several weeks ago. My thesis on the shares remains unchanged, and I continue to see its streaming video service and original content as one of the cornerstones of our Digital Lifestyle investing theme. Adding to the shares at current levels will serve to reduce our cost basis from just under $420 to just under $380.

  • We are scaling into shares of Netflix (NFLX) at current levels and keeping our long-term price target of $500 in place.


Making thematic sense of the July Retail Sales report

Making thematic sense of the July Retail Sales report

Key points for this alert:

  • Our price target on Amazon (AMZN) remains $2,250.
  • Our price target on Costco Wholesale (COST) remains $230.
  • Our price target on Habit Restaurant (HABT) is getting a boost to $17 from $16.
  • We are also bumping our price target on McCormick & Co. (MKC) shares to $130 from $110 as we get ready for seasons eatings 2018.


Following on the heels of the July Retail Sales report we received Wednesday, this morning Walmart (WMT) reported stellar July quarter results led by stronger than expected same-store sales and a 40% year over year increase in its e-commerce sales. From our perch, we see both reports as positive for our positions in both Amazon (AMZN) and Costco Wholesale (COST) as well as Habit Restaurant (HABT) and McCormick & Co. (MKC) shares.

Digging into the better than expected July Retail Sales report that showed Retail up 0.4% month over month and 6.0% sequentially, top performers were Food Services & drinking places (up +9.7% year over year), Nonstore retailers (+8.7%) and Grocery Stores (+4.9%) year over year. In response to that report, as well as the news that China and the US are heading back to the trade negotiation tables, our Habit Restaurant shares continue to sizzle. That stellar showing in July for Food Services & drinking places brought the trailing 3-month comparison to up more than 8% year over year.

To me, this echoes the data we’ve seen of late that points to the rebound in monthly restaurant sales, which is due as much to price increases as it is to improving customer volume, particularly at Fast Casual restaurants like Habit. As evidenced by Habit’s recent blowout June quarter earnings report, the company continues to execute on the strategy that led us to add the shares to the portfolio back in May. On the heels of the July Retail Sales report, I find myself once again boosting our price target on HABT shares to $17 from $16 as the underlying strength is continuing into the current quarter.

With just over 6% upside to our new price target for Habit, it’s not enough to commit fresh capital to the position. Given the surge in HABT shares – more than 80% since we added them to the Tematica Investing Select List this past May – as well as their current technical picture (see the chart below), I’m inclined to opportunistically use the position as a source of funds in the coming weeks.


While one might think those gains have come at the expense of grocery stores, and in turn, a potential blow to McCormick’s, the July figure for grocery was also the best in the last three months. What this tells us is people are likely paying more for food at the grocery store and at restaurants, which reflects the combination of higher food prices as well as the shift to food, drinks, and snacks that are healthier for the consumer (and a bit more expensive in general). On that strength and the forward view that will soon have us waist deep in season’s eatings, we are boosting our price target for MCK to $130 from $110. That includes some post-June quarter earnings catch up on our part for McCormick and its ability to grow its top line as part of our Clean Living and Rise of the New Middle Class investing themes, as well as wring out cost synergies associated with acquired businesses. In the coming months, I expect we will once again see this Dividend Dynamo boost its quarterly dividend, keeping MKC shares as one to own, not trade.

Getting back to the July Retail Sales report, the Nonstore retail July figure bodes very well for continued share gains at Amazon and other retailers that are embracing our Digital Lifestyle investing theme as we head into the holiday shopping season. Moreover, I see the e-commerce sales gains at Walmart – up +40% in the July quarter as well as those by Costco Wholesale, up  33% year to date — serving to confirm the accelerating shift by consumers to that modality of shopping as more alternatives become available. Helping Walmart is the addition of over 1,100 brands year to date including Zwilling J. A. Henckels cutlery and cookware, Therm-a-Rest outdoor products, O’Neill surf and water apparel, Shimano cycling products and the brands available on the dedicated Lord & Taylor shop, like Steve Madden footwear. Let’s remember too that Amazon continues to pull the lever that is private label products across a growing array of categories, and those margins are superior to those for its Fulfilled by Amazon efforts.

Speaking of Costco, its July sales figures showed a 6.6% year over year increase in same-store sales, which as we learned by comparing that with the July Retail Sales report was magnitudes stronger than General Merchandise stores (+3.3% year over year) and Department Stores (+0.3% year over year). Yes, Costco was helped by its fresh foods business, but even there it topped Grocery sales for the month. The clear message is that Costco continues to win consumer wallet share, and more of that is likely to be had in the coming months as consumers contend with the seasonal spending pickup.

The big loser in the July Retail Sales report was the Sporting goods, hobby, musical instrument, & bookstores category, which is more than likely seeing its lunch eaten by Amazon, Walmart, and Costco. All three of these companies are embracing the increasing digital lifestyle, targeting rising incomes in the emerging markets and helping cash-strapped consumers in the US stretch those dollars. As we have said many times before, the only thing better than the tailwinds of one of our investing themes is the combination of several and these companies are benefitting from our Digital Lifestyle, Rise of the New Middle Class and Middle-Class Squeeze investing themes.

All in all, the last 24 or so hours as very positive for our AMZN, COST, HABT and MKC shares on the Tematica Investing Select List.

  • Our price target on Amazon (AMZN) remains $2,250.
  • Our price target on Costco Wholesale (COST) remains $230.
  • Our price target on Habit Restaurant (HABT) is getting a boost to $17 from $16.
  • We are also bumping our price target on McCormick & Co. (MKC) shares to $130 from $110 as we get ready for seasons eatings 2018.


Clean Living: Healthier food, healthier people, healthier homes, offices and a healthier planet

Clean Living: Healthier food, healthier people, healthier homes, offices and a healthier planet


They say too much information is a dangerous thing, but in the case of consumers, access to information is helping reshape how they are living their lives:

  • According to a recent survey from Label Insight, 39% of U.S. consumers say they would switch from the brands they currently buy to others that provide clearer, more accurate product information.
  • Per Nielsen, 73% of consumers surveyed said they feel positive about brands that share the “why behind the buy” information about their products.
  • 68% say they’re willing to pay more for foods and beverages that don’t contain ingredients that they perceive to be
  • In some cases, consumers are more interested in knowing what’s not included than what is included in the products they buy. 53% percent of consumers surveyed said the exclusion of undesirable ingredients is more important than the inclusion of beneficial ingredients. These include high fructose corn syrup, artificial sweeteners and colorings, sugar, sulfites, genetically modified organisms (GMOs), refined grains and carbohydrates, and dozens of other ingredients.


This shift in preference for healthy, natural products and the eschewing of artificial chemicals, sweeteners, sugar and other synthetics is one of the basic building blocks for TematicaResearch’s Clean Living investing theme. In 2017, the US organic food market was roughly $44 billion and is expected to reach $70.4 billion by 2025 according to Hexa Research.  The trend towards more natural, “good for you” foods and other products isn’t just focused on organics, however:

  • According to a 2016 Neilsen survey, 50% of people surveyed in North America reported they try to avoid foods with GMOs.
  • In another study, this time by Consumer Reports in 2014, 72% of participants responded that when shopping it is important to avoid GMOs and 40% look for non-GMO labels and claims on packaging.
  • On the gluten free front Statista reports that by 2020, the market is projected to be valued at 7.59 billion U.S. dollars.


We see this movement towards natural, organic, non-GMO and even gluten-free foods reflected in commentary from grocery chain Kroger that natural foods continue to generate strong double-digit growth compared to overall same-store sales growth in the low single-digits. This shift in consumer preferences is already having an impact on companies, with some responding to the tailwind, such as

  • Amazon (AMZN) buying Whole Foods Market
  • The Hershey Company (HSY) first acquiring Krave, a maker of jerky products, and then Amplify Snacks, the provider of Skinny Pop popcorn products and Oatmega grass fed whey protein bars and cookies;
  • Annie’s Homegrown, the Berkeley, California-based maker of “natural” and organic pastas, meals and snacks was snatched up by General Mills (GIS) in 2014, one of several natural acquisitions by the food giant that includes Immaculate Baking, Cascadian Farms, and Muir Glen.
  • Baked fruit and vegetable snack-maker Bare Foods Co. was scooped up by PepsiCo (PEP), which has also introduced organic and healthier versions of some of its biggest snack brands. PepsiCo has also introduced Bubly, a sparkling water brand.
  • In 2016 Coca-Cola (KO) announced it had more than 200 reformulation initiatives underway to reduce added sugar across its carbonated soft drink portfolio.
  • French dairy giant Danone has agreed to acquire plant-based dairy alternatives company WhiteWave Foods Co.
  • International Flavors and Fragrances (IFF) acquired Israeli flavors and natural ingredients firm Frutarom for $7.1 billion to become the second largest supplier in the global natural flavors market.
  • Cott Corp. (COT) sold its traditional beverage manufacturing business for $1.25 billion to Refresco Group NV and retained its water, coffee, tea and filtration service business — categories aligned with health and wellness trends.


Dining Out Trends Towards Clean as Well

While softening in recent years, in the United States we eat a good portion of our meals away from home — as much as 50% according to some reports. Of course, we all like to indulge ourselves when we go out for a night on the town, however, the Clean Living movement has also become pervasive across restaurant menus and chains in recent years. According to the Natural Restaurant Association, restaurant operators are taking notice, and in 2016 it was reported that more than eight in 10 of their guests paid more attention to the nutrition content of food when compared to two years prior. Given the growing pervasiveness of clean living and transparency, we suspect that percentage has likely inched higher since them

Just a couple of years ago, Chipotle (CMG), before its rash of health and food safety issues, was held out as the poster child for Clean Living restaurants. With its “Food with Integrity” program that began in earnest in 2015 with its ban on GMO’s across its entire menu, the burrito chain also focused on locally grown vegetables, free-range pork and chicken and antibiotic-free meats among other things. Panera Bread Co. (PNRA) announced in 2014 its plan to remove preservatives, sweeteners, flavors and colors from artificial sources from its entire menu, a process that took nearly 3 years to complete.

Zoe’s Kitchen (ZOES)  the fast-casual chain of Mediterranean-inspired comfort food with made-from-scratch recipes using fresh ingredients — made the leap from private to public in 2014 and now boasts over 200 locations across 17 states. There is a rash of food chains that are currently privately-held that are also riding this trend which includes the probably the most widely known, Cava Grill. Others include True Food Kitchen, Sweetgreen, Freshii, and Chopt.


Clean Living Isn’t Just What We Put In Our Bodies

In addition to clean eating, another aspect of this theme includes natural skincare & make-up, and non-toxic baby products. According to a market study by Grand View Research, the global market for natural and organic personal care products is projected to grow to $25.1 billion by 2025, expanding at a CAGR of 9.5% over the 2017-2025 period. In recent years there has been a long list of acquisitions in this  natural category:

  • Tom’s of Maine, known for its natural toothpastes, mouthwashes and deodorants was scooped up by Colgate-Palmolive (CL) in 2006 for $100 million.
  • Organic balms and butters brand Burt’s Bees was acquired by Clorox (CLX) for $925 million in 2017.
  • After building Bare Escentuals — producer of mineral and powder based makeup line bareMinerals — from the ground up, CEO Leslie Blodgett accepted a buyout in 2010 from Tokyo-based cosmetics company Shieseido for a reported $1.7 billion
  • Similarly, Johnson & Johnson (JNJ) counts in its stable of brands Aveeno, L’Oreal owns The Body Shop, and Estee Lauder (EL) owns both Aveda and Origins, among other brands.

As with clean eating, where the movement went from fringe brands being acquired by large consumer packaged goods brands to those companies actually reformulating their mainstay brands to be more natural, organic and chemical-free, we’ve seen personal care brands respond to this movement as well:

  • Companies such as Procter & Gamble (PG) and Estée Lauder have acquired or invested in clean brands, knowing their giant manufacturing processes can’t just take out a few parabens and call ita day. Other companies, such as Unilever (UL), have started completely from scratch, creating their own new skin-care and hair-care lines.
  • Johnson & Johnson has announced it will disclose all ingredients in its baby care products, including fragrance ingredients, down to 0.01% of content.
  • In 2017, L’Oréal Paris-owned Garnier introduced Skin Actives Naturals, a line of 96% (at least) naturally derived products, they also began listing ingredient sources on their labels, while cutting parabens, silicones, dyes, and sulfates.
  • Unilever announced that it would be scooping up natural deodorant brand Schmidt’s. That closely followed the acquisition of cult-fave natural deodorant brand Native by Proctor & Gamble in late November.

In keeping with our Rise of the Middle Class investing theme, we are also seeing a growing number of health-conscious consumers in the emerging markets as well.

According to a report from RedSeer the current organic skin care market in India is pegged at $125 million, growing at 25% year-over-year to reach $315 million by 2022.


Clean Living Means a Clean Planet

The market for natural and organic cleaning supplies has been a niche market at best for many decades — when it came to cleaning, consumers felt a chemical onslaught was best. But in recent years, as health concerns began to arise with the chemicals in these products as part of an overall adoption of a healthier lifestyle, such products have moved into the mainstream and according to ReportLinker, the U.S specialty household cleaners market is expected to reach $7.96 billion by 2024.

When asked by Nielsen to pick the attributes they seek when purchasing all-purpose cleaners, 40% around the world say they want environmentally friendly benefits and nearly as many (36%) say they don’t want harsh chemicals. Seventh Generation Inc, based in Burlington, VT is probably one of the most well-known brands in the space, selling cleaning, paper and personal care products with a focus on sustainability and the conservation of natural resources. Starting as a mail-order only company in 1988, the company was acquired by Unilever in 2016 for $700 million – notice a trend here yet?

Other companies are also offering products for the home that have high recycling content and environmentally friendly processes, such as Trex Companies and its decking products. The average 500-square foot composite Trex deck contains 140,000 recycled plastic bags, which makes it one of the largest plastic bag recyclers in the U.S. as it saves 400 million pounds of plastic film and wood from landfills each year. As one might suspect Trex is not the only company capitalizing on recycling and clean. Other areas in which we are seeing these unfold include low chemical furniture, mattresses, paint, flooring and even footwear made entirely from post-consumer water bottles by Rothy’s.

Another aspect of this theme is clean technologies, which include products and technologies designed to be economically competitive by using less material and energy to reduce their environmental impact compared with incumbent technologies. Example of clean technologies include biofuels, wind and solar power, electric vehicles, solid-state lighting and other renewables that are replacing coal, petroleum and other fossil fuel based solutions. According to the International Agency, by 2030 there will be 125 million electric vehicles across the globe compared to the 3.1 million found in 2017. With these and other forms of clean energy, we’ll be careful to watch the political landscape as well as new technological developments associated with our Disruptive Innovators investing theme that could alter the playing field on cost, efficiency or both.


Companies Sustaining the Clean Living Focus

As its name suggests, the Tematica Research Clean Living investing theme focuses on companies that provide products, ingredients and other solutions and services that are in keeping with the clean lifestyle. This theme could be summed up succinctly with “Healthier food, healthier people, healthier homes, offices and a healthier planet.”

Examples of publicly traded companies riding the Clean Living investment theme tailwinds:

  • Amazon (AMZN)
  • Chipotle (CMG)
  • Cott Corp. (COT)
  • First Solar (FSLR)
  • Freshpet (FRPT)
  • Gaia (GAIA)
  • Hain Celestial (HAIN)
  • International Flavors (IFF)
  • National Beverage Corp. (FIZZ)
  • Natural Grocers (NGVC)
  • Nautilus (NLS)
  • Primo Water (PRMW)
  • The Simply Good Foods Co. (SMPL)
  • SodaStream International (SODA)
  • Sprouts Farmers Market (SFM)
  • Tesla (TSLA)
  • Town Sports International Holdings (CLUB)
  • Trex Company (TREX)
  • United Natural Foods (UNFI)
  • Zoes’ Kitchen (ZOES)


WEEKLY ISSUE: Scaling deeper into Dycom shares

WEEKLY ISSUE: Scaling deeper into Dycom shares

Key points from this issue:

  • We are halfway through the current quarter, and we’ve got a number of holdings on the Tematica Investing Select List that are trouncing the major market indices.
  • We are using this week’s pain to improve our long-term cost basis in Dycom Industries (DY) shares as we ratchet back our price target to $100 from $125.
  • Examining our Middle-Class Squeeze investing theme and housing.
  • A Digital Lifestyle company that we plan on avoiding as Facebook attacks its key market.


As the velocity of June quarter earnings reports slows, in this issue of Tematica Investing we’re going to examine how our Middle-Class Squeeze investing theme is impacting the housing market and showcase a Digital Lifestyle theme company that I think subscribers would be smart to avoid. I’m also keeping my eyes open regarding the recent concerns surrounding Turkey and the lira. Thus far, signs of contagion appear to be limited but in the coming days, I suspect we’ll have a much better sense of the situation and exposure to be had.

With today’s issue, we are halfway through the current quarter. While the major market indices are up 2%-4% so far in the quarter, by comparison, we’ve had a number of strong thematic outperformers. These include Alphabet (GOOGL), Amazon (AMZN), Apple (AAPL), AXT Inc. (AXTI), Costco Wholesale (COST),  Habit Restaurant (HABT), Walt Disney (DIS), United Parcel Service (UPS), Universal Display (OLED) and USA Technologies (USAT).  That’s an impressive roster to be sure, but there are several positions that have lagged the market quarter to date including GSV Capital (GSVC), Nokia (NOK), Netflix (NFLX), Paccar (PCAR) and Rockwell Automation (ROK). We’ve also experienced some pain with Dycom (DY) shares, which we will get to in a moment.

Last week jettisoned shares of Farmland Partners (FPI) following the company taking it’s 3Q 2018 dividend payment and shooting it behind the woodshed. We also scaled into GSVC shares following GSV’s thesis-confirming June quarter earnings report, and I’m closely watching NFLX shares with a similar strategy in mind given the double-digit drop since adding them to the Tematica Investing Select List just over a month ago.


Scaling into Dycom share to improve our position for the longer-term

Last week we unveiled our latest investing theme here at Tematica – Digital Infrastructure. Earlier this week, Dycom Industries (DY), our first Digital Infrastructure selection slashed its outlook for the next few quarters despite a sharp rise in its backlog. Those shared revisions are as follows:

  • For its soon to be reported quarter, the company now sees EPS of $1.05-$1.08 from its previous guidance of $1.13-$1.28 vs. $1.19 analyst consensus estimate and revenues of $799.5 million from the prior $830-$860 million vs. the $843 million consensus.
  • For its full year ending this upcoming January, Dycom now sees EPS of $2.62-$3.07 from $4.26-$5.15 vs. the $4.63 consensus estimate and revenues of $3.01-$3.11 billion from $3.23-$3.43 billion and the $3.33 billion consensus.


What caught my eyes was the big disparity between the modest top line cuts and the rather sharp ones to the bottom line. Dycom attributed the revenue shortfall to slower large-scale deployments at key customers and margin pressure due to the under absorption of labor and field costs – the same issues that plagued it in its April quarter. Given some of the June quarter comments from mobile infrastructure companies like Ericsson (ERIC) and Nokia (NOK), Dycom’s comments regarding customer timing is not that surprising, even though the magnitude to its bottom line is. I chalk this up to the operating leverage that is inherent in its construction services business, and that cuts both ways – great when things are ramping, and to the downside when activity is less than expected.

We also know from Ericsson and Dycom that the North American market will be the most active when it comes to 5G deployments in the coming quarters, which helps explain why Dycom’s backlog rose to $7.9 billion exiting July up from $5.9 billion at the end of April and $5.9 billion exiting the July 2017 quarter. As that backlog across Comcast, Verizon, AT&T, Windstream and others is deployed in calendar 2019, we should see a snapback in margins and EPS compared to 2018.

With that in mind, the strategy will be to turn lemons – Monday’s 24% drop in DY’s share price – into long-term lemonade. To do this, we are adding to our DY position at current levels, which should drop our blended cost basis to roughly $80 from just under $92. Not bad, but I’ll be inclined to scale further into the position to enhance that blended cost basis in the coming weeks and months on confirmation that 5G is moving from concept to physical network. Like I said in our Digital Infrastructure overview, no 5G network means no 5G services, plain and simple. As we scale into the shares and factor in the revised near-term outlook, I’m also cutting our price target on DY shares to $100 from $125.

  • We are using this week’s pain to improve our long-term cost basis in Dycom Industries (DY) shares as we ratchet back our price target to $100 from $125.


Now, let’s get to how our Middle-Class Squeeze investing theme is hitting the housing market, and review that Digital Lifestyle company that we’re going to steer clear of because of Facebook (FB). Here we go…


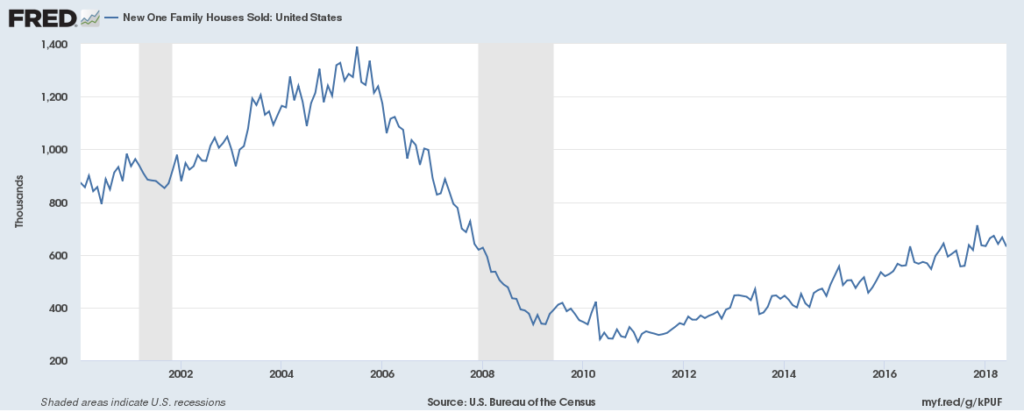
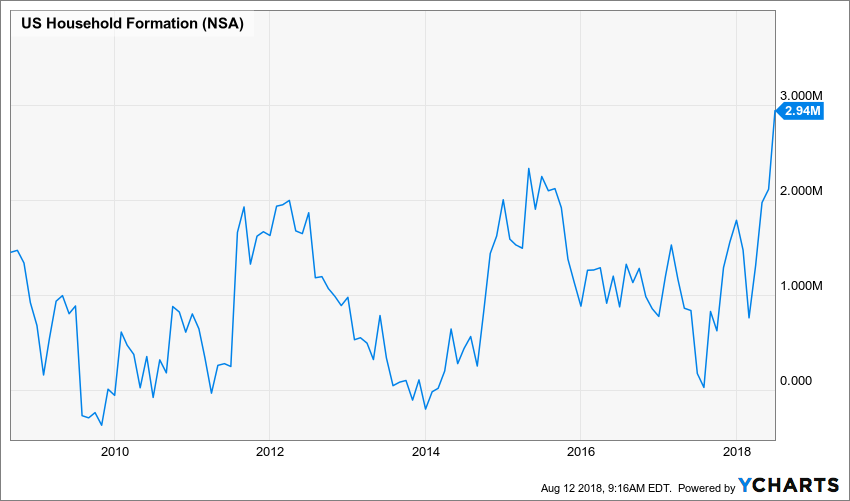
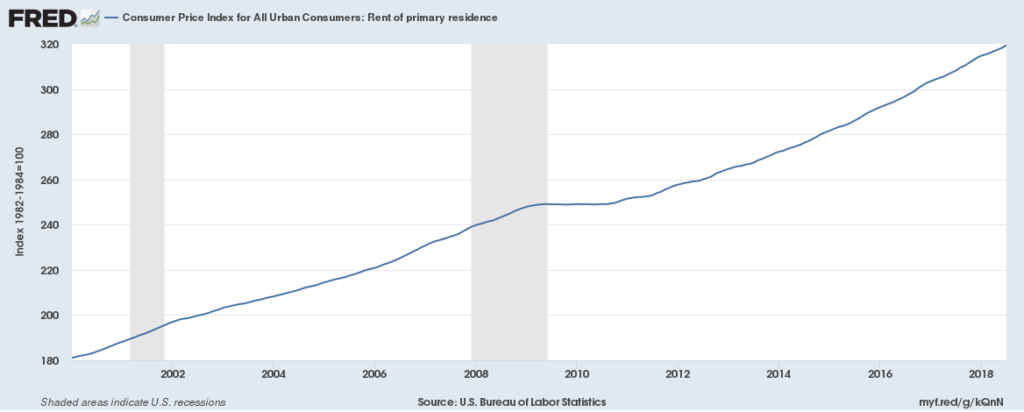
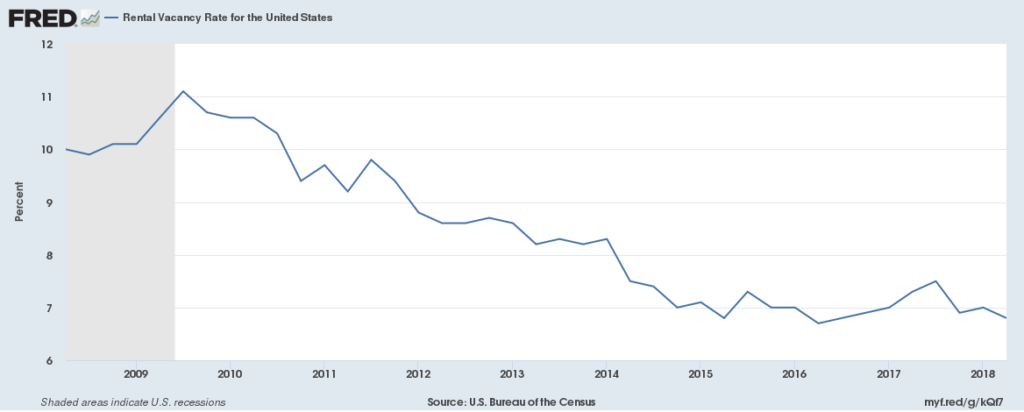
If not single-family homes, where are the squeezed middle-class going?

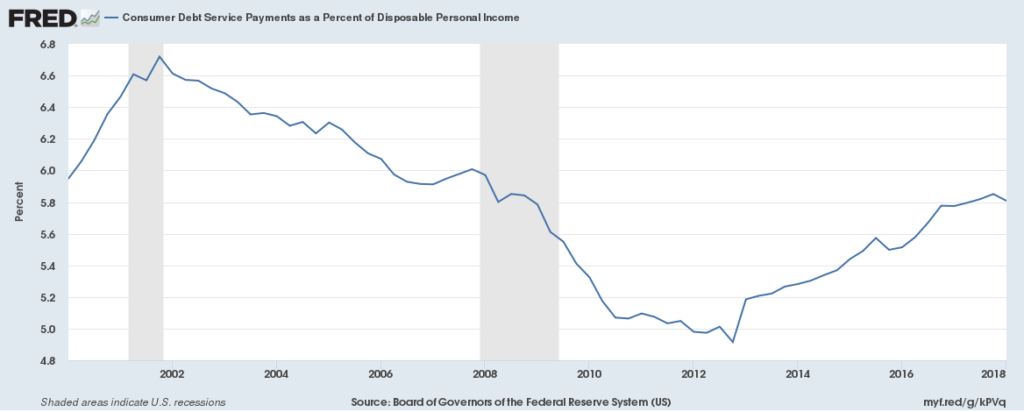
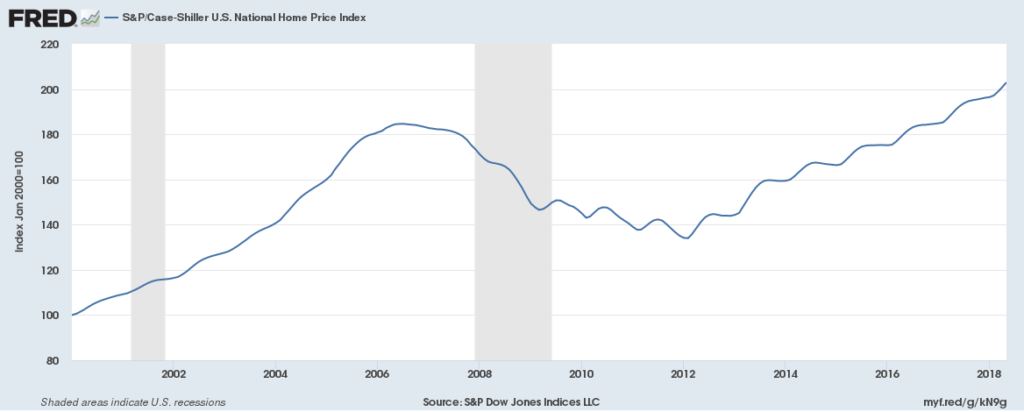
To own a home was once considered one of the cornerstones of the American dream. If we look at the year to date move in the SPDR S&P Homebuilders ETF (XHB), which is down nearly 16% this year, one might have some concerns about the tone of the housing market. Yes, there is the specter of increasing inflation that has and likely will prompt the Federal Reserve to boost interest rates, and that will inch mortgage rates further from the near record lows enjoyed just a few years ago.

Here’s the thing:

  • Higher mortgage rates will make the cost of buying a home more expensive at a time when real wage growth is not accelerating, and consumers will be facing higher priced goods as inflation winds its way through the economic system leading to higher prices. During the current earnings season, we’ve heard from a number of companies including Cinemark Holdings (CNK), Hostess Brands (TWNK), Otter Tail (OTTR), and Diodes Inc. (DIOD) that are expected to pass on rising costs to consumers in the form of price increases.
  • Consumers debt loads have already climbed higher in recent years and as interest rates rise that will get costlier to service sapping disposable income and the ability to build a mortgage down payment


And let’s keep in mind, homes prices are already the most expensive they have been in over a decade due to a combination of tight housing supply and rising raw material costs. According to the National Association of Home Builders, higher wood costs have added almost $9,000 to the price of the average new single-family since January 2017.


Already new home sales have been significantly lower than over a decade ago, and as these forces come together it likely means the recent slowdown in new home sales that has emerged in 2018 is likely to get worse.


Yet our population continues to grow, and new households are being formed.


This prompts the question as to where are these new households living and where are they likely to in the coming quarters as homeownership costs are likely to rise further?

The answer is rental properties, including apartments, which are enjoying low vacancy rates and a positive slope in the consumer price index paid of rent paid for a primary residence.


There are several real estate investment trusts (REITs) that focus on the apartment and rental market including Preferred Apartment Communities, Inc. (APTS) and Independence Realty Trust (IRT). I’ll be looking at these and others to determine potential upside to be had in the coming quarters, which includes looking at their attractive dividend yields to ensure the underlying dividend stream is sustainable. More on this to come.


A Digital Lifestyle company that we plan on avoiding as Facebook attacks its key market

As important as it is to find well-positioned companies that are poised to ride prevailing thematic tailwinds that will drive revenue and profits as well as the share price higher, it’s also important to sidestep those that are running headlong into pronounced headwinds. These headwinds can take several forms, but one of the more common ones of late is the expanding footprint of companies like Alphabet (GOOGL), Amazon (AMZN) and Facebook (FB) among others.

We’ve seen the impact on shares of Blue Apron (APRN) fall apart over the last year following the entrance of Kroger (KR) into the meal kit business with its acquisition of Home Chef and investor concerns over Amazon entering the space following its acquisition of Whole Foods Market. That changing landscape highlighted one of the major flaws in Blue Apron’s subscription-based business model –  very high customer acquisition costs and high customer churn rates. While we warned investors to avoid APRN shares back last October when they were trading at north of $5, those who didn’t heed our advice are now enjoying APRN shares below $2.20. Ouch!

Now let’s take a look at the shares of Meet Group (MEET), which have been on a tear lately rising to $4.20 from just under $3 coming into 2018. The question to answer is this more like a Blue Apron or more like USA Technologies (USAT) or Habit Restaurant (HABT). In other words, one that is headed for destination @#$%^& or a bona fide opportunity.

According to its description, Meet offers  applications designed to meet the “universal need for human connection” and keep its users “entertained and engaged, and originate untold numbers of casual chats, friendships, dates, and marriages.” That sound you heard was the collective eye-rolling across Team Tematica. If you’re thinking this sounds similar to online and mobile dating sites like Tinder, Match, PlentyOfFish, Meetic, OkCupid, OurTime, and Pairs that are all part of Match Group (MTCH) and eHarmony, we here at Tematica are inclined to agree. And yes, dating has clearly moved into the digital age and that falls under the purview of our Digital Lifestyle investing theme.

Right off the bat, the fact that Meet’s expected EPS in 2018 and 2019 are slated to come in below the $0.39 per share Meet earned in 2017 despite consensus revenue expectations of $181 in 2019 vs. just under $124 million in 2017 is a red flag. So too is the lack of positive cash flow and fall off in cash on the balance sheet from $74.5 million exiting March 2017 to less than $21 million at the close of the June 2018 quarter. A sizable chunk of that cash was used to buy Lovoo, a popular dating app in Europe as well as develop the ability to monetize live video on several of its apps.

Then there is the decline in the company’s average total daily active users to 4.75 million in the June 2018 quarter from 4.95 million exiting 2017. Looking at average mobile daily active users as well as average monthly active user metrics we see the same downward trend over the last two quarters. Not good, not good at all.

And then there is Facebook, which at its 2018 F8 developer conference in early May, shared it was internally testing its dating product with employees. While it’s true the social media giant is contending with privacy concerns, CEO Mark Zuckerberg shared the company will continue to build new features and applications and this one was focused on building real, long-term relationships — not just for hookups…” Clearly a swipe at Match Group’s Tinder.

Given the size of Facebook’s global reach – 1.47 billion daily active users and 2.23 billion monthly active users – it has the scope and scale to be a force in digital dating even with modest user adoption. While Meet is enjoying the monetization benefits of its live video offering, Facebook has had voice and video calling as well as other chat capabilities that could spur adoption and converts from Meet’s platforms.

As I see it, Meet Group have enjoyed a nice run thus far in 2018, but as Facebook gears into the digital dating and moves from internal beta to open to the public, Meet will likely see further declines in user metrics. So, go user metrics to go advertising revenue and that means the best days for MEET shares could be in the rearview mirror. To me this makes MEET shares look more like those from Blue Apron than Habit or USA Technologies. In other words, I plan on steering clear of MEET shares and so should you.


Special Alert – Adding to our position in GSV Capital shares

Special Alert – Adding to our position in GSV Capital shares


Key points inside this Alert:

  • Following the thesis confirming June quarter results, we are adding to our position in GSV Capital (GSVC) on the Tematica Investing Select List given the steep discount to the company’s net asset value per share.


After last night’s close GSV Capital (GSVC) reported June quarter results — while the financial media headlines reported a mixed quarter in terms of revenue and the bottom line — our view is the quarter was a solid one characterized by the continued increase in its net asset value per share. That continued climb, as well as the reasons behind it, make us increasingly comfortable with our $11 price target. Given the sharp discount in between the current share price and GSV’s net asset value per share, we are adding to our position at current levels, which will enhance our cost basis as well.

Now onto the report …

Exiting June, GSV’s net asset valued totaled $217.1 million, up from $212.5 million exiting March driven primarily by the portfolio’s top five holdings. As a reminder, those holdings include Spotify (SPOT), Palantir Technologies, Dropbox (DBX), Coursera, and Stormwind. In total, the portfolio value for those five positions rose to $134.3 million (roughly 62% of the portfolio) from $124.2 million (58.5%). This means the holdings in its other 23 positions, in aggregate, fell sequentially. In our view this reaffirms management’s strategic pivot to concentrate its investments around its larger positions is paying off, which is also evidenced by the year over year decline in portfolio positions to 28 from 38 a year ago.

As I suspected, GSV put its share buyback program to work during the quarter, repurchasing 315,625 shares of common stock for approximately $2.2 million in cash. That brings it total share repurchase through the end of the June quarter to 1.43 million shares for roughly $8.3 million. The combination of its higher net asset value and a lower share count both year over and sequentially were the key drivers behind the continued step up in GSV’s net asset value per share to $10.46 per share at the end of June vs. $9.64 per share exiting 2017 and $9.11 per share exiting the June 2017 quarter.

In the current quarter, GSV has already purchased another 230,623 shares for $1.6 million, and with $5 million remaining under its current authorization I suspect the company will remain an active buyer given the discount to its net asset value per share.

In terms of potential new investments or scaling into existing ones, at the end of June GSV’s balance sheet held $93.5 million in cash and $65.1 million of marketable securities, of which $25.5 million is subject to sales restrictions. Factoring in the share repurchase activity over the last few weeks, GSV has roughly 20.5 million shares outstanding, $6.40 in available cash per share on its books and its net asset value per share is about $10.58 per share.

This cash position leaves ample firepower for GSV to add positions within its preferred bite size — $10 million average position size up to $15 million for an outsized one in a premium, late-stage growth company that a line of sight liquidity event, be it an initial public offering or getting acquired. With CB Insights having identified some 355 IPO candidates, the waters are full, but we expect GSV to remain disciplined and stick to its core investment areas – Education Technology, Cloud Computing, Big Data, and Social Mobile, Marketplaces, and Sustainability.

The takeaway from all the math-Olympics is GSV has ample dry powder to put to work and its share repurchases have and will continue to help move its net asset value per share higher. It’s also not lost that net asset value per share is approaching our $11 price target, while the shares are trading at a steep discount relative to their net asset value per share. With the current share price below our existing $7.50 cost basis, we are pulling the trigger and adding to our GSVC position at current levels.

  • Following the thesis confirming June quarter results, we are adding to our position in GSV Capital (GSVC) on the Tematica Investing Select List given the steep discount to the company’s net asset value per share.