Why March was different and what it means for 2Q-2017 in the Stock Market
DOWNLOAD THIS WEEK’S ISSUE
The full content of The Monday Morning Kickoff is below; however downloading the full issue provides detailed performance tables and charts. Click here to download.
Today, in addition to opening the 2017 Major League Baseball season, we open the books for 2Q 2017 as last Friday closed the books on both the month of March and 1Q 2017. One fourth of the year down, man how time flies!
As busy as it’s been for you, it’s been as busy for us here at Tematica, as Chief Macro Strategist Lenore Hawkins and Chief Investment Officer Chris Versace shared on last week’s Cocktail Investing Podcast, we’ve got a few more things in the hopper that we’ll start sharing with you in the next few weeks.
While we don’t want to let the cat out of the bag, we can share a modest hint — as much as people love our thematic way of investing, which offers differentiated insight while being easy for RIAs and other investors to explain to their customers, we’ve been asked for a more encompassing way to invest in our various themes. While we could tease and taunt you, all we say is “we’ve been listening.”
Stay tuned and be sure to check TematicaResearch.com during the week to catch more market and macro musings from Lenore and Chris. Now back to closing the books on 1Q 2017…
A Look Beneath the Headlines on the First Quarter of 2017
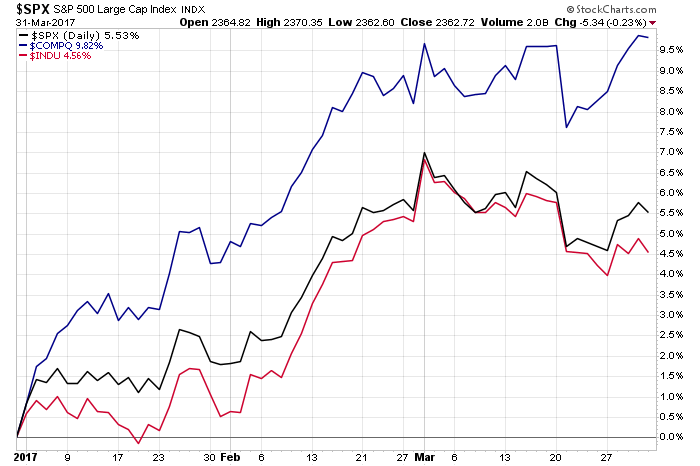
In sum, the March quarter was a good one for stocks as the S&P 500 climbed just over 5.5 percent during the first three months of the year. As we say here at Tematica, however, in order to fully understand what’s really going on we have to go beneath the headlines to understand what’s really going on.
Tracing the move of the S&P 500 and other major stock market indices over the last three months, we find March was a very different month compared to January and February. The S&P 500 peaked on March 1 a hair shy of 2,396 and proceeded to bounce up and down over the following weeks before closing the month and quarter at just under 2,363. All told, the S&P 500 fell 1.4 percent in March.
The question is why and what does it mean as we gear into earnings season for 1Q 2017?
While we’re not really fans of those who pat themselves on the back, we’re going to do just that today because over the last few weeks the market herd has woken up to what we’ve been talking and writing about here, on TematicaResearch.com, the podcast and elsewhere — the growing disconnect between the speed of the domestic economy, earnings expectations and the stock market valuation.
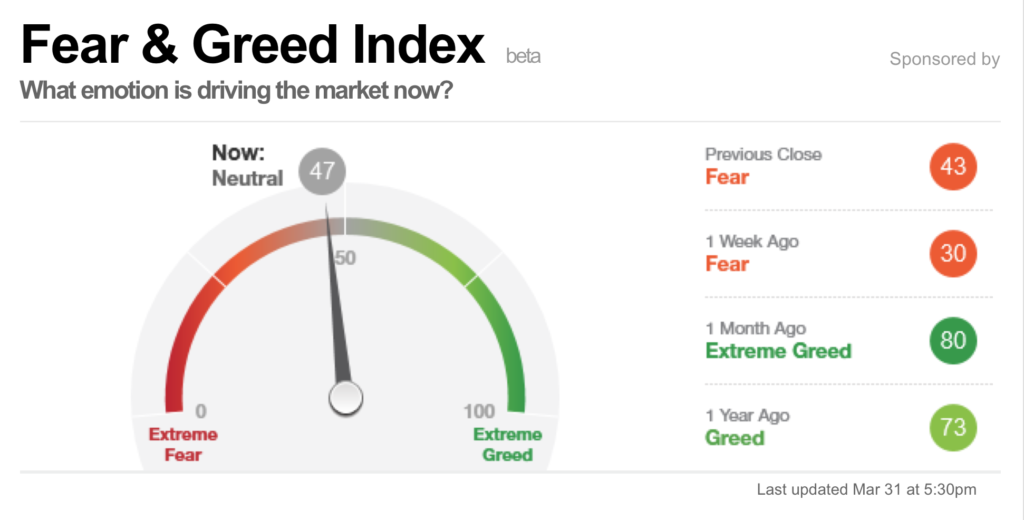
From the now expected push out in Trump’s fiscal stimulus policies to more hard data putting the speed of the US economy at an even slower pace in 1Q 2017 vs. 4Q 2016 to recent earnings reports and corporate guidance that has fallen short of expectations, investors are increasingly scratching their heads. We’ve seen a pronounced shift in the market mindset, as evidenced by the sharp drop in CNN’s Fear & Greed Index, which now sitting at 47 (Neutral), up from 30 (Fear) last week and 80 (Extreme Greed) a month ago.
While the fear level in that index has faded since last week, recent findings from a Bank of America Merrill lunch survey of 165 fund managers that control $500 billion in assets show that 34 percent think stocks are “overvalued” — the highest level in the 17-year history of the survey. As we’ve been pointing out, the market’s valuation has been stretched and despite the move lower in March, the S&P 500 closed the month at 18x expected 2017 earnings that hinge on growing more than 10 percent vs. 2016. As Lenore and I say, tossing numbers out means rather little when there is no context, so here it is — according to data from FactSet, that 18x multiple is the highest P/E ratio since 2004 and well above the five-year average of just 15.
As Sam Stovall, chief investment strategist at CFRA, remarked, “The fundamentals better start picking up the pace in order to justify such extended valuations.”
We could not agree more, but the probability of it happening near-term is rather low and in our view, that means the likelihood of the upcoming earnings season bringing volatility back into the market is rather high.
As we close the books on 1Q 2017 and open them for 2Q 2017 we head into the No Man’s Land that is the first few days of the next quarter. Typically, that time has little corporate news flow given that we are in the quiet period that precedes the earnings onslaught. There’s also the usual dramatic drop in the number of investing related conferences this week, but we will be getting the initial rash of March economic data. That includes reports from ISM, Markit Economics, auto & truck sales and of course the March Employment Report.
This data should help bring GDP expectations for the current quarter into greater focus as well as leave at least some to revisit the timing of the Fed’s next rate hike. There has been much talk of late about a pick up in inflation, but as Lenore explained about on last week’s podcast it’s a pick up that is not only off of a falling base in 2016, it’s one that is likely to reverse course in the coming weeks.
One of those drivers in inflationary readings has been oil prices, which have a ripple effect across the economy touching consumers via gas prices as well as retailers, restaurants and shippers in the form of higher fuel costs. Despite the OPEC production cuts that have taken more than 1 million barrels per day off the oil market, added U.S. capacity and less than booming global economy have led U.S. crude oil inventories to swell. The result has been a reversal in oil prices from roughly $54 in February to 49.51 exiting last week.
In short, we have a situation in which shale output is surging too quickly before OPEC has had the chance to balance the market. Keep in mind, too, that technology refinements have likely lowered the break-even cost for U.S. shale producers, and that could move even lower should industry regulations get dialed back under the Trump administration. With talk of OPEC extending production cuts by another six months as well as disruptions to crude output in Libya, we’ll continue to monitor the situation. With oil being a commodity that is subject to demand-supply dynamics, we’d be remiss is we didn’t point out that continued increases in oil inventories don’t exactly signal a rip, roaring economy. As it sits today, the Atlanta Fed’s GDPNow model forecasts a whopping 0.9% GDP figure for the first quarter of the year, down from 2.1% in 4Q 2016.
As we’ve been saying over the last several weeks, at some point this disconnect between the move higher in the overall market over the last few months, aggressive 2017 earnings expectations for the S&P 500 and speed of the economy will come home to roost. With real average weekly wage gains dipping in February, rising bank card and subprime auto delinquencies rising, and banks once again tightening loan purse strings, there are a number of reasons to suspect GDP expectations for the coming quarters are likely to be revised lower.
Let’s not forget the now increasingly expected push out in infrastructure spending and tax reform, all of which is likely to take some of the hope out of corporate forecasts in the coming weeks. Already we’ve seen gold trade higher and financials trade off, which, while somewhat confirming, also raises questions about the Fed’s ability to continue to boost interest rates in the coming months. It wouldn’t be the first time the Fed embarked on a rate hike cycle at the wrong time.
All this while the latest data from the New York Stock Exchange shows cash borrowed to buy shares, better known as margin debt, hit a record $528.2 billion in February, up from its prior high of $513.3 billion in January. Again, this is happening at a time when stock valuations are stretched, and earnings expectations are confronting a far slower economic backdrop. All that buying on margin just means that any significant pullback has the potential to be a lot more volatile as that leverage works in both directions.
Thematic Earnings Calendar
The following are just some of the earnings announcements we’ll have our eye on for thematic confirmation data points:
Aging of the Population
- Walgreens Boot Alliance (WBA)
Cash-strapped Consumer
- CarMax (KMX)
- PriceSmart (PSMT)
Content is King
- International Speedway (ISCA)
Economic Acceleration/Deceleration
- Greenbrier (GBX)
- RPM International (RPM)
- WD-40 (WDFC)
Fattening of the Population
- Yum China (YUMC)
Guilty Pleasure
- Constellation Brands (ST)
Scarce Resources
- Monsanto (MON)


